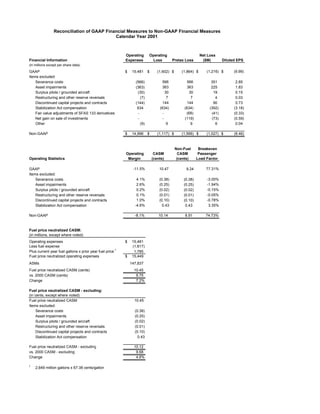
1. Reconciliation of GAAP Financial Measures to Non-GAAP Financial Measures
Calendar Year 2001
Operating Operating Net Loss
Financial Information Expenses Loss Pretax Loss ($M) Diluted EPS
(in millions except per share data)
(1,864) $ (1,216) $ (9.99)
GAAP $ 15,481 $ (1,602) $
Items excluded:
566 566
Severance costs (566) 351 2.85
363 363
Asset impairments (363) 225 1.83
30 30
Surplus pilots / grounded aircraft (30) 19 0.15
7 7
Restructuring and other reserve reversals (7) 4 0.03
144 144
Discontinued capital projects and contracts (144) 90 0.73
(634) (634)
Stabilization Act compensation 634 (392) (3.18)
(68)
Fair value adjustments of SFAS 133 derivatives - - (41) (0.33)
Net gain on sale of investments - - (119) (73) (0.59)
Other (9) 9 9 6 0.04
Non-GAAP $ 14,996 $ (1,117) $ (1,566) $ (1,027) $ (8.46)
Non-Fuel Breakeven
Operating CASM CASM Passenger
Operating Statistics Margin (cents) (cents) Load Factor
-11.5% 10.47 77.31%
GAAP 9.24
Items excluded:
4.1% (0.38) -3.00%
Severance costs (0.38)
2.6% (0.25) -1.94%
Asset impairments (0.25)
0.2% (0.02) -0.15%
Surplus pilots / grounded aircraft (0.02)
0.1% (0.01) -0.05%
Restructuring and other reserve reversals (0.01)
1.0% (0.10) -0.78%
Discontinued capital projects and contracts (0.10)
-4.6% 0.43 3.35%
Stabilization Act compensation 0.43
Non-GAAP -8.1% 10.14 8.91 74.73%
Fuel price neutralized CASM:
(in millions, except where noted)
Operating expenses $ 15,481
Less fuel expense (1,817)
Plus current year fuel gallons x prior year fuel price 1 1,785
Fuel price neutralized operating expenses $ 15,449
ASMs 147,837
Fuel price neutralized CASM (cents) 10.45
vs. 2000 CASM (cents) 9.75
Change 7.2%
Fuel price neutralized CASM - excluding:
(in cents, except where noted)
10.45
Fuel price neutralized CASM
Items excluded:
(0.38)
Severance costs
(0.25)
Asset impairments
(0.02)
Surplus pilots / grounded aircraft
(0.01)
Restructuring and other reserve reversals
(0.10)
Discontinued capital projects and contracts
0.43
Stabilization Act compensation
Fuel price neutralized CASM - excluding 10.12
vs. 2000 CASM - excluding 9.68
Change 4.6%
1
2,649 million gallons x 67.38 cents/gallon
2. Reconciliation of GAAP Financial Measures to Non-GAAP Financial Measures
December 2001 Quarter
Operating Operating Net Loss
Financial Information Expenses Loss Pretax Loss ($M) Diluted EPS
(in millions except per share data)
(1,135) $ (734) $ (5.98)
GAAP $ 3,985 $ (1,122) $
Items excluded:
498 498
Severance costs (498) 309 2.51
303 303
Asset impairments (303) 188 1.53
30 30
Surplus pilots / grounded aircraft (30) 19 0.15
7 7
Restructuring and other reserve reversals (7) 4 0.03
144 144
Discontinued capital projects and contracts (144) 90 0.73
(463) (463)
Stabilization Act compensation 463 (288) (2.34)
(24)
Fair value adjustments of SFAS 133 derivatives - - (15) (0.12)
Net gain on sale of investments - - (108) (66) (0.53)
Other (9) 9 9 7 0.05
Non-GAAP $ 3,457 $ (594) $ (739) $ (486) $ (3.97)
Non-Fuel Breakeven
Operating CASM CASM Passenger
Operating Statistics Margin (cents) (cents) Load Factor
-39.2% 11.67 90.69%
GAAP 10.59
Items excluded:
17.4% (1.46) -12.01%
Severance costs (1.46)
10.6% (0.89) -7.31%
Asset impairments (0.89)
1.0% (0.09) -0.73%
Surplus pilots / grounded aircraft (0.09)
0.2% (0.02) -0.16%
Restructuring and other reserve reversals (0.02)
5.0% (0.42) -3.48%
Discontinued capital projects and contracts (0.42)
-16.2% 1.36 11.17%
Stabilization Act compensation 1.36
0.3% (0.03) -0.22%
Other (0.02)
Non-GAAP -20.7% 10.12 9.05 77.96%
Fuel price neutralized CASM:
(in millions, except where noted)
Operating expenses 3,985
Less fuel expense (368)
(1)
Plus current year fuel gallons x prior year fuel price 445
Fuel price neutralized operating expenses 4,062
ASMs 34,141
Fuel price neutralized CASM (cents) 11.90
vs. December 2000 quarter CASM (cents) 9.96
Change 19.4%
Fuel price neutralized CASM - excluding:
(in cents, except where noted)
11.90
Fuel price neutralized CASM
Items excluded:
(1.46)
Severance costs
(0.89)
Asset impairments
(0.09)
Surplus pilots / grounded aircraft
(0.02)
Restructuring and other reserve reversals
(0.42)
Discontinued capital projects and contracts
1.36
Stabilization Act compensation
(0.03)
Other
Fuel price neutralized CASM - excluding 10.35
vs. 2000 CASM - excluding 9.96
Change 3.9%
(1)
592.9 million gallons x 75.05 cents/gallon
Net Debt-to-Capital Ratio
(in millions)
LT debt (including current maturities)
and short-term obligations $ 9,304
Capital leases (including current) 99
(2)
Net implied debt 6,701
Net total debt 16,104
Net total debt 16,104
ESOP preferred stock 255
Shareowners' equity 3,769
Total capital $ 20,128
Net debt-to-capital ratio 80%
(2)
Net implied debt represents the present value of our obligations under operating leases, net of cash, cash equivalents
and short term investments.
3. Reconciliation of GAAP Financial Measures to Non-GAAP Financial Measures
September 2001 Quarter
Operating Operating Net Loss
Financial Information Expenses Loss Pretax Loss ($M) Diluted EPS
(in millions except per share data)
(408) $ (259) $ (2.13)
GAAP $ 3,649 $ (251) $
Items excluded:
68 68
Severance costs (68) 42 0.34
(171) (171)
Stabilization Act compensation 171 (104) (0.85)
54
Fair value adjustments of SFAS 133 derivatives - - 33 0.27
(11)
Net gain on sale of investments - - (7) (0.06)
Non-GAAP $ 3,752 $ (354) $ (468) $ (295) $ (2.43)
Non-Fuel Breakeven
Operating CASM CASM Passenger
Operating Statistics Margin (cents) (cents) Load Factor
-7.4% 9.67 76.86%
GAAP 8.42
Items excluded:
2.0% (0.18) -1.51%
Severance costs (0.18)
-5.0% 0.45 3.82%
Stabilization Act compensation 0.45
Non-GAAP -10.4% 9.94 8.69 79.16%
Net Debt-to-Capital Ratio
(in millions)
LT debt (including current maturities)
and short-term obligations $ 8,953
Capital leases (including current) 116
(1)
Net implied debt 6,440
Net total debt 15,509
Net total debt 15,509
ESOP preferred stock 256
Shareowners' equity 4,635
Total capital $ 20,400
Net debt-to-capital ratio 76%
(1)
Net implied debt represents the present value of our obligations under operating leases, net of cash, cash equivalents
and short term investments.
4. Reconciliation of GAAP Financial Measures to Non-GAAP Financial Measures
June 2001 Quarter
Operating Operating Net Loss
Financial Information Expenses Loss Pretax Loss ($M) Diluted EPS
(in millions except per share data)
(99) $ (90) $ (0.76)
GAAP $ 3,890 $ (114) $
Items excluded:
60 60
Asset impairments (60) 36 0.30
(112)
Fair value adjustments of SFAS 133 derivatives - - (69) (0.57)
Non-GAAP $ 3,830 $ (54) $ (151) $ (123) $ (1.03)
Non-Fuel Breakeven
Operating CASM CASM Passenger
Operating Statistics Margin (cents) (cents) Load Factor
-3.0% 10.17 75.12%
GAAP 8.96
Items excluded:
1.7% (0.15) -1.24%
Asset impairments (0.15)
Non-GAAP -1.3% 10.02 8.81 73.88%
Net Debt-to-Capital Ratio
(in millions)
LT debt (including current maturities)
and short-term obligations $ 6,711
Capital leases (including current) 130
Net implied debt (1) 7,721
Net total debt 14,562
Net total debt 14,562
ESOP preferred stock 231
Shareowners' equity 5,030
Total capital $ 19,823
Net debt-to-capital ratio 73%
(1)
Net implied debt represents the present value of our obligations under operating leases, net of cash, cash equivalents
and short term investments.
5. Reconciliation of GAAP Financial Measures to Non-GAAP Financial Measures
March 2001 Quarter
Operating Operating Net Loss
Financial Information Expenses Loss Pretax Loss ($M) Diluted EPS
(in millions except per share data)
(222) $ (133) $ (1.11)
GAAP $ 3,957 $ (115) $
Items excluded:
17
Fair value adjustments of SFAS 133 derivatives - - 11 0.09
Non-GAAP $ 3,957 $ (115) $ (205) $ (122) $ (1.02)
Net Debt-to-Capital Ratio
(in millions)
LT debt (including current maturities)
and short-term obligations $ 5,959
Capital leases (including current) 134
(1)
Net implied debt 8,054
Net total debt 14,147
Net total debt 14,147
ESOP preferred stock 233
Shareowners' equity 5,128
Total capital $ 19,508
Net debt-to-capital ratio 73%
(1)
Net implied debt represents the present value of our obligations under operating leases, net of cash, cash equivalents
and short term investments.