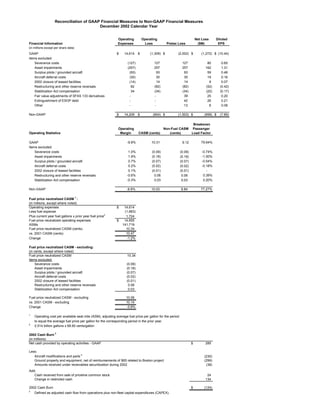
1. Reconciliation of GAAP Financial Measures to Non-GAAP Financial Measures
December 2002 Calendar Year
Operating Operating Net Loss Diluted
Financial Information Expenses Loss Pretax Loss ($M) EPS
(in millions except per share data)
(2,002) $ (1,272) $ (10.44)
GAAP $ 14,614 $ (1,309) $
Items excluded:
127 127
Severance costs (127) 80 0.65
257 257
Asset impairments (257) 162 1.31
93 93
Surplus pilots / grounded aircraft (93) 59 0.48
30 30
Aircraft deferral costs (30) 19 0.16
14 14
2002 closure of leased facilities (14) 9 0.07
(82) (82)
Restructuring and other reserve reversals 82 (52) (0.42)
(34) (34)
Stabilization Act compensation 34 (22) (0.17)
39
Fair value adjustments of SFAS 133 derivatives - - 25 0.20
Extinguishment of ESOP debt - - 42 26 0.21
Other - - 13 8 0.06
Non-GAAP $ 14,209 $ (904) $ (1,503) $ (958) $ (7.89)
Breakeven
Operating Non-Fuel CASM Passenger
Operating Statistics Margin CASM (cents) (cents) Load Factor
-9.8% 10.31 79.64%
GAAP 9.12
Items excluded:
1.0% (0.09) -0.74%
Severance costs (0.09)
1.9% (0.18) -1.50%
Asset impairments (0.18)
0.7% (0.07) -0.54%
Surplus pilots / grounded aircraft (0.07)
0.2% (0.02) -0.18%
Aircraft deferral costs (0.02)
0.1% (0.01)
2002 closure of leased facilities (0.01) -
-0.6% 0.06 0.39%
Restructuring and other reserve reversals 0.06
-0.3% 0.03 0.20%
Stabilization Act compensation 0.03
Non-GAAP -6.8% 10.03 8.84 77.27%
1
Fuel price neutralized CASM :
(in millions, except where noted)
Operating expenses $ 14,614
Less fuel expense (1,683)
Plus current year fuel gallons x prior year fuel price2 1,724
Fuel price neutralized operating expenses $ 14,655
ASMs 141,719
Fuel price neutralized CASM (cents) 10.34
vs. 2001 CASM (cents) 10.47
Change -1.2%
Fuel price neutralized CASM - excluding:
(in cents, except where noted)
Fuel price neutralized CASM 10.34
Items excluded:
Severance costs (0.09)
Asset impairments (0.18)
Surplus pilots / grounded aircraft (0.07)
Aircraft deferral costs (0.02)
2002 closure of leased facilities (0.01)
Restructuring and other reserve reversals 0.06
Stabilization Act compensation 0.03
Fuel price neutralized CASM - excluding 10.06
vs. 2001 CASM - excluding 10.14
Change -0.8%
1
Operating cost per available seat mile (ASM), adjusting average fuel price per gallon for the period
to equal the average fuel price per gallon for the corresponding period in the prior year.
2
2.514 billion gallons x 68.60 cents/gallon
2002 Cash Burn 3
(in millions)
Net cash provided by operating activities - GAAP $ 285
Less:
Aircraft modifications and parts 4 (230)
Ground property and equipment, net of reimbursements of $65 related to Boston project (299)
Amounts received under receivables securitization during 2002 (38)
Add:
Cash received from sale of priceline common stock 24
Change in restricted cash 134
2002 Cash Burn $ (124)
3
Defined as adjusted cash flow from operations plus non-fleet capital expenditures (CAPEX).
2. 4
Included in additions of flight equipment in the Consolidated Statement of Cash Flows.
2002 Costs as a Percentage of Total Operating Expenses - Non-GAAP
(in millions)
Salaries and related costs (quot;employment costsquot;) $ 6,165
Operating expenses - non-GAAP (see above) $ 14,209
Employment costs as a percentage of total operating expenses - non-GAAP 43%
Aircraft fuel (quot;fuelquot;) $ 1,683
Flight equipment depreciation (quot;fleet depreciationquot;)5 811
Aircraft rent (quot;fleet rentquot;) 709
Total fuel, fleet depreciation and fleet rent $ 3,203
Operating expenses - non-GAAP (see above) $ 14,209
Total fuel, fleet depreciation and fleet rent as a percentage of total operating expenses - non-GAAP 23%
Operating expenses - non-GAAP (see above) $ 14,209
Less:
Salaries and related costs (6,165)
Aircraft fuel (1,683)
Flight equipment depreciation5 (811)
Aircraft rent (709)
Total other operating expenses $ 4,841
Operating expenses - non-GAAP (see above) $ 14,209
Total other operating expenses as a percentage of total operating expenses - non-GAAP 34%
5
Flight equipment depreciation of $811 million is a component of depreciation and amortization totaling
$1,148 million for 2002.
2002 Costs as a Percentage of Total Operating Revenues
(in millions)
Operating expenses - non-GAAP (see above) $ 14,209
Less:
Salaries and related costs (6,165)
Aircraft fuel (1,683)
Depreciation and amortization (1,148)
Aircraft rent (709)
Total other operating expenses $ 4,504
Total operating revenues $ 13,305
Total other operating expenses as a percentage of total operating revenues 34%
2002 Mainline Costs per ASM
(in millions, except where noted)
Salaries and related costs (quot;employment costsquot;) $ 6,165
Less subsidiary employment costs expenses6 (486)
Mainline employment costs $ 5,679
Mainline ASMs 131,140
Mainline employment costs per ASM (cents) 4.3
Aircraft fuel (quot;fuelquot;) $ 1,683
Depreciation and amortization (quot;fleet depreciationquot;) 1,148
Aircraft rent (quot;fleet rentquot;) 709
Total fuel, fleet depreciation and fleet rent 3,540
Less subsidiary fuel, fleet depreciation and fleet rent6 (458)
Mainline fuel, fleet depreciation and fleet rent $ 3,082
Mainline ASMs 131,140
Mainline fuel, fleet depreciation and fleet rent per ASM (cents) 2.4
Operating expenses - non-GAAP (see above) $ 14,209
Less subsidiary operating expenses 6 (1,449)
Mainline operating expenses - non-GAAP 12,760
Less:
Mainline employment costs (see above) (5,679)
Mainline fuel, fleet depreciation and fleet rent (see above) (3,082)
Mainline other operating expenses $ 3,999
Mainline ASMs 131,140
Mainline other operating expenses per ASM (cents) 3.0
6
Represents operating expenses for our regional jet operations including Atlantic Southeast Airlines, Inc. and
Comair, Inc., two of our wholly owned subsidiaries.
3. Reconciliation of GAAP Financial Measures to Non-GAAP Financial Measures
December 2002 Quarter
Operating Operating Net Loss Diluted
Financial Information Expenses Loss Pretax Loss ($M) EPS
(in millions except per share data)
(586) $ (363) $ (2.98)
GAAP $ 3,670 $ (362) $
Items excluded:
127 127
Severance costs (127) 80 0.65
37 37
Asset impairments (37) 23 0.19
12 12
Surplus pilots / grounded aircraft (12) 8 0.06
30 30
Aircraft deferral costs (30) 19 0.16
14 14
2002 closure of leased facilities (14) 9 0.07
(69) (69)
Restructuring and other reserve reversals 69 (44) (0.35)
6
Fair value adjustments of SFAS 133 derivatives - - 4 0.03
Extinguishment of ESOP debt - - 42 26 0.21
Other - - 13 8 0.06
Non-GAAP $ 3,519 $ (211) $ (374) $ (230) $ (1.90)
Non-Fuel Breakeven
Operating CASM CASM Passenger
Operating Statistics Margin (cents) (cents) Load Factor
-10.9% 10.40 79.62%
GAAP 9.06
Items excluded:
3.8% (0.36) -2.96%
Severance costs (0.36)
1.1% (0.10) -0.87%
Asset impairments (0.10)
0.4% (0.03) -0.25%
Surplus pilots / grounded aircraft (0.03)
0.9% (0.09) -0.71%
Aircraft deferral costs (0.09)
0.4% (0.04) -0.33%
2002 closure of leased facilities (0.04)
-2.1% 0.19 1.60%
Restructuring and other reserve reversals 0.19
Non-GAAP -6.4% 9.97 8.63 76.10%
Fuel price neutralized CASM:
(in millions, except where noted)
Operating expenses $ 3,670
Less fuel expense (475)
Plus current year fuel gallons x prior year fuel price (1) 388
Fuel price neutralized operating expenses $ 3,583
ASMs 35,280
Fuel price neutralized CASM (cents) 10.15
vs. December 2001 quarter CASM (cents) 11.67
Change -13.0%
Fuel price neutralized CASM - excluding:
(in cents, except where noted)
Fuel price neutralized CASM 10.15
Items excluded:
Severance costs (0.36)
Asset impairments (0.10)
Surplus pilots / grounded aircraft (0.03)
Aircraft deferral costs (0.09)
2002 closure of leased facilities (0.04)
Restructuring and other reserve reversals 0.21
Fuel price neutralized CASM - excluding 9.73
vs. December 2001 quarter CASM - excluding 10.12
Change -3.9%
(1)
625 million gallons x 62.04 cents/gallon
Net Debt-to-Capital Ratio
(in millions)
LT debt (including current maturities)
and short-term obligations $ 10,740
Capital leases (including current) 127
Net implied debt (2) 6,218
Net total debt 17,085
Net total debt 17,085
ESOP preferred stock 264
Shareowners' equity 893
Total capital $ 18,242
Net debt-to-capital ratio 94%
(2)
Net implied debt represents the present value of our obligations under operating leases, net of cash, cash equivalents
and short term investments.
4. Reconciliation of GAAP Financial Measures to Non-GAAP Financial Measures
September 2002 Quarter
Operating Operating Net Loss
Financial Information Expenses Loss Pretax Loss ($M) Diluted EPS
(in millions except per share data)
(527) $ (326) $ (2.67)
GAAP $ 3,805 $ (385) $
Items excluded:
220 220
Asset impairments (220) 139 1.13
18 18
Surplus pilots / grounded aircraft (18) 11 0.09
(13) (13)
Restructuring and other reserve reversals 13 (8) (0.07)
(34) (34)
Stabilization Act compensation 34 (22) (0.18)
(10)
Fair value adjustments of SFAS 133 derivatives - - (6) (0.05)
Non-GAAP $ 3,614 $ (194) $ (346) $ (212) $ (1.75)
Non-Fuel Breakeven
Operating CASM CASM Passenger
Operating Statistics Margin (cents) (cents) Load Factor
-11.3% 10.33 83.29%
GAAP 9.06
Items excluded:
6.4% (0.60) -5.16%
Asset impairments (0.60)
0.5% (0.05) -0.42%
Surplus pilots / grounded aircraft (0.05)
-0.4% 0.04 0.31%
Restructuring and other reserve reversals 0.04
-1.0% 0.09 0.78%
Stabilization Act compensation 0.09
Non-GAAP -5.7% 9.81 8.54 78.80%
Fuel price neutralized CASM:
(in millions, except where noted)
Operating expenses $ 3,805
Less fuel expense (468)
Plus current year fuel gallons x prior year fuel price(1) 457
Fuel price neutralized operating expenses $ 3,794
ASMs 36,840
Fuel price neutralized CASM (cents) 10.30
vs. September 2001 quarter CASM (cents) 9.67
Change 6.5%
Fuel price neutralized CASM - excluding:
(in cents, except where noted)
Fuel price neutralized CASM 10.30
Items excluded:
Asset impairments (0.60)
Surplus pilots / grounded aircraft (0.05)
Restructuring and other reserve reversals 0.04
Stabilization Act compensation 0.09
Fuel price neutralized CASM - excluding 9.78
vs. September 2001 quarter CASM - excluding 9.94
Change -1.6%
(1)
656 million gallons x 69.63 cents/gallon
Net Debt-to-Capital Ratio
(in millions)
LT debt (including current maturities)
and short-term obligations $ 10,141
Capital leases (including current) 75
Net implied debt (2) 6,331
Net total debt 16,547
Net total debt 16,547
ESOP preferred stock 250
Shareowners' equity 2,845
Total capital $ 19,642
Net debt-to-capital ratio 84%
(2)
Net implied debt represents the present value of our obligations under operating leases, net of cash, cash equivalents
and short term investments.
5. Reconciliation of GAAP Financial Measures to Non-GAAP Financial Measures
June 2002 Quarter
Operating Operating Net Loss Diluted
Financial Information Expenses Loss Pretax Loss ($M) EPS
(in millions except per share data)
(287) $ (186) $ (1.54)
GAAP $ 3,601 $ (127) $
Items excluded:
23 23
Surplus pilots / grounded aircraft (23) 15 0.12
15
Fair value adjustments of SFAS 133 derivatives - - 9 0.08
Non-GAAP $ 3,578 $ (104) $ (249) $ (162) $ (1.34)
Non-Fuel Breakeven
Operating CASM CASM Passenger
Operating Statistics Margin (cents) (cents) Load Factor
-3.7% 10.05 76.30%
GAAP 8.92
Items excluded:
0.7% (0.07) -0.51%
Surplus pilots / grounded aircraft (0.06)
Non-GAAP -3.0% 9.98 8.86 75.79%
Fuel price neutralized CASM:
(in millions, except where noted)
Operating expenses $ 3,601
Less fuel expense (401)
Plus current year fuel gallons x prior year fuel price (1) 431
Fuel price neutralized operating expenses $ 3,631
ASMs 35,859
Fuel price neutralized CASM (cents) 10.13
vs. June 2001 quarter CASM (cents) 10.17
Change -0.4%
Fuel price neutralized CASM - excluding:
(in cents, except where noted)
Fuel price neutralized CASM 10.13
Items excluded:
Surplus pilots / grounded aircraft (0.06)
Fuel price neutralized CASM - excluding 10.07
vs. June 2001 quarter CASM - excluding 10.02
Change 0.5%
(1)
635 million gallons x 67.95 cents/gallon
Net Debt-to-Capital Ratio
(in millions)
LT debt (including current maturities)
and short-term obligations $ 9,939
Capital leases (including current) 91
(2)
Net implied debt 6,551
Net total debt 16,581
Net total debt 16,581
ESOP preferred stock 242
Shareowners' equity 3,179
Total capital $ 20,002
Net debt-to-capital ratio 83%
(2)
Net implied debt represents the present value of our obligations under operating leases, net of cash, cash equivalents
and short term investments.
6. Reconciliation of GAAP Financial Measures to Non-GAAP Financial Measures
March 2002 Quarter
Operating Operating
Financial Information Expenses Loss Pretax Loss Net Loss ($M) Diluted EPS
(in millions except per share data)
(602) $ (397) $ (3.25)
GAAP $ 3,538 $ (435) $
Items excluded:
40 40
Surplus pilots / grounded aircraft (40) 25 0.21
28
Fair value adjustments of SFAS 133 derivatives - - 18 0.14
Non-GAAP $ 3,498 $ (395) $ (534) $ (354) $ (2.90)
Non-Fuel Breakeven
Operating CASM CASM Passenger
Operating Statistics Margin (cents) (cents) Load Factor
-14.0% 10.49 79.26%
GAAP 9.48
Items excluded:
1.3% (0.12) -0.96%
Surplus pilots / grounded aircraft (0.12)
Non-GAAP -12.7% 10.37 9.36 78.30%
Fuel price neutralized CASM:
(in millions, except where noted)
Operating expenses $ 3,538
Less fuel expense (339)
Plus current year fuel gallons x prior year fuel price (1) 442
Fuel price neutralized operating expenses $ 3,641
ASMs 33,740
Fuel price neutralized CASM (cents) 10.79
vs. March 2001 quarter CASM (cents) 10.49
Change 2.9%
Fuel price neutralized CASM - excluding:
(in cents, except where noted)
Fuel price neutralized CASM 10.79
Items excluded:
Surplus pilots / grounded aircraft (0.12)
Fuel price neutralized CASM - excluding 10.67
vs. March 2001 quarter CASM - excluding 10.49
Change 1.7%
(1)
599 million gallons x 73.81 cents/gallon
Net Debt-to-Capital Ratio
(in millions)
LT debt (including current maturities)
and short-term obligations $ 9,336
Capital leases (including current) 95
Net implied debt (2) 7,403
Net total debt 16,834
Net total debt 16,834
ESOP preferred stock 245
Shareowners' equity 3,411
Total capital $ 20,490
Net debt-to-capital ratio 82%
(2)
Net implied debt represents the present value of our obligations under operating leases, net of cash, cash equivalents
and short term investments.