Introduction to Health Economics Dr. R. Kurinji Malar.pptx
tech data Fourth-Quarter and Fiscal-Year 2008
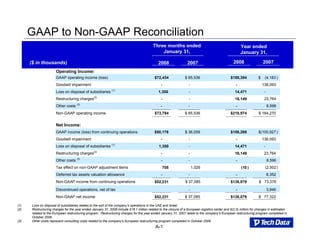
1. GAAP to Non-GAAP Reconciliation
Three months ended Year ended
January 31, January 31,
2008 2007
($ in thousands) 2008 2007
Operating Income:
GAAP operating income (loss) $ 65,536 $ (4,183 )
$72,434 $188,354
Goodwill impairment - 136,093
- -
(1)
Loss on disposal of subsidiaries - -
1,350 14,471
(2)
Restructuring charges - 23,764
- 16,149
(3)
Other costs - 8,596
- -
Non-GAAP operating income $ 65,536 $ 164,270
$73,784 $218,974
Net Income:
GAAP income (loss) from continuing operations $ 36,059 $(100,927 )
$50,176 $108,269
Goodwill impairment - 136,093
- -
Loss on disposal of subsidiaries (1) - -
1,350 14,471
(2)
Restructuring charges - 23,764
- 16,149
(3)
Other costs - 8,596
- -
Tax effect on non-GAAP adjustment items 1,026 (2,502 )
705 (10 )
Deferred tax assets valuation allowance - 8,352
- -
Non-GAAP income from continuing operations $ 37,085 $ 73,376
$52,231 $138,879
Discontinued operations, net of tax - 3,946
-
Non-GAAP net income $ 37,085 $ 77,322
$52,231 $138,879
(1) Loss on disposal of subsidiaries relates to the exit of the company’s operations in the UAE and Israel.
(2) Restructuring charges for the year ended January 31, 2008 include $18.1 million related to the closure of a European logistics center and $(2.0) million for changes in estimates
related to the European restructuring program. Restructuring charges for the year ended January 31, 2007 relate to the company’s European restructuring program completed in
October 2006.
(3) Other costs represent consulting costs related to the company’s European restructuring program completed in October 2006.
A-1
2. GAAP to Non-GAAP Reconciliation (continued)
Three months ended Year ended
January 31, January 31,
2008 2007
2007
2008
Net Income per Diluted Share(1)
GAAP net income (loss) per share from continuing operations $ .66 $(1.83 )
$.92 $1.96
Goodwill impairment - 2.46
- -
(2)
Loss on disposal of subsidiaries - -
.03 .26
(3)
Restructuring charges - .43
- .29
(4)
Other costs - .16
- -
Tax effect on non-GAAP adjustment items .01 (.04 )
.01 -
Deferred tax assets valuation allowance - .15
- -
Non-GAAP income per diluted share from continuing operations $ .67 $ 1.33
$ .96 $2.51
Discontinued operations, net of tax - .07
- -
Non-GAAP net income per diluted share $ .67 $ 1.40
$.96 $2.51
Weighted average common shares outstanding (in thousands)
Diluted 55,011 55,289
54,607 55,287
(1) Periods that incurred a GAAP net loss per share from continuing operations are calculated using basic weighted average
common shares outstanding located in the Consolidated Statement of Operations.
(2) Loss on disposal of subsidiaries relates to the exit of the company’s operations in the UAE and Israel.
(3) Restructuring charges for the year ended January 31, 2008 include $18.1 million related to the closure of a European logistics
center and $(2.0) million for changes in estimates related to the European restructuring program. Restructuring charges for the
year ended January 31, 2007 relate to the company’s European restructuring program completed in October 2006.
(4) Other costs represent consulting costs related to the Company’s European restructuring program completed in October 2006.
A-2