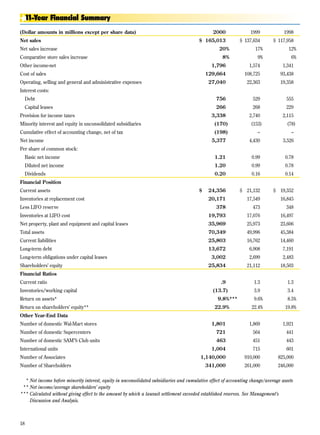
1. 11-Year Financial Summary
1999 1998
(Dollar amounts in millions except per share data) 2000
$ 137,634 $ 117,958
Net sales $ 165,013
Net sales increase 17% 12%
20%
Comparative store sales increase 9% 6%
8%
Other income-net 1,574 1,341
1,796
Cost of sales 108,725 93,438
129,664
Operating, selling and general and administrative expenses 22,363 19,358
27,040
Interest costs:
Debt 529 555
756
Capital leases 268 229
266
Provision for income taxes 2,740 2,115
3,338
Minority interest and equity in unconsolidated subsidiaries (153) (78)
(170)
Cumulative effect of accounting change, net of tax – –
(198)
Net income 4,430 3,526
5,377
Per share of common stock:
Basic net income 0.99 0.78
1.21
Diluted net income 0.99 0.78
1.20
Dividends 0.16 0.14
0.20
Financial Position
Current assets $ 21,132 $ 19,352
$ 24,356
Inventories at replacement cost 17,549 16,845
20,171
Less LIFO reserve 473 348
378
Inventories at LIFO cost 17,076 16,497
19,793
Net property, plant and equipment and capital leases 25,973 23,606
35,969
Total assets 49,996 45,384
70,349
Current liabilities 16,762 14,460
25,803
Long-term debt 6,908 7,191
13,672
Long-term obligations under capital leases 2,699 2,483
3,002
Shareholders’ equity 21,112 18,503
25,834
Financial Ratios
Current ratio 1.3 1.3
.9
Inventories/working capital 3.9 3.4
(13.7)
Return on assets* 9.6% 8.5%
9.8%***
Return on shareholders’ equity** 22.4% 19.8%
22.9%
Other Year-End Data
Number of domestic Wal-Mart stores 1,869 1,921
1,801
Number of domestic Supercenters 564 441
721
Number of domestic SAM’S Club units 451 443
463
International units 715 601
1,004
Number of Associates 910,000 825,000
1,140,000
Number of Shareholders 261,000 246,000
341,000
*** Net income before minority interest, equity in unconsolidated subsidiaries and cumulative effect of accounting change/average assets
*** Net income/average shareholders’ equity
*** Calculated without giving effect to the amount by which a lawsuit settlement exceeded established reserves. See Management’s
Discussion and Analysis.
18
2. 1997 1996 1995 1994 1993 1992 1991 1990
$ 104,859 $ 93,627 $ 82,494 $ 67,344 $ 55,484 $ 43,887 $ 32,602 $ 25,811
12% 13% 22% 21% 26% 35% 26% 25%
5% 4% 7% 6% 11% 10% 10% 11%
1,319 1,146 914 645 497 404 262 175
83,510 74,505 65,586 53,444 44,175 34,786 25,500 20,070
16,946 15,021 12,858 10,333 8,321 6,684 5,152 4,070
629 692 520 331 143 113 43 20
216 196 186 186 180 153 126 118
1,794 1,606 1,581 1,358 1,171 945 752 632
(27) (13) 4 (4) 4 (1) – –
– – – – – – – –
3,056 2,740 2,681 2,333 1,995 1,609 1,291 1,076
0.67 0.60 0.59 0.51 0.44 0.35 0.28 0.24
0.67 0.60 0.59 0.51 0.44 0.35 0.28 0.24
0.11 0.10 0.09 0.07 0.05 0.04 0.04 0.03
$ 17,993 $ 17,331 $ 15,338 $ 12,114 $ 10,198 $ 8,575 $ 6,415 $ 4,713
16,193 16,300 14,415 11,483 9,780 7,857 6,207 4,751
296 311 351 469 512 473 399 323
15,897 15,989 14,064 11,014 9,268 7,384 5,808 4,428
20,324 18,894 15,874 13,176 9,793 6,434 4,712 3,430
39,604 37,541 32,819 26,441 20,565 15,443 11,389 8,198
10,957 11,454 9,973 7,406 6,754 5,004 3,990 2,845
7,709 8,508 7,871 6,156 3,073 1,722 740 185
2,307 2,092 1,838 1,804 1,772 1,556 1,159 1,087
17,143 14,756 12,726 10,753 8,759 6,990 5,366 3,966
1.6 1.5 1.5 1.6 1.5 1.7 1.6 1.7
2.3 2.7 2.6 2.3 2.7 2.1 2.4 2.4
7.9% 7.8% 9.0% 9.9% 11.1% 12.0% 13.2% 14.8%
19.2% 19.9% 22.8% 23.9% 25.3% 26.0% 27.7% 30.9%
1,960 1,995 1,985 1,950 1,848 1,714 1,568 1,399
344 239 147 72 34 10 9 6
436 433 426 417 256 208 148 123
314 276 226 24 10 – – –
728,000 675,000 622,000 528,000 434,000 371,000 328,000 271,000
257,000 244,000 259,000 258,000 181,000 150,000 122,000 80,000
The effects of the change in accounting method for SAM’S Club membership revenue recognition would not have a material impact on this
summary prior to 1998. Therefore, pro forma information as if the accounting change had been in effect for all years presented has not been
provided. See Management’s Discussion and Analysis for discussion of the impact of the accounting change in fiscal 2000, 1999 and 1998.
The acquisition of the ASDA Group PLC and the Company’s related debt issuance had a significant impact on the fiscal 2000 amounts in this
summary. See Notes 3 and 6 to the Consolidated Financial Statements.
19
3. Management’s Discussion and Analysis
Net Sales
Sales (in millions) by operating segment for the three fiscal years ended January 31, are as follows:
Fiscal Year Wal-Mart Stores SAM’S Club International Other (McLane) Total Company Total Company Increase
2000 $108,721 $24,801 $22,728 $8,763 $165,013 20%
1999 95,395 22,881 12,247 7,111 137,634 17%
1998 83,820 20,668 7,517 5,953 117,958 12%
Wal-Mart Stores
The Company’s sales growth of 20% in fiscal 2000, when compared
to fiscal 1999, is the result of the Company’s expansion program,
including international acquisition, and a domestic comparative Sales for the Company’s Wal-Mart Stores segment increased by
store sales increase of 8%. The sales increase of 17% in fiscal 1999, 14.0% in fiscal 2000 when compared to fiscal 1999, and 13.8% in fiscal
when compared to fiscal 1998, was also attributable to our 1999 when compared to fiscal 1998. The fiscal 2000 growth is the
expansion program and a domestic comparative store sales result of comparative store sales increases and the Company’s
increase of 9%. expansion program. Segment expansion during fiscal 2000 included
the opening of 29 Wal-Mart stores and 157 Supercenters (including
Costs and Expenses the conversion of 96 existing Wal-Mart stores into Supercenters).
Fiscal 1999 growth is also the result of comparative store sales
increases and the Company’s expansion program. Segment
Cost of sales, as a percentage of sales, decreased, resulting in
expansion during fiscal 1999 included the opening of 37 Wal-Mart
increases in gross margin of .4% and .2% in fiscal 2000 and fiscal
stores and 123 Supercenters (including the conversion of 88
1999, respectively. These improvements in gross margin occurred
existing Wal-Mart stores into Supercenters). Operating income for
even with continued price rollbacks, our continuing commitment to
the segment for fiscal 2000 increased by 19%, from $7.0 billion in
always providing low prices and higher international and food
fiscal 1999 to $8.4 billion in fiscal 2000. 1999 segment operating
department sales which generally have lower gross margins than
income increased by 21%, from $5.8 billion in 1998 to $7.0 billion in
domestic general merchandise. The fiscal 2000 improvement in
1999. The improvement in operating income in 2000 has been
gross margin can be attributed to a favorable sales mix of higher
driven by margin improvements resulting from improvements in
margin categories, improvements in shrinkage and markdowns, a
markdowns and shrinkage. However, these margin improvements
favorable LIFO inventory adjustment and the slower growth of
were somewhat offset by increased payroll costs. Fiscal 1999
SAM’S Club, which is our lowest gross margin retail operation. The
margin improvements were the result of lower inventory levels,
gross margin improvement in fiscal 1999 was the result of lower
which generated lower markdowns and reduced shrinkage.
inventory levels, which resulted in reduced markdowns and
decreased shrinkage.
SAM’S Club
Operating, selling, general and administrative expenses increased
.1% as a percentage of sales in fiscal 2000 when compared with fiscal Sales for the Company’s SAM’S Club segment increased by 8.4% in
1999. This increase was partially due to increased payroll cost fiscal 2000 when compared to fiscal 1999, and by 10.7% in fiscal 1999
incurred during the year. Additionally, in the second quarter of fiscal when compared to fiscal 1998. SAM’S Club sales continued to
2000, a $624 million jury verdict was rendered against the Company decrease as a percentage of total Company sales, decreasing from
in a lawsuit. The Company agreed to settle the lawsuit for an 17.5% in fiscal 1998 to 16.6% in fiscal 1999 and to 15.0% in fiscal 2000.
amount less than the jury verdict. The Company had previously This decrease as a percentage of total Company sales is primarily
established reserves related to this lawsuit, which were not material the result of the increased growth rate in the international segment.
to its results of operations or financial position. The settlement SAM’S Club segment expansion during fiscal 2000 and 1999
exceeded the Company’s estimated reserves for this lawsuit and consisted of the opening of twelve and eight clubs, respectively, and
resulted in a charge in the second quarter of fiscal 2000 of $.03 per the Company has plans for continued new club openings in fiscal
share net of taxes. 2001. Additionally, the Company intends to continue its program of
remodeling its existing SAM’S Club. After consideration of the
Operating, selling, general and administrative expenses decreased effects of the change in accounting method for membership
.2% as a percentage of sales in fiscal 1999 when compared with fiscal revenue recognition, operating income for the segment in fiscal
1998. The strong sales increase along with lower inventory levels 2000 increased by 16.8%, from $650 million in fiscal 1999 to
combined to reduce expenses as a percentage of sales. The expense $759 million in fiscal 2000. The pretax impact of the change in
leverage was mitigated in the consolidated results due to the accounting method would have been $57 million in fiscal 1999 and
percentage of the total volume decreasing in the SAM’S Club was $16 million in fiscal 2000. The impact of the accounting method
segment, which has lower expenses as a percentage of sales, while change is greater on fiscal 1999 due to an increase in the cost of
the percentage of total volume increased in the International SAM’S Club membership that occurred during that year. If the
segment, which has higher expenses as a percentage of sales than effect of this accounting change is not considered, operating income
the other operating segments. Every operating segment was flat or would have been basically flat as a percent of segment sales when
down in expenses as a percent of sales in fiscal 1999 when comparing fiscal 1999 to fiscal 2000. Fiscal 1999 saw a 7.6% increase
compared with fiscal 1998. in operating income after consideration of the accounting change,
when operating income increased from $604 million in fiscal 1998 to
$650 million in fiscal 1999. The pretax impact of the accounting
change on fiscal 1998 would have been $12 million. Ignoring the
effect of this change, operating income increased from 3.0% of
segment sales in fiscal 1998 to 3.1% of segment sales in fiscal 1999.
20
4. International $260 million in fiscal 1998 to $549 million in fiscal 1999. Because the
Cifra and Wertkauf acquisitions occurred during the last half of fiscal
1998, the additional operating profit resulting from these acquisitions
International sales accounted for approximately 13.8% of total
accounts for a part of the increase in the international segment’s
Company sales in fiscal 2000 compared with 8.9% in fiscal 1999. The
operating profit when comparing fiscal 1999 to fiscal 1998.
largest portion of the increase in International sales is the result of
the acquisition of the ASDA Group PLC (ASDA), which consisted of
In February 2000, Cifra officially changed its name to Wal-Mart de
229 stores and was completed during the third quarter of fiscal
México, S.A. de C.V.
2000. Additionally, fiscal 2000 was the first full year containing the
operating results of the 74 units of the German Interspar
In March 2000, the Company announced the sale of all three of the
hypermarket chain, which were acquired in the fourth quarter of
Company’s SAM’S Clubs in Argentina. The sale is being made so
fiscal 1999. Expansion in the international segment for fiscal 2000
that the Company can concentrate on expanding its Supercenter
consisted of the opening or acquisition of 288 units.
business within Argentina.
International sales accounted for approximately 8.9% of total
Interest Costs
Company sales in fiscal 1999 compared with 6.4% in fiscal 1998. The
growth in International is partially due to acquisitions during 1999
Debt interest costs increased .08% as a percentage of sales from .38%
and 1998. Expansion in the international segment for fiscal 1999
in fiscal 1999 to .46% in fiscal 2000. This increase is the result of
consisted of the opening or acquisition of 114 units. In the third
increased fiscal 2000 borrowings incurred as the result of the ASDA
quarter of fiscal 1998, the Company acquired a controlling interest
acquisition. Interest cost related to capital leases decreased by .03%
of Cifra, S.A de C.V. (Cifra), which at acquisition date included 250
as a percentage of sales from .19% in fiscal 1999 to .16% in fiscal 2000.
units in varying formats including Aurreras, Bodegas, Suburbias,
Superamas, and Vips. In the fourth quarter of fiscal 1998, the
Interest costs decreased .09% as a percentage of sales in fiscal
Company acquired the 21 units of the Wertkauf hypermarket chain
1999 when compared with fiscal 1998. The Company met cash
in Germany. In fiscal 1999, the Company acquired four units in
requirements without short-term borrowings throughout most of
South Korea which were previously operated by Korea Makro. See
fiscal 1999 due to enhanced operating cash flows. The interest on
Note 6 of Notes to Consolidated Financial Statements for additional
the Company’s capital leases increased over fiscal 1998 due to
information on acquisitions.
continuing expansion. See Note 3 of the Notes to Consolidated
Financial Statements for additional information on interest and debt.
The Company’s foreign operations are comprised of wholly-owned
operations in Argentina, Canada, Germany, Korea, Puerto Rico and
Liquidity and Capital Resources
the United Kingdom; joint ventures in China; and majority-owned
Cash Flows Information
subsidiaries in Brazil and Mexico. As a result, the Company’s
financial results could be affected by factors such as changes in
foreign currency exchange rates or weak economic conditions in Cash flows from operating activities were $8,194 million in fiscal
the foreign markets in which the Company does business. The 2000, up from $7,580 million in fiscal 1999. In fiscal 2000, the
Company minimizes exposure to the risk of devaluation of foreign Company invested $6,183 million in capital assets, paid dividends of
currencies by operating in local currencies and through buying $890 million, and had a net cash outlay of $10.4 billion primarily for
forward contracts, where feasible, for most known transactions. acquisition of ASDA Group PLC, the third largest retailer in the
United Kingdom. The ASDA cash outlay was financed with the
Prior to fiscal 2000, Mexico’s economy was considered highly- issuance of long-term debt and commercial paper. See Note 6 of
inflationary. Accordingly, the results of the operations of the Notes to Consolidated Financial Statements for additional
Company’s Mexican subsidiary were reported using United States information on acquisitions.
dollars. Beginning in fiscal 2000, Mexico ceased to be considered a
highly-inflationary economy and began reporting its operations in Market Risk
its local currency. The impact on the consolidated or international
segment results of operations or financial position as a result of the Market risks relating to the Company’s operations result
change was not material. In fiscal 2000, the foreign currency primarily from changes in interest rates and changes in foreign
translation adjustment decreased by $54 million to $455 million exchange rates.
primarily due to the United States dollar weakening against the
British pound and the Canadian dollar. This was partially offset by The Company enters into interest rate and cross currency swaps
the United States dollar strengthening against the Brazilian real. In to minimize the risk and costs associated with financing activities
fiscal 1999, the foreign currency translation adjustment increased by and to hedge its net investment in certain foreign subsidiaries.
$36 million to $509 million, primarily due to the exchange rates in The swap agreements are contracts to exchange fixed or variable
Brazil and Canada. rates for variable or fixed interest rate payments periodically
over the life of the instruments. The following tables provide
After consideration of the effects of the change of accounting information about the Company’s derivative financial instruments
method for SAM’S membership revenues, the international and other financial instruments that are sensitive to changes in
segment’s operating profit increased from $549 million in fiscal 1999 interest rates. For debt obligations, the table presents principal
to $817 million in fiscal 2000. The largest portion of the increase in cash flows and related weighted-average interest rates by expected
international operating profit is the result of the ASDA acquisition maturity dates. For interest rate and cross currency swaps, the
which was completed during the third quarter of fiscal 2000. table presents notional amounts and interest rates by contractual
Additionally, the Company’s operations in Canada, Mexico and maturity dates. The applicable floating rate index is included for
Puerto Rico had operating profit increases in fiscal 2000. variable rate instruments. All amounts are stated in United States
dollar equivalents.
After consideration of the effects of the change of accounting
method, the international segment’s operating profit increased from
21
5. Interest Rate Sensitivity As of January 31, 2000
Principal (Notional) Amount by Expected Maturity
Average Interest (Swap) Rate
Fair value
(Amounts in millions) 2001 2002 2003 2004 2005 Thereafter Total 1/31/00
Liabilities
Long-term debt including current portion
Fixed rate debt $ 1,964 $ 2,070 $ 659 $ 742 $ 1,854 $ 8,347 $ 15,636 $ 14,992
Average interest rate – USD rate 6.9% 6.8% 6.8% 6.8% 6.8% 6.9% 6.9%
Interest Rate Derivative Financial Instruments
Related to Debt
Interest rate swap
Pay variable/receive fixed 500 – – – – – 500 (1)
Average rate paid – 30-day U.S. commercial
paper non-financial plus .245%
Fixed rate received – USD rate 5.9% – – – – – 5.9%
Interest rate swap
Pay variable/receive fixed 500 – – – – – 500 –
Average rate paid – 30-day U.S. commercial
paper non-financial plus .134%
Fixed rate received – USD rate 5.7% – – – – – 5.7%
Interest rate swap
Pay variable/receive fixed 41 45 49 54 58 266 513 (7)
Average rate paid – 30-day U.S. commercial
paper non-financial
Fixed rate received – USD rate 7.0% 7.0% 7.0% 7.0% 7.0% 7.0% 7.0%
Interest rate swap
Pay variable/receive fixed – – – – – 230 230 (14)
Floating rate paid – 6-month U.S. LIBOR
Fixed rate received – USD rate – – – – – 7.0% 7.0%
Interest rate swap
Pay fixed/receive variable – – – – – 151 151 (11)
Fixed rate paid – USD rate – – – – – 8.1% 8.1%
Floating rate received – 3-month U.S. LIBOR
Interest Rate Derivative Financial Instruments
Related to Currency Swaps
Currency swap – German Deutschemarks
Pay variable/receive variable – – 1,101 – – – 1,101 122
Floating rate paid – 3-month German
Deutschemark LIBOR minus .0676%
Average rate received – 30-day U.S. commercial
paper non-financial
Interest rate swap – German Deutschemarks
Pay fixed/receive variable – – 1,101 – – – 1,101 6
Fixed rate paid – German Deutschemark rate – – 4.5% – – – 4.5%
Floating rate received – 3-month German
Deutschemark LIBOR minus .0676%
Interest rate swap – U. S. Dollars
Pay variable/receive fixed – – 1,101 – – – 1,101 (38)
Average rate paid – 30-day U.S. commercial
paper non-financial
Fixed rate received – USD rate – – 5.8% – – – 5.8%
Currency swap – German Deutschemarks
Pay variable/receive variable – – – 809 – – 809 129
Floating rate paid – 3-month German
Deutschemark LIBOR minus .055%
Average rate received – 30-day U.S. commercial
paper non-financial
Interest rate swap – German Deutschemarks
Pay fixed/receive variable – – – 809 – – 809 40
Fixed rate paid – German Deutschemark rate – – – 3.4% – – 3.4%
Floating rate received – 3-month German
Deutschemark LIBOR minus .055%
Interest rate swap – U.S. Dollars
Pay variable/receive fixed – – – 809 – – 809 (57)
Average rate paid – 30-day U.S. commercial
paper non-financial
Fixed rate received – USD rate – – – 5.2% – – 5.2%
Currency swap – Great Britain Pounds
Pay variable/receive variable – – – – – 3,500 3,500 (29)
Floating rate paid – 6-month Great Britain
Pound LIBOR minus .1203%
Floating rate received – 3-month U.S.
Dollar LIBOR minus .0842%
Interest rate swap – Great Britain Pounds
Pay fixed/receive variable – – – – – 3,500 3,500 83
Fixed rate paid – Great Britain Pound rate – – – – – 6.2% 6.2%
Floating rate received – 3-month Great Britain
Pound LIBOR minus .1203%
Interest rate swap – U.S. Dollars
Pay variable/receive fixed – – – – – 3,500 3,500 (71)
Floating rate paid – 3-month U.S.
Dollar LIBOR minus .0842%
Fixed rate received – USD rate – – – – – 6.9% 6.9%
22
6. Interest Rate Sensitivity As of January 31, 1999
Principal (Notional) Amount by Expected Maturity
Average Interest (Swap) Rate
Fair value
(Amounts in millions) 2000 2001 2002 2003 2004 Thereafter Total 1/31/99
Liabilities
Long-term debt including current portion
Fixed rate debt $ 900 $ 830 $ 801 $ 558 $ 739 $ 3,980 $ 7,808 $ 8,323
Average interest rate – USD rate 7.1% 7.2% 7.1% 6.9% 7.0% 7.2% 7.2%
Long-term obligation related to
real estate investment trust
Fixed rate obligation 39 43 46 50 55 327 560 $ 641
Fixed interest rate – USD rate 8.4% 8.4% 8.4% 8.4% 8.4% 8.4% 8.4%
Interest Rate Derivative Financial Instruments
Related to Debt
Interest rate swap
Pay variable/receive fixed – 500 – – – – 500 10
Average rate paid – 30-day U. S. commercial
paper non-financial plus .134%
Fixed rate received – USD rate – 5.7% – – – – 5.7%
Interest rate swap
Pay variable/receive fixed – 500 – – – – 500 5
Average rate paid – 30-day U.S. commercial
paper non-financial plus .245%
Fixed rate received – USD rate – 5.9% – – – – 5.9%
Interest Rate Derivative Financial Instruments
Related to Real Estate Investment Trust Obligation
Interest rate swap
Pay variable/receive fixed 38 41 45 49 54 324 551 44
Average rate paid – 30-day U.S. commercial
paper non-financial
Fixed rate received – USD rate 7.0% 7.0% 7.0% 7.0% 7.0% 7.0% 7.0%
Interest rate swap
Pay variable/receive fixed – – – – – 230 230 30
Floating rate paid – 6-month U.S. LIBOR
Fixed rate received – USD rate – – – – – 7.0% 7.0%
Interest Rate Derivative Financial Instruments
Related to Currency Swaps
Currency swap – German Deutschemarks
Pay variable/receive variable – – – 1,101 – – 1,101 (43)
Floating rate paid – 3-month German
Deutschemark LIBOR minus .0676%
Average rate received – 30-day U.S. commercial
paper non-financial
Interest rate swap – German Deutschemarks
Pay fixed/receive variable – – – 1,101 – – 1,101 (58)
Fixed rate paid – German Deutschemark rate – – – 4.5% – – 4.5%
Floating rate received – 3-month German
Deutschemark LIBOR minus .0676%
Interest rate swap – U. S. Dollars
Pay variable/receive fixed – – – 1,101 – – 1,101 28
Average rate paid – 30-day U.S. commercial
paper non-financial
Fixed rate received – USD rate – – – 5.8% – – 5.8%
Currency swap – German Deutschemarks
Pay variable/receive variable – – – – 809 – 809 18
Floating rate paid – 3-month German
Deutschemark LIBOR minus .055%
Average rate received – 30-day U.S. commercial
paper non-financial
Interest rate swap – German Deutschemarks
Pay fixed/receive variable – – – – 809 – 809 3
Fixed rate paid – German Deutschemark rate – – – – 3.4% – 3.4%
Floating rate received – 3-month German
Deutschemark LIBOR minus .055%
Interest rate swap – U.S. Dollars
Pay variable/receive fixed – – – – 809 – 809 1
Average rate paid – 30-day U.S. commercial
paper non-financial
Fixed rate received – USD rate – – – – 5.2% – 5.2%
In fiscal 2000, the Company converted the long-term obligation related to a real estate investment trust in which it acquired the equity
interest to long-term debt and, accordingly, has included this debt in the long-term debt section above.
23
7. The Company routinely enters into forward currency exchange The following tables provide information about the Company’s
contracts in the regular course of business to manage its exposure derivative financial instruments, including foreign currency forward
against foreign currency fluctuations on cross-border purchases of exchange agreements and currency swap agreements by functional
inventory. These contracts are generally for durations of six months currency, and presents the information in United States dollar
or less. In addition, the Company entered into a series of foreign equivalents. For foreign currency forward exchange agreements,
currency swaps to hedge the net investment in Germany and the the table presents the notional amounts and weighted average
United Kingdom. exchange rates by contractual maturity dates.
Foreign Currency Exchange Rate Sensitivity As of January 31, 2000
Principal (Notional) Amount by Expected Maturity
Fair value
(Amounts in millions) 2001 2002 2003 2004 2005 Thereafter Total 1/31/2000
Forward Contracts to Sell Canadian
Dollars for Foreign Currencies
United States Dollars
Notional amount $ 91 – – – – – $ 91 (1)
Average contract rate 1.5 – – – – – 1.5
Forward Contracts to Sell British
Pounds for Foreign Currencies
Hong Kong Dollars
Notional amount 70 – – – – – 70 1
Average contract rate 12.8 – – – – – 12.8
United States Dollars
Notional amount 40 – – – – – 40 1
Average contract rate 1.6 – – – – – 1.6
Other Currencies
Notional amount 45 – – – – – 45 (2)
Average contract rate Various – – – – – Various
Currency Swap Agreements
Payment of German Deutschemarks
Notional amount – – 1,101 – – – 1,101 122
Average contract rate – – 1.8 – – – 1.8
Payment of German Deutschemarks
Notional amount – – – 809 – – 809 129
Average contract rate – – – 1.7 – – 1.7
Payment of Great Britain Pounds
Notional amount – – – – – 3,500 3,500 (29)
Average contract rate – – – – – 0.6 0.6
Foreign Currency Exchange Rate Sensitivity As of January 31, 1999
Principal (Notional) Amount by Expected Maturity
Fair value
(Amounts in millions) 2000 2001 2002 2003 2004 Thereafter Total 1/31/1999
Forward Contracts to Sell Canadian
Dollars for Foreign Currencies
United States Dollars
Notional amount $ 45 – – – – – $ 45 (1)
Average contract rate 1.5 – – – – – 1.5
Forward Contracts to Sell German
Deutschemarks for Foreign Currencies
Hong Kong Dollars
Notional amount 1 – – – – – 1 –
Average contract rate 0.2 – – – – – 0.2
United States Dollars
Notional amount 1 – – – – – 1 –
Average contract rate 1.8 – – – – – 1.8
Currency Swap Agreements
Payment of German Deutschemarks
Notional amount – – – 1,101 – – 1,101 (43)
Average contract rate – – – 1.8 – – 1.8
Payment of German Deutschemarks
Notional amount – – – – 809 – 809 18
Average contract rate – – – – 1.7 – 1.7
24
8. Company Stock Purchase and Total planned capital expenditures for fiscal 2001 approximate
$8 billion. We plan to finance our expansion primarily with operating
Common Stock Dividends cash flows.
In fiscal 2000 and 1999, the Company repurchased over 2 million In the fourth quarter of fiscal 2000, the Company joined with
and 21 million shares of its common stock for $101 million and Accel Partners, a venture capital firm, to form Wal-Mart.com, Inc.
$1,202 million, respectively. In the Company’s quarterly report on Wal-Mart.com, Inc. will base its operations in Palo Alto, California
Form 10-Q for the third quarter of fiscal 2000, the Company and was formed to further develop and operate the Internet retail
announced its intent to postpone any further share repurchases site, Wal-Mart.com, and to further the Company’s efforts to attract
until the ratio of debt to total book capitalization was approximately customers to the Internet with the Wal-Mart name.
40%. At January 31, 2000, the Company’s total debt to capitalization
ratio including commercial paper was 46%. Subsequent to year-end,
Year 2000 Issue Update
the Company’s stock price decreased and in February and
March 2000, the Company repurchased 4.1 million shares of its
The Company did not experience any significant malfunctions or
common stock for $193 million.
errors in its operating or business systems when the date changed
from 1999 to 2000. Based on operations since January 1, 2000, the
The Company paid dividends totaling $.20 per share in fiscal 2000.
Company does not expect any significant impact to its ongoing
In March 2000, the Company increased its dividend 20% to $.24 per
business as a result of the “Year 2000 issue.” However, it is possible
share for fiscal 2001. This marks the 28th consecutive yearly
that the full impact of the date change, which was of concern due to
increase in dividends.
computer programs that use two digits instead of four digits to
define years, has not been fully recognized. For example, it is
Borrowing Information possible that Year 2000 or similar issues such as leap year-related
problems may occur with billing, payroll, or financial closings at
The Company had committed lines of credit with 85 firms and month, quarter, or year end. The Company believes that any such
banks, aggregating $4,872 million and informal lines of credit problems are unlikely and that should they occur, they will be minor
with various other banks, totaling an additional $1,500 million, and correctable. In addition, the Company could still be negatively
which were used to support commercial paper. These lines of affected if its suppliers are adversely affected by the Year 2000
credit and their anticipated cyclical increases should be sufficient or similar issues. The Company currently is not aware of any
to finance the seasonal buildups in merchandise inventories and significant Year 2000 or similar problems that have arisen for
other cash requirements. its suppliers.
The Company anticipates generating sufficient operating cash flow The Company expended $28.2 million on Year 2000 readiness
to pay the increased dividend and to fund all capital expenditures. efforts through January 31, 2000. Of this, $18.7 million is related to
Accordingly, management does not plan to finance future capital reprogramming, replacement, extensive testing and validation of
expenditures with debt. However, the Company plans to refinance software, which was expensed as incurred, while $9.5 million
existing long-term debt as it matures and may desire to obtain was related to acquisition of hardware, which is being capitalized.
additional long-term financing for other uses of cash or for strategic $2.2 million of the cost was assumed as a result of the acquisition of
reasons. The Company anticipates no difficulty in obtaining long- ASDA Group PLC.
term financing in view of an excellent credit rating and favorable
experiences in the debt market in the recent past. In addition to the
Forward-Looking Statements
available credit lines mentioned above, and after consideration of
$1 billion in notes issued in February and March of 2000, the
The Private Securities Litigation Reform Act of 1995 provides a safe
Company is permitted to sell up to $3.5 billion of public debt under
harbor for forward-looking statements made by or on behalf of the
shelf registration statements previously filed with the United States
Company. Certain statements contained in Management’s
Securities and Exchange Commission.
Discussion and Analysis, in other parts of this report and in other
Company filings are forward-looking statements. These statements
Expansion discuss, among other things, expected growth, future revenues,
future cash flows and future performance. The forward-looking
Domestically, the Company plans to open approximately 40 new statements are subject to risks and uncertainties including but not
Wal-Mart stores and approximately 165 new Supercenters in fiscal limited to the cost of goods, competitive pressures, inflation,
2000. Relocations or expansions of existing discount stores will consumer debt levels, currency exchange fluctuations, trade
account for 107 of the Supercenters, while approximately 58 will be restrictions, changes in tariff and freight rates, Year 2000 issues,
new locations. Due to the continued positive customer feedback on interest rate fluctuations and other capital market conditions, and
the Neighborhood Market concept, which is being tested in seven other risks indicated in the Company’s filings with the United States
locations, the Company plans to add five to ten new locations. Also Securities and Exchange Commission. Actual results may materially
planned for fiscal 2001 are 19 new SAM’S Clubs, including eight differ from anticipated results described in these statements.
relocations. In addition, the Company will remodel approximately
140 of the existing SAM’S Clubs and expand two units. In order to
serve these and future developments, the Company will begin
shipping from 11 new distribution centers (including one
replacement unit) in the next fiscal year. Internationally, plans are to
develop or relocate 90 to 100 retail units. These units are planned in
Argentina, Brazil, Canada, China, Germany, Korea, Mexico, Puerto
Rico and the United Kingdom. Total planned growth represents
approximately 34.9 million square feet of net additional retail space.
25
9. Consolidated Statements of Income
(Amounts in millions except per share data)
Fiscal years ended January 31, 1999 1998
2000
Revenues:
Net sales $ 137,634 $ 117,958
$ 165,013
Other income-net 1,574 1,341
1,796
139,208 119,299
166,809
Costs and Expenses:
Cost of sales 108,725 93,438
129,664
Operating, selling and general
and administrative expenses 22,363 19,358
27,040
Interest Costs:
Debt 529 555
756
Capital leases 268 229
266
131,885 113,580
157,726
Income Before Income Taxes, Minority Interest,
Equity in Unconsolidated Subsidiaries and
7,323 5,719
Cumulative Effect of Accounting Change 9,083
Provision for Income Taxes
Current 3,380 2,095
3,476
Deferred (640) 20
(138)
2,740 2,115
3,338
Income Before Minority Interest, Equity in
Unconsolidated Subsidiaries and Cumulative
4,583 3,604
Effect of Accounting Change 5,745
(153) (78)
Minority Interest and Equity in Unconsolidated Subsidiaries (170)
4,430 3,526
Income Before Cumulative Effect of Accounting Change 5,575
Cumulative Effect of Accounting Change, net of tax
– –
benefit of $119 (198)
$ 4,430 $ 3,526
Net Income $ 5,377
Net Income Per Common Share:
Basic Net Income Per Common Share:
Income before cumulative effect of accounting change $ 0.99 $ 0.78
$ 1.25
Cumulative effect of accounting change, net of tax – –
(0.04)
$ 0.99 $ 0.78
Net Income Per Common Share $ 1.21
4,464 4,516
Average number of Common Shares 4,451
Diluted Net Income Per Common Share:
Income before cumulative effect of accounting change $ 0.99 $ 0.78
$ 1.25
Cumulative effect of accounting change, net of tax 0.00 0.00
(0.04)
$ 0.99 $ 0.78
Net Income Per Common Share $ 1.20
4,485 4,533
Average number of Common Shares 4,474
Pro forma amounts assuming accounting change had
been in effect in fiscal 2000, 1999 and 1998:
Net Income $ 4,393 $ 3,517
$ 5,575
Net income per common share, basic and diluted $ 0.98 $ 0.78
$ 1.25
See accompanying notes.
26
10. Consolidated Balance Sheets
(Amounts in millions)
January 31, 1999
2000
Assets
Current Assets:
Cash and cash equivalents $ 1,879
$ 1,856
Receivables 1,118
1,341
Inventories
At replacement cost 17,549
20,171
Less LIFO reserve 473
378
Inventories at LIFO cost 17,076
19,793
Prepaid expenses and other 1,059
1,366
21,132
Total Current Assets 24,356
Property, Plant and Equipment, at Cost:
Land 5,219
8,785
Building and improvements 16,061
21,169
Fixtures and equipment 9,296
10,362
Transportation equipment 553
747
31,129
41,063
Less accumulated depreciation 7,455
8,224
Net property, plant and equipment 23,674
32,839
Property Under Capital Lease:
Property under capital lease 3,335
4,285
Less accumulated amortization 1,036
1,155
Net property under capital leases 2,299
3,130
Other Assets and Deferred Charges:
Net goodwill and other acquired intangible assets 2,538
9,392
Other assets and deferred charges 353
632
$ 49,996
Total Assets $ 70,349
Liabilities and Shareholders’ Equity
Current Liabilities:
Commercial paper $ –
$ 3,323
Accounts payable 10,257
13,105
Accrued liabilities 4,998
6,161
Accrued income taxes 501
1,129
Long-term debt due within one year 900
1,964
Obligations under capital leases due within one year 106
121
16,762
Total Current Liabilities 25,803
Long-Term Debt 6,908
13,672
Long-Term Obligations Under Capital Leases 2,699
3,002
Deferred Income Taxes and Other 716
759
Minority Interest 1,799
1,279
Shareholders’ Equity
Preferred stock ($.10 par value; 100 shares authorized, none issued)
Common stock ($.10 par value; 5,500 shares authorized, 4,457
and 4,448 issued and outstanding in 2000 and 1999, respectively) 445
446
Capital in excess of par value 435
714
Retained earnings 20,741
25,129
Other accumulated comprehensive income (509)
(455)
21,112
Total Shareholders’ Equity 25,834
$ 49,996
Total Liabilities and Shareholders’ Equity $ 70,349
See accompanying notes.
27
11. Consolidated Statements of Shareholders’ Equity
Other
Capital in accumulated
Number Common excess of Retained comprehensive
(Amounts in millions except per share data) of shares stock par value earnings income Total
2,285 228 547 16,768 (400) $ 17,143
Balance – January 31, 1997
Comprehensive Income
Net income 3,526 3,526
Other accumulated comprehensive income
Foreign currency translation adjustment (73) (73)
Total Comprehensive Income $ 3,453
Cash dividends ($.14 per share) (611) (611)
Purchase of Company stock (47) (5) (48) (1,516) (1,569)
Stock options exercised and other 3 1 86 87
2,241 224 585 18,167 (473) 18,503
Balance – January 31, 1998
Comprehensive Income
Net income 4,430 4,430
Other accumulated comprehensive income
Foreign currency translation adjustment (36) (36)
Total Comprehensive Income $ 4,394
Cash dividends ($.16 per share) (693) (693)
Purchase of Company stock (21) (2) (37) (1,163) (1,202)
Two-for-one stock split 2,224 223 (223) –
Stock options exercised and other 4 110 110
4,448 445 435 20,741 (509) 21,112
Balance – January 31, 1999
Comprehensive Income
Net income 5,377 5,377
Other accumulated comprehensive income
Foreign currency translation adjustment 54 54
Total Comprehensive Income $ 5,431
Cash dividends ($.20 per share) (890) (890)
Purchase of Company stock (2) (2) (99) (101)
Stock options exercised and other 11 1 281 282
4,457 $ 446 $ 714 $ 25,129 ($455) $ 25,834
Balance – January 31, 2000
See accompanying notes.
28
12. Consolidated Statements of Cash Flows
(Amounts in millions)
Fiscal years ended January 31, 1999 1998
2000
Cash flows from operating activities
Net Income $ 4,430 $ 3,526
$ 5,377
Adjustments to reconcile net income to net cash
provided by operating activities:
Depreciation and amortization 1,872 1,634
2,375
Cumulative effect of accounting change, net of tax – –
198
Increase in accounts receivable (148) (78)
(255)
Increase in inventories (379) (365)
(2,088)
Increase in accounts payable 1,108 1,048
1,849
Increase in accrued liabilities 1,259 1,329
1,015
Deferred income taxes (640) 20
(138)
Other 78 9
(139)
Net cash provided by operating activities 7,580 7,123
8,194
Cash flows from investing activities
Payments for property, plant and equipment (3,734) (2,636)
(6,183)
Investment in international operations (net of cash acquired,
$195 million in Fiscal 2000) (855) (1,865)
(10,419)
Other investing activities 171 80
(244)
Net cash used in investing activities (4,418) (4,421)
(16,846)
Cash flows from financing activities
Increase in commercial paper – –
4,316
Proceeds from issuance of long-term debt 536 547
6,000
Purchase of Company stock (1,202) (1,569)
(101)
Dividends paid (693) (611)
(890)
Payment of long-term debt (1,075) (554)
(863)
Payment of capital lease obligations (101) (94)
(133)
Other financing activities (195) 143
300
Net cash provided by (used in) financing activities (2,730) (2,138)
8,629
Net (decrease)/increase in cash and cash equivalents 432 564
(23)
Cash and cash equivalents at beginning of year 1,447 883
1,879
Cash and cash equivalents at end of year $ 1,879 $ 1,447
$ 1,856
Supplemental disclosure of cash flow information
Income tax paid $ 3,458 $ 1,971
$ 2,780
Interest paid 805 796
849
Capital lease obligations incurred 347 309
378
Investment in unconsolidated subsidiary exchanged
in acquisition – 226
–
Property, plant and equipment acquired with debt – –
65
ASDA acquisition cost satisfied with debt – –
264
ASDA acquisition cost satisfied with Company stock – –
175
See accompanying notes.
29
13. Notes to Consolidated Financial Statements
1 Summary of Significant Accounting Building and improvements 5 – 50 years
Fixtures and equipment 5 – 12 years
Policies Transportation equipment 2 – 5 years
Goodwill and other acquired
Consolidation intangible assets 20 – 40 years
The consolidated financial statements include the accounts of
Internally developed software 3 years
subsidiaries. Significant intercompany transactions have been
eliminated in consolidation.
Costs of computer software
During fiscal 2000, the Company adopted the Accounting Standards
Cash and cash equivalents Executive Committee Statement of Position (SOP) 98-1,
The Company considers investments with a maturity of three
“Accounting For the Costs of Computer Software Developed For or
months or less when purchased to be cash equivalents.
Obtained For Internal Use.” This SOP requires the capitalization of
certain costs incurred in connection with developing or obtaining
Inventories software for internal use. Previously, costs related to developing
The Company uses the retail last in first out (LIFO) method for
internal-use software were expensed as incurred. Under the new
domestic Wal-Mart discount stores and Supercenters and cost LIFO
method these costs are capitalized and amortized over a three year
for SAM’S Clubs. International inventories are on other cost
life. The impact of the adoption of SOP 98-1 was to capitalize $32
methods. Inventories are not in excess of market value.
million of costs in fiscal 2000, which would have previously been
expensed. The impact of the change would not have a material
Pre-opening costs effect on any of the years presented prior to fiscal 2000.
During fiscal 1999, the Company adopted Statement of Position
(SOP) 98-5, “Reporting on the Costs of Start-Up Activities.” The
Accounting for derivative instruments and hedging activities
SOP requires that the costs of start-up activities, including
In June 1998, the Financial Accounting Standards Board (FASB)
organization costs, be expensed as incurred. The impact of the
issued Statement No. 133, “Accounting for Derivative Instruments
adoption of SOP 98-5 on fiscal 1999 was $8 million net of taxes. Due
and Hedging Activities.” The new Statement requires all derivatives
to the immateriality to the Company’s results of operations, the
to be recorded on the balance sheet at fair value and establishes
initial application was not reported as a cumulative effect of a
accounting treatment for three types of hedges: hedges of changes
change in an accounting principle. The impact of the change did not
in the fair value of assets, liabilities, or firm commitments; hedges of
have a material effect on any of the years presented.
the variable cash flows of forecasted transactions; and hedges of
foreign currency exposures of net investments in foreign
Interest during construction operations. In July 1999, the FASB issued Statement No. 137
In order that interest costs properly reflect only that portion relating
“Accounting for Derivative Instruments and Hedging Activities –
to current operations, interest on borrowed funds during the
Deferral of the effective Date of FASB Statement No. 133”, which
construction of property, plant and equipment is capitalized. Interest
postponed the effective date of Statement No. 133 for one year.
costs capitalized were $57 million, $41 million, and $33 million in
Statement 133 will now be effective for the Company beginning
2000, 1999 and 1998, respectively.
February 1, 2001. The Company currently does not anticipate there
will be a material impact on the results of operations or financial
Financial Instruments position upon adoption of Statement No. 133.
The Company uses derivative financial instruments for purposes
other than trading to reduce its exposure to fluctuations in foreign
Goodwill and other acquired intangible assets
currencies and to minimize the risk and cost associated with
Goodwill and other acquired intangible assets are amortized on a
financial and global operating activities. Contracts that effectively
straight-line basis over the periods that expected economic benefits
meet risk reduction and correlation criteria are recorded using
will be provided. Management estimates such periods of economic
hedge accounting. Unrealized gains and losses resulting from
benefits using factors such as entry barriers in certain countries,
market movements are not recognized. Hedges of firm
operating rights and estimated lives of other operating assets
commitments are deferred and recognized when the hedged
acquired. The realizability of goodwill and other intangibles is
transaction occurs.
evaluated periodically when events or circumstances indicate a
possible inability to recover the carrying amount. Such evaluation
Advertising costs is based on cash flow and profitability projections that incorporate
Advertising costs are expensed as incurred and were $523 million,
the impact of existing Company businesses. The analyses
$405 million and $292 million in 2000, 1999 and 1998, respectively.
necessarily involve significant management judgment to evaluate
the capacity of an acquired business to perform within projections.
Operating, selling and general and administrative expenses Historically, the Company has generated sufficient returns from
Buying, warehousing and occupancy costs are included in
acquired businesses to recover the cost of the goodwill and other
operating, selling and general and administrative expenses.
intangible assets.
Depreciation and amortization Long-lived assets
Depreciation and amortization for financial statement purposes is
The Company periodically reviews long-lived assets and
provided on the straight-line method over the estimated useful lives
certain intangible assets when indicators of impairments exist
of the various assets. Depreciation expense for the years 2000, 1999
and if the value of the assets is impaired, an impairment loss
and 1998 was $1,998 million, $1,648 million and $1,426 million,
would be recognized.
respectively. For income tax purposes, accelerated methods are
used with recognition of deferred income taxes for the resulting
temporary differences. Estimated useful lives are as follows:
30