Top Rated Pune Call Girls JM road ⟟ 6297143586 ⟟ Call Me For Genuine Sex Ser...
FoodDrinkEurope
1. 1/9
Economic Bulletin
Q4 2014
At A Glance – Summary of Q4 2014 highlights
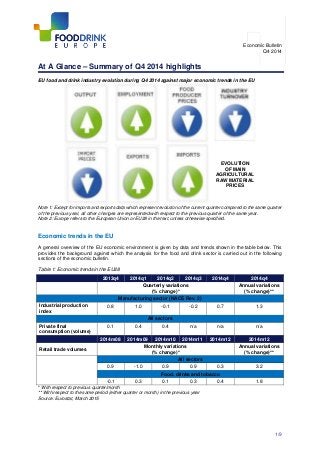
EU food and drink industry evolution during Q4 2014 against major economic trends in the EU
EVOLUTION
OF MAIN
AGRICULTURAL
RAW MATERIAL
PRICES
Note 1: Except for imports and exports data which represent evolution of the current quarter compared to the same quarter
of the previous year, all other changes are represented with respect to the previous quarter of the same year.
Note 2: Europe refers to the European Union or EU28 in the text, unless otherwise specified.
Economic trends in the EU
A general overview of the EU economic environment is given by data and trends shown in the table below. This
provides the background against which the analysis for the food and drink sector is carried out in the following
sections of the economic bulletin.
Table 1: Economic trends in the EU28
* With respect to previous quarter/month
** With respect to the same period (either quarter or month) in the previous year
Source: Eurostat, March 2015
2013q4 2014q1 2014q2 2014q3 2014q4 2014q4
Quarterly variations
(% change)*
Annual variations
(% change)**
Manufacturing sector (NACE Rev. 2)
Industrial production
index
0.8 1.0 -0.1 -0.2 0.7 1.3
All sectors
Private final
consumption (volume)
0.1 0.4 0.4 n/a n/a n/a
2014m08 2014m09 2014m10 2014m11 2014m12 2014m12
Retail trade volumes
Monthly variations
(% change)*
Annual variations
(% change)**
All sectors
0.9 -1.0 0.9 0.9 0.3 3.2
Food, drinks and tobacco
-0.1 0.3 0.1 0.3 0.4 1.8
2. 2/9
The EU manufacturing industrial production index increased by 0.7% in Q4 of 2014. The yearly comparison
shows that the industrial production index increased in Q4 of 2014 compared to the same quarter of the previous
year, i.e. by 1.3%.
The monthly comparison shows that between December and November 2014, the seasonally adjusted volume of
retail trade rose by 0.3% in both the euro area and the EU28. The volume of retail trade in food, drinks and tobacco
increased by 0.4% during the same period. The highest increases in total retail trade were registered in Ireland
(+1.8%), Austria (+1.6%), Spain and Slovakia (both +1.1%), and the largest decreases in Portugal (-3.8%), Estonia
(-1.7%), Denmark and Slovenia (both -1.5%).The annual comparison shows that in December 2014, compared with
December 2013, the volume of retail trade increased by 3.2% and the volume of retail trade in food, drinks and
tobacco increased by 1.8%.1
FOOD AND DRINK INDUSTRY INDICATORS IN Q4 OF 2014
1. Food and drink industry production index
Food and drink industry production in the EU increased in Q4 of 2014 (+0.43%). In most EU Member States
production in Q4 of 2014 was higher compared to the previous quarter (i.e. Austria, Belgium, Bulgaria, Czech
Republic, Estonia, France, Germany, Greece, Hungary, Ireland, Italy, Lithuania, Netherlands, Poland, Romania and
United Kingdom). Lower output was registered for a limited number of Member States (Denmark, Finland, Hungary,
Latvia, Portugal, Spain and Sweden).
Table 2: Industry production index, quarterly growth
Member State
2014 Q3/2014 Q2
(% change)
2014 Q4/2014 Q3
(% change)
EU28 -0.24 0.43
Austria 1.25 3.47
Belgium -2.01 0.26
Bulgaria -0.55 1.03
Czech Republic -2.04 4.83
Denmark -0.64 -0.78
Estonia -1.32 3.66
Finland -0.40 -2.93
France -0.36 0.31
Germany -1.69 1.48
Greece -2.47 3.91
Hungary -2.87 -0.05
Ireland 1.43 2.62
Italy -1.75 0.77
Latvia -0.85 -0.69
Lithuania -3.56 5.28
Netherlands -7.60 6.06
Poland -2.32 1.28
Portugal 13.50 -13.39
Romania -5.71 2.60
Spain -0.07 -1.08
Sweden -1.65 -0.07
United Kingdom 1.63 0.57
Source: Eurostat, Short-Term Business Statistics, NACE Rev. 2, March 2015
Data not available for Croatia, Cyprus, Luxembourg, Malta, Slovakia, Slovenia.
1
Eurostat news release, Euro indicators, 23/2015.
3. 3/9
2. Evolution of main agricultural raw material prices
Lower prices were recorded for the majority of agricultural raw materials in Q4 of 2014, except for coffee and soft
wheat.
Oils and oil crops
Grains Dairy Soybean Rape
Cocoa Coffee Sugar Corn/
Maize
Soft
wheat
WMP SMP Oil Bean Meal Seed Oil Palm
oil
Source: FoodDrinkEurope compilation
Cocoa and coffee
Quarterly developments:
The quarterly average price for
cocoa decreased by 7.4% in
Q4 of 2014. The coffee
composite price increased by
1.7% in Q4 of 2014 compared
to the previous quarter.
Year-on-year developments:
The year-on-year comparison
shows that, the New York
cocoa market recorded a 7.9%
increase with respect to Q4 of
2013. Coffee composite prices
were 54.4% above their level in
Q4 of 2013.
Source: International Cocoa Organisation (ICCO) and International Coffee Organisation
(ICO), December 2014
Sugar
Quarterly developments: EU
white sugar prices decreased
by 15.2% in Q4 of 2014. In the
same quarter, U.S. market
prices increased by 4.9%
compared to Q3 of 2014.
Year-on-year developments:
On average, the EU market
price for white sugar was
31.1% lower in Q4 of 2014
compared to the same quarter
of the previous year. The U.S.
market price was 42.6% above
the average price in Q4 of
2013. In comparison, the world
sugar price was 5.2% lower
than in Q4 of 2013.
Source: European Commission – Circa (Regulations (EC) No 562/2005 Article 6(1) and
479/2010 Article 2), United States Department of Agriculture, December 2014
0
1000
2000
3000
4000
5000
6000
Jan'07
Apr
Jul
Oct
Jan'08
Apr
Jul
Oct
Jan'09
Apr
Jul
Oct
Jan'10
Apr
Jul
Oct
Jan'11
Apr
Jul
Oct
Jan'12
Apr
Jul
Oct
Jan'13
Apr
Jul
Oct
Jan'14
Apr
Jul
Oct
Cocoa NY market price and coffee world price
(monthly averages, current price, $/t)
Cocoa price in $/t Coffee composite price in $/t
0
200
400
600
800
1000
1200
Jan'07
Apr
Jul
Oct
Jan'08
Apr
Jul
Oct
Jan'09
Apr
Jul
Oct
Jan'10
Apr
Jul
Oct
Jan'11
Apr
July
Oct
Jan'12
Apr
Jul
Oct
Jan'13
Apr
July
Oct
Jan'14
Apr
Jul
Oct
White Sugar prices
(monthly averages, current prices, €/t)
World price US market price
EU reference price EU average price
4. 4/9
Grains
Corn/maize prices
Quarterly developments:
EU maize prices decreased by
4.0% in Q4 of 2014. U.S.
maize prices increased by
5.6% during the same period.
Year-on-year developments:
On average, EU maize prices
were 1.9% lower in Q4 of 2014
than the same quarter of the
previous year. U.S. maize
prices were 5.9% lower in Q4
of 2014 compared to Q4 of
2013.
Source: FAO and European Commission (DG Agri), December 2014
Soft wheat prices
Quarterly developments: EU
soft wheat prices increased by
0.4% in Q4 of 2014 compared
to the previous quarter. U.S.
soft wheat prices were 18.9%
higher than in Q3 of 2014.
Year-on-year developments:
On average, EU soft wheat
prices were 9.8% lower in Q4
of 2014 than in the same
quarter of the previous year.
U.S. soft wheat prices were
7.1% lower in Q4 of 2014 year-
on-year.
Source: FAO and European Commission (DG Agri), December 2014
0.00
50.00
100.00
150.00
200.00
250.00
300.00
Jan'07
Apr
Jul
Oct
Jan'08
Apr
Jul
Oct
Jan'09
Apr
Jul
Oct
Jan'10
Apr
Jul
Oct
Jan'11
Apr
Jul
Oct
Jan'12
Apr
Jul
Oct
Jan'13
Apr
Jul
Oct
Jan'14
Apr
Jul
Oct
Corn/maize market prices
(monthly averages, current prices, €/t)
EU market price €/t US market price €/t
0.00
50.00
100.00
150.00
200.00
250.00
300.00
Jan'07
Apr
Jul
Oct
Jan'08
Apr
Jul
Oct
Jan'09
Apr
Jul
Oct
Jan'10
Apr
Jul
Oct
Jan'11
Apr
Jul
Oct
Jan'12
Apr
Jul
Oct
Jan'13
Apr
Jul
Oct
Jan'14
Apr
Jul
Oct
Soft wheat market prices
(monthly averages, current prices, €/t)
EU market price €/t US market price €/t
5. 5/9
Dairy
Skimmed Milk Powder (SMP)
Quarterly developments: EU
SMP prices were 21.6% lower
in Q4 of 2014 compared to Q3
of 2014. At the same time the
average quarterly EU SMP
price slightly exceeded world
market prices in Q4 of 2014.
Year-on-year developments:
The yearly comparison shows
that, on average, EU SMP
prices were 37.2% lower in Q4
of 2014 than the same period
in 2013. In Q4 2014, the
average quarterly world market
price for SMP was 40.2% lower
than in Q4 2013.
Source: FAO, CLAL consultancy (discontinued after January 2011 to the benefit of the
European Commission source), European Commission – Circa (Regulations (EC) No
562/2005 Article 6(1) and 479/2010 Article 2), December 2014
Whole Milk Powder (WMP)
Quarterly developments:
EU WMP prices exceeded
world market prices for the
fourth consecutive quarter. EU
WMP prices decreased by
16.5% in Q4 of 2014 compared
to the previous quarter.
Year-on-year developments:
The yearly comparison shows
that EU WMP prices
decreased by 35.8% in Q4 of
2014 compared to Q4 of 2013.
Source: FAO, CLAL consultancy (discontinued after January 2011 to the benefit of the
European Commission source), European Commission – Circa (Regulations (EC) No
562/2005 Article 6(1) and 479/2010 Article 2), December 2014
0
500
1000
1500
2000
2500
3000
3500
4000
4500
Jan'05
Apr
Jul
Oct
Jan'06
Apr
Jul
Oct
Jan'07
Apr
Jul
Oct
Jan'08
Apr
Jul
Oct
Jan'09
Apr
Jul
Oct
Jan'10
Apr
Jul
Oct
Jan'11
Apr
Jul
Oct
Jan'12
Apr
Jul
Oct
Jan'13
Apr
Jul
Oct
Jan
Apr
Jul
Oct
SMP
(monthly averages, current prices, €/t)
World market price EU market price
EU market price EU reference price
0
500
1000
1500
2000
2500
3000
3500
4000
4500
Jan'08
Apr
Jul
Oct
Jan'09
Apr
Jul
Oct
Jan'10
Apr
Jul
Oct
Jan'11
Apr
Jul
Oct
Jan'12
Apr
Jul
Oct
Jan'13
Apr
Jul
Oct
Jan'14
Apr
Jul
Oct
WMP
(monthly averages, current prices, €/t)
World market price EU market price EU market price
6. 6/9
Oils and oil crops
Quarterly developments:
Prices of all major oil crops
decreased in Q4 of 2014. Palm
oil (-7.3%), soybean meal (-
4.5%), soybean oil (-4.3%),
soybeans (-3.9%) rapeseed (-
3.1%), rape oil (-1.9%).
Year-on-year developments:
The yearly comparison shows
a similar trend: Soybeans (-
20.8%), palm oil (-20.3%),
rapeseed (-19.4%), rape oil (-
17.7%), soybean meal (-
16.9%), soybean oil (-16.4%).
Source: World Bank and FAO, December 2014
3. Price developments in the food supply chain
Producer prices decreased by 1.5% in Q4 of 2014, whereas both consumer prices and overall inflation grew slighlty
(+0.1%) in Q4 of 2014 compared to the previous quarter.
Source: Eurostat (Food supply chain monitor), March 2015
0
200
400
600
800
1000
1200
1400
1600
1800
Jan'07
Apr
Jul
Oct
Jan'08
Apr
Jul
Oct
Jan'09
Apr
Jul
Oct
Jan'10
Apr
Jul
Oct
Jan'11
Apr
Jul
Oct
Jan'12
Apr
Jul
Oct
Jan'13
Apr
Jul
Oct
Jan'14
Apr
Jul
Oct
Oils and oilcrop prices
(monthly averages, current prices, $/t)
Soybean oil $/t Soybeans $/t
Soybean meal $/t Palm oil $/t
Rape oil $/t Rapeseed $/t
85.0
90.0
95.0
100.0
105.0
110.0
115.0
120.0
125.0
130.0
2008M01
2008M03
2008M05
2008M07
2008M09
2008M11
2009M01
2009M03
2009M05
2009M07
2009M09
2009M11
2010M01
2010M03
2010M05
2010M07
2010M09
2010M11
2011M01
2011M03
2011M05
2011M07
2011M09
2011M11
2012M01
2012M03
2012M05
2012M07
2012M09
2012M11
2013M01
2013M03
2013M05
2013M07
2013M09
2013M11
2014M01
2014M03
2014M05
2014M07
2014M09
2014M11
Agricultural Commodity Price Index (2010=100) Producer Price Index (2010=100)
Consumer Price Index (2010=100) *Overall inflation index, All-items HICP (2005=100)
EU27: Price developments in the food supply chain
7. 7/9
4. Slight increase in the employment index of the EU food and drink industry
The labour input index for the food and drink industry registered a very moderate increase in Q4 of 2014 (+0.1%),
which was half the average quarterly growth rate recorded for the total manufacturing sector (+0.2%).
Source: Eurostat (SBS), Nace Rev. 2, seasonally adjusted data, March 2015.
5. Lower food and drink industry turnover in Q4 of 2014
The EU food and drink industry turnover decreased for the second consecutive quarter. It was 0.6% lower in Q4 of
2014 compared to the previous quarter.
Source: Eurostat (SBS), seasonally adjusted data, March 2015
80
85
90
95
100
105
110
2010Q1
2010Q2
2010Q3
2010Q4
2011Q1
2011Q2
2011Q3
2011Q4
2012Q1
2012Q2
2012Q3
2012Q4
2013Q1
2013Q2
2013Q3
2013Q4
2014Q1
2014Q2
2014Q3
2014Q4
Labour input index (2010=100) : food and drink industry trends compared to total
manufacturing
Manufacturing Manufacture of food products Manufacture of beverages
90.00
95.00
100.00
105.00
110.00
115.00
120.00
2007Q1
2007Q2
2007Q3
2007Q4
2008Q1
2008Q2
2008Q3
2008Q4
2009Q1
2009Q2
2009Q3
2009Q4
2010Q1
2010Q2
2010Q3
2010Q4
2011Q1
2011Q2
2011Q3
2011Q4
2012Q1
2012Q2
2012Q3
2012Q4
2013Q1
2013Q2
2013Q3
2013Q4
2014Q1
2014Q2
2014Q3
2014Q4
EU28: Turnover index (2010 = 100)
Manufacture of food products and beverages
8. 8/9
6. Prices of imported food and drinks lower in Q4 of 2014
Prices of imported foods decreased further in Q4 of 2014 (-1.0%) compared to the previous quarter.
Source: Eurostat (SBS), March 2015
Exchange rates
Table 3: Evolution of quarterly average exchange rates
1 EUR = 2014 Q3 2014 Q4
2014 Q4 / 2014 Q3
% change
Australian Dollar 1.43 1.46 1.88
Canadian Dollar 1.44 1.42 -1.61
Brazilian Real 3.01 3.18 5.38
Swiss Franc 1.21 1.20 -0.58
Chinese Yuan Renminbi 8.17 7.68 -6.01
Japanese Yen 137.75 142.75 3.63
New Zealand Dollar 1.57 1.60 1.51
United States Dollar 1.33 1.25 -5.72
Pound Sterling 0.79 0.79 -0.59
Source: Eurostat, bilateral exchange rates, March 2015
80.00
85.00
90.00
95.00
100.00
105.00
110.00
115.00
120.00
2007Q1
2007Q2
2007Q3
2007Q4
2008Q1
2008Q2
2008Q3
2008Q4
2009Q1
2009Q2
2009Q3
2009Q4
2010Q1
2010Q2
2010Q3
2010Q4
2011Q1
2011Q2
2011Q3
2011Q4
2012Q1
2012Q2
2012Q3
2012Q4
2013Q1
2013Q2
2013Q3
2013Q4
2014Q1
2014Q2
2014Q3
2014Q4
Euro area
Food and drink import price index (2010 = 100)
9. 9/9
7. Trade: Imports and exports increased in Q4 of 2014 year-on-year
The EU28 positive trade balance in food and drink products increased in Q4 of 2014 compared to the same period
of 2013 (+8.4%). The quarterly EU trade surplus reached €7.1 billion which marks an increase more than €0.5 billion
year-on-year.
EU28 trade balance, in € million
Q4
2013 2014
Total of food and drink 6.589 7.142
Meat products 1.175 1.283
Fish and sea food products -3.172 -3.525
Processed fruit and vegetables -935 -761
Oils and fats -3.173 -3.078
Dairy products 2.442 2.287
Grain mill and starch products 326 423
Bakery & farinaceous products 864 910
Other food products 2.756 3.098
Prepared animal feed 560 619
Drinks 5.547 5.715
FoodDrinkEurope represents Europe’s food and drink industry, Europe’s largest manufacturing sector in terms of turnover,
employment and value added. FoodDrinkEurope works with European and international institutions, in order to contribute
to the development of a legislative and economic framework addressing the competitiveness of industry, food quality and
safety, consumer protection and respect for the environment. FoodDrinkEurope's membership consists of 25 national
federations, including 2 observers, 25 European sector associations and 18 major food and drink companies. For more
information on FoodDrinkEurope and its activities, please visit: www.fooddrinkeurope.eu.
For further information, please contact:
FoodDrinkEurope, +32 2 514 11 11, Economic Affairs Department, l.hinzen@fooddrinkeurope.eu
Imports Q4 of 2014 Exports Q4 of 2014
Total food and drink imports amounted to
€17.8 billion, i.e. 3.6% higher compared to the
previous year. A real reduction of imports in terms of
quantity and value was only observed for fruit and
vegetable products.
Total food and drink exports amounted to
€25 billion, i.e. 4.9% higher compared to the same
period of 2013. EU export volume was up by 8.5% in
Q4 of 2014. Positive year-on-year export growth rates
in terms of value were registered for grain mill and
starch products (+14.9%), prepared animal feed
(+11.7%), oils and fats (+9.1%), fruit and vegetables
(+7.6%), bakery and farinaceous products (+5.8%),
fish products (+5.1%), meat products (+5.0%), spirits
(+3.5%), beer (+3.2%), wine (+3.0%), soft drinks
(+2.4%).