Weitere ähnliche Inhalte
Ähnlich wie Chapter 10generac flujo caja
Ähnlich wie Chapter 10generac flujo caja (20)
Mehr von federicoblanco (14)
Chapter 10generac flujo caja
- 1. Chapter 10 Developing Project Cash Flows
Generating Net Cash Flows
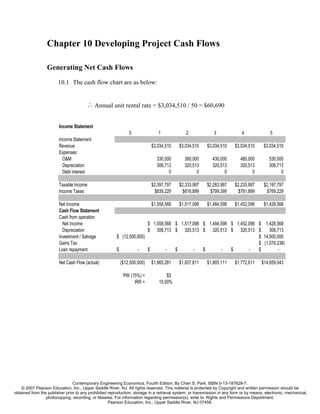
10.1 The cash flow chart are as below:
∴ Annual unit rental rate = $3,034,510 / 50 = $60,690
Income Statement
0 1 2 3 4 5
Income Statement
Revenue $3,034,510 $3,034,510 $3,034,510 $3,034,510 $3,034,510
Expenses:
O&M 330,000 380,000 430,000 480,000 530,000
Depreciation 306,713 320,513 320,513 320,513 306,713
Debt interest 0 0 0 0 0
Taxable Income $2,397,797 $2,333,997 $2,283,997 $2,233,997 $2,197,797
Income Taxes $839,229 $816,899 $799,399 $781,899 $769,229
Net Income $1,558,568 $1,517,098 $1,484,598 $1,452,098 $1,428,568
Cash Flow Statement
Cash from operation
Net Income $ 1,558,568 $ 1,517,098 $ 1,484,598 $ 1,452,098 $ 1,428,568
Depreciation $ 306,713 $ 320,513 $ 320,513 $ 320,513 $ 306,713
Investment / Salvage $ (12,500,000) $ 14,000,000
Gains Tax $ (1,076,238)
Loan repayment $ - $ - $ - $ - $ - $ -
Net Cash Flow (actual) ($12,500,000) $1,865,281 $1,837,611 $1,805,111 $1,772,611 $14,659,043
PW (15%) = $3
IRR = 15.00%
Contemporary Engineering Economics, Fourth Edition, By Chan S. Park. ISBN 0-13-187628-7.
© 2007 Pearson Education, Inc., Upper Saddle River, NJ. All rights reserved. This material is protected by Copyright and written permission should be
obtained from the publisher prior to any prohibited reproduction, storage in a retrieval system, or transmission in any form or by means, electronic, mechanical,
photocopying, recording, or likewise. For information regarding permission(s), write to: Rights and Permissions Department,
Pearson Education, Inc., Upper Saddle River, NJ 07458.
- 2. 2
10.2 Investment in industrial robot:
0 1 2 3 4 5 6 7
Income Statement
Revenues (savings) $120,000 $120,000 $120,000 $120,000 $120,000 $120,000 $120,000
Expenses:
Depreciation $37,000 $59,200 $35,520 $21,312 $21,312 $10,656
Taxable Income $83,000 $60,800 $84,480 $98,688 $98,688 $109,344 $120,000
Income Taxes(35%) $29,050 $21,280 $29,568 $34,541 $34,541 $38,270 $42,000
Net Income $53,950 $39,520 $54,912 $64,147 $64,147 $71,074 $78,000
Cash Flow Statement
Operating Activities:
Net Income $53,950 $39,520 $54,912 $64,147 $64,147 $71,074 $78,000
Depreciation $37,000 $59,200 $35,520 $21,312 $21,312 $10,656 $0
Investment Activities:
Investment ($185,000)
Salvage $40,000
Gains Tax ($14,000)
Net Cash Flow ($185,000) $90,950 $98,720 $90,432 $85,459 $85,459 $81,730 $104,000
10.3 Cash flow diagram
0 1 2 3 4 5 6
Income Statement
Revenues (savings) $25,000 $25,000 $25,000 $25,000 $25,000 $25,000
Expenses:
O&M $7,000 $7,000 $7,000 $7,000 $7,000 $7,000
Depreciation 11000 17600 10560 6336 6336 3168
Taxable Income $7,000 $400 $7,440 $11,664 $11,664 $14,832
Income Taxes(40%) 2,800 160 2,976 4,666 4,666 5,933
Net Income $4,200 $240 $4,464 $6,998 $6,998 $8,899
Cash Flow Statement
Operating Activities:
Net Income $4,200 $240 $4,464 $6,998 $6,998 $8,899
Depreciation $11,000 $17,600 $10,560 $6,336 $6,336 $3,168
Investment Activities:
Investment ($55,000)
Salvage
Gains Tax
Net Cash Flow ($55,000) $15,200 $17,840 $15,024 $13,334 $13,334 $12,067
PW(15%) $1,056
∴ Since the PW of the project is positive, buy the machine.
Contemporary Engineering Economics, Fourth Edition, By Chan S. Park. ISBN 0-13-187628-7.
© 2007 Pearson Education, Inc., Upper Saddle River, NJ. All rights reserved. This material is protected by Copyright and written permission should be
obtained from the publisher prior to any prohibited reproduction, storage in a retrieval system, or transmission in any form or by means, electronic, mechanical,
photocopying, recording, or likewise. For information regarding permission(s), write to: Rights and Permissions Department,
Pearson Education, Inc., Upper Saddle River, NJ 07458.
- 3. 3
10.4 Investment in an answering device:
• Depreciation: It is assured that the building will be placed in service in
January during the first project year. Then, it will be depreciated based on 39-
year MACRS.
• Gains and losses:
Property Cost Salvage Book Gains Gains
(asset) base value value (losses) taxes
Land $100,000 $115,000 $100,000 $115,000 $6,000
Building $500,000 $575,000 $436,965 $138,035 $55,214
Equipment $500,000 $50,000 $133,873 ($83,873) ($33,549)
• Project cash flows
0 1 2 3 4 5
Income Statement
Revenues (savings) $2,500,000 $2,500,000 $2,500,000 $2,500,000 $2,500,000
Expenses:
O&M costs 1,280,000 1,280,000 1,280,000 1,280,000 1,280,000
Depreciation :
Building 12,287 12,821 12,821 12,821 12,821
Equipment 71,450 122,450 87,450 62,450 22,325
Taxable Income 1,136,264 1,084,730 1,119,730 1,144,730 1,184,855
Income Taxes 454,505 433,892 447,892 457,892 473,942
Net Income $681,758 $650,838 $671,838 $686,838 $710,913
Cash Flow Statement
Operating Activities:
Net Income $681,758 $650,838 $671,838 $686,838 $710,913
Depreciation $83,737 $135,271 $100,271 $75,271 $35,146
Investment Activities:
Land ($100,000) 115000
Building ($500,000) 575000
Machines ($500,000) 50000
Gains Tax
Land ($6,000)
Building ($55,214)
Equipment $33,549
Net Cash Flow ($1,100,000) $765,495 $786,108 $772,108 $762,108 $1,458,393
Contemporary Engineering Economics, Fourth Edition, By Chan S. Park. ISBN 0-13-187628-7.
© 2007 Pearson Education, Inc., Upper Saddle River, NJ. All rights reserved. This material is protected by Copyright and written permission should be
obtained from the publisher prior to any prohibited reproduction, storage in a retrieval system, or transmission in any form or by means, electronic, mechanical,
photocopying, recording, or likewise. For information regarding permission(s), write to: Rights and Permissions Department,
Pearson Education, Inc., Upper Saddle River, NJ 07458.
- 4. 4
10.5 Investment in a new trench excavator:
0 1 2 3 4 5
Income Statement
Revenues (savings)
Expenses:
Required annual digging (ft) 6,400 6,400 6,400 6,400 6,400
Number of hours to operate 400 400 400 467 533
Operating cost (@$15/hr) $6,000 $6,000 $6,000 $7,005 $7,995
Depreciation $40,000 $64,000 $38,400 $23,040 $11,520
Taxable Income ($46,000) ($70,000) ($44,400) ($30,045) ($19,515)
Income Taxes (34%) ($15,640) ($23,800) ($15,096) ($10,215) ($6,635)
Net Income ($30,360) ($46,200) ($29,304) ($19,830) ($12,880)
Cash Flow Statement
Operating Activities:
Net Income ($30,360) ($46,200) ($29,304) ($19,830) ($12,880)
Depreciation $40,000 $64,000 $38,400 $23,040 $11,520
Investment Activities:
Investment ($200,000)
Salvage $40,000
Gains Tax $5,766
Net Cash Flow ($200,000) $9,640 $17,800 $9,096 $3,210 $44,407
Contemporary Engineering Economics, Fourth Edition, By Chan S. Park. ISBN 0-13-187628-7.
© 2007 Pearson Education, Inc., Upper Saddle River, NJ. All rights reserved. This material is protected by Copyright and written permission should be
obtained from the publisher prior to any prohibited reproduction, storage in a retrieval system, or transmission in any form or by means, electronic, mechanical,
photocopying, recording, or likewise. For information regarding permission(s), write to: Rights and Permissions Department,
Pearson Education, Inc., Upper Saddle River, NJ 07458.
- 5. 10.6
Revenues (savings) $52,000 $52,000 $52,000 $52,000 $52,000
Expenses:
Software development $20,000
Operating expenses $12,000 $12,000 $12,000 $12,000 $12,000
Depreciation 20,800 33,280 19,968 11,981 5,990
Taxable Income ($800) $6,720 $20,032 $28,019 $34,010
Income Taxes (35%) (280) 2,352 7,011 9,807 11,903
Net Income ($520) $4,368 $13,021 $18,212 $22,106
Cash Flow Statement
Operating Activities:
Net Income (520) 4,368 13,021 18,212 22,106
Depreciation 20,800 33,280 19,968 11,981 5,990
Investment Activities:
Investment (104,000) 0
Gains Tax (35%) 4,194
Net Cash Flow ($104,000) $20,280 $37,648 $32,989 $30,193 $32,290
10.7
Input Output
Tax Rate(%)= 40 PW(i)= $9,465
MARR(%)= 12 IRR(%)= 31.17%
0 1 2 3 4 5
Income Statement
Revenues (savings) $20,160 $20,160 $20,160 $20,160 $20,160
Expenses:
Operating expenses $10,000 $10,000 $10,000 $10,000 $10,000
Depreciation 3,700 5,920 3,552 2,131 1,066
Taxable Income $6,460 $4,240 $6,608 $8,029 $9,094
Income Taxes(40%) 2,584 1,696 2,643 3,212 3,638
Net Income $3,876 $2,544 $3,965 $4,817 $5,457
Cash Flow Statement
Operating Activities:
Net Income 3,876 2,544 3,965 4,817 5,457
Depreciation 3,700 5,920 3,552 2,131 1,066
Investment Activities:
Investment (18,500)
Salvage 1,850
Gains Tax 112
Net Cash Flow ($18,500) $7,576 $8,464 $7,517 $6,948 $8,260
Contemporary Engineering Economics, Fourth Edition, By Chan S. Park. ISBN 0-13-187628-7.
© 2007 Pearson Education, Inc., Upper Saddle River, NJ. All rights reserved. This material is protected by Copyright and written permission should be
obtained from the publisher prior to any prohibited reproduction, storage in a retrieval system, or transmission in any form or by means, electronic, mechanical,
photocopying, recording, or likewise. For information regarding permission(s), write to: Rights and Permissions Department,
Pearson Education, Inc., Upper Saddle River, NJ 07458.
- 6. 10.8 (a) & (b) – a good investment to undertake.
Input Output
Tax Rate(%)= 40 PW(i)= $334,792
MARR(%)= 12 IRR(%)= 92%
0 1 2 3 4 5 6
Income Statement
Revenues (savings) $300,000 $300,000 $300,000 $300,000 $300,000 $300,000
Expenses:
Labor $80,000 $80,000 $80,000 $80,000 $80,000 $80,000
Materials 50,000 50,000 50,000 50,000 50,000 50,000
Depreciation 24,000 38,400 23,040 13,824 13,824 6,912
Taxable Income $146,000 $131,600 $146,960 $156,176 $156,176 $163,088
Income Taxes 58,400 52,640 58,784 62,470 62,470 65,235
Net Income $87,600 $78,960 $88,176 $93,706 $93,706 $97,853
Cash Flow Statement
Operating Activities:
Net Income 87,600 78,960 88,176 93,706 93,706 97,853
Depreciation 24,000 38,400 23,040 13,824 13,824 6,912
Investment Activities:
Investment (120,000)
Salvage 0
Gains Tax 0
Net Cash Flow ($120,000) $111,600 $117,360 $111,216 $107,530 $107,530 $104,765
10.9
0 1 2 3 4 5
Income Statement
Revenues (savings) $250,000 $250,000 $250,000 $250,000 $250,000
Expenses:
O&M costs $50,000 $50,000 $50,000 $50,000 $50,000
Depreciation 40,000 64,000 38,400 23,040 11,520
Taxable Income $160,000 $136,000 $161,600 $176,960 $188,480
Income Taxes (40%) 64,000 54,400 64,640 70,784 75,392
Net Income $96,000 $81,600 $96,960 $106,176 $113,088
Cash Flow Statement
Operating Activities:
Net Income $ 96,000 $ 81,600 $ 96,960 $ 106,176 $ 113,088
Depreciation $ 40,000 $ 64,000 $ 38,400 $ 23,040 $ 11,520
Investment Activities:
Investment $ (200,000)
Salvage $ 5,000
Gains Tax $ 7,216
Net Cash Flow ($200,000) $136,000 $145,600 $135,360 $129,216 $136,824
∴ Return on invest = 62.88%.
Contemporary Engineering Economics, Fourth Edition, By Chan S. Park. ISBN 0-13-187628-7.
© 2007 Pearson Education, Inc., Upper Saddle River, NJ. All rights reserved. This material is protected by Copyright and written permission should be
obtained from the publisher prior to any prohibited reproduction, storage in a retrieval system, or transmission in any form or by means, electronic, mechanical,
photocopying, recording, or likewise. For information regarding permission(s), write to: Rights and Permissions Department,
Pearson Education, Inc., Upper Saddle River, NJ 07458.
- 7. 10.10 Investment in energy management system: N = 9 years
Input Output
Tax Rate(%) = 35 PW(i) = $1,998
MARR(%) = 10 IRR(%) = 11.19%
0 1 2 3 4 5-8 9
Income Statement
Energy Savings $10,000 $10,000 $10,000 $10,000 $10,000 $10,000
Expenses:
Depreciation 16,665 22,225 7,405 3,705 0 0
Taxable Income ($6,665) ($12,225) $2,595 $6,295 $10,000 $10,000
Income Taxes (2,333) (4,279) 908 2,203 3,500 3,500
Net Income ($4,332) ($7,946) $1,687 $4,092 $6,500 $6,500
Cash Flow Statement
Operating Activities:
Net Income $ (4,332) $ (7,946) $ 1,687 $ 4,092 $ 6,500 $ 6,500
Depreciation $ 16,665 $ 22,225 $ 7,405 $ 3,705 $ - $ -
Investment Activities:
Investment $ (50,000)
Salvage 0
Gains Tax (0)
Net Cash Flow ($50,000) $12,333 $14,279 $9,092 $7,797 $6,500 $6,500
Contemporary Engineering Economics, Fourth Edition, By Chan S. Park. ISBN 0-13-187628-7.
© 2007 Pearson Education, Inc., Upper Saddle River, NJ. All rights reserved. This material is protected by Copyright and written permission should be
obtained from the publisher prior to any prohibited reproduction, storage in a retrieval system, or transmission in any form or by means, electronic, mechanical,
photocopying, recording, or likewise. For information regarding permission(s), write to: Rights and Permissions Department,
Pearson Education, Inc., Upper Saddle River, NJ 07458.
- 8. 10.11 Investment decision based on after-tax IRR:
Input Output
Tax Rate(%) = 40 PW(i) = ($0)
MARR(%) = 12 IRR(% )= 12.00%
0 1 2 3 4 5
Income Statement
Revenues (savings) $130,000 $130,000 $130,000 $130,000 $130,000
Expenses:
O&M costs $20,000 $20,000 $20,000 $20,000 $20,000
Depreciation 116,920 155,928 51,953 25,994 0
Taxable Income ($6,920) ($45,928) $58,047 $84,006 $110,000
Income Taxes (40%) (2,768) (18,371) 23,219 33,602 44,000
Net Income ($4,152) ($27,557) $34,828 $50,404 $66,000
Cash Flow Statement
Operating Activities:
Net Income $ (4,152) $ (27,557) $ 34,828 $ 50,404 $ 66,000
Depreciation $ 116,920 $ 155,928 $ 51,953 $ 25,994 $ -
Investment Activities:
Investment $ (350,794)
Salvage 0
Gains Tax 0
Net Cash Flow ($350,794) $112,768 $128,371 $86,781 $76,398 $66,000
Contemporary Engineering Economics, Fourth Edition, By Chan S. Park. ISBN 0-13-187628-7.
© 2007 Pearson Education, Inc., Upper Saddle River, NJ. All rights reserved. This material is protected by Copyright and written permission should be
obtained from the publisher prior to any prohibited reproduction, storage in a retrieval system, or transmission in any form or by means, electronic, mechanical,
photocopying, recording, or likewise. For information regarding permission(s), write to: Rights and Permissions Department,
Pearson Education, Inc., Upper Saddle River, NJ 07458.
- 9. Investment in Working Capital
10.12
0 1 2 3 4 5 6 7 8 9 10
Income Statement
Revenues (savings) $675,000 $675,000 $675,000 $675,000 $675,000 $675,000 $675,000 $675,000 $675,000 $675,000
Expenses:
Production cost $425,000 $425,000 $425,000 $425,000 $425,000 $425,000 $425,000 $425,000 $425,000 $425,000
Depreciation :
Building $36,860 $38,462 $38,462 $38,462 $38,462 $38,462 $38,462 $38,462 $38,462 $36,860
Equipment $71,450 $122,450 $87,450 $62,450 $44,650 $44,600 $44,650 $22,300
Taxable Income $141,691 $89,089 $124,089 $149,089 $166,889 $166,939 $166,889 $189,239 $211,539 $213,141
Income Taxes $56,676 $35,635 $49,635 $59,635 $66,755 $66,775 $66,755 $75,695 $84,615 $85,256
Net Income $85,014 $53,453 $74,453 $89,453 $100,133 $100,163 $100,133 $113,543 $126,923 $127,884
Cash Flow Statement
Operating Activities:
Net Income $85,014 $53,453 $74,453 $89,453 $100,133 $100,163 $100,133 $113,543 $126,923 $127,884
Depreciation $108,310 $160,912 $125,912 $100,912 $83,112 $83,062 $83,112 $60,762 $38,462 $36,860
Investment Activities:
Land ($250,000) $500,000
Building ($1,500,000) $700,000
Machines ($500,000) $50,000
Gains Tax
Land ($87,500)
Building $182,179
Equipment ($20,000)
Working capital ($150,000) $150,000
Net Cash Flow ($2,400,000) $193,324 $214,365 $200,365 $190,365 $183,245 $183,225 $183,245 $174,305 $165,385 $1,639,423
(a) PW (15%) with working capital = −$1, 083,867 , do not accept the project.
(b) PW (15%) without working capital = −$970, 945 , still do not accept the project.
Contemporary Engineering Economics, Fourth Edition, By Chan S. Park. ISBN 0-13-187628-7.
© 2007 Pearson Education, Inc., Upper Saddle River, NJ. All rights reserved. This material is protected by Copyright and written permission should be
obtained from the publisher prior to any prohibited reproduction, storage in a retrieval system, or transmission in any form or by means, electronic, mechanical,
photocopying, recording, or likewise. For information regarding permission(s), write to: Rights and Permissions Department,
Pearson Education, Inc., Upper Saddle River, NJ 07458.
- 10. 10.13
Input Output
Tax Rate(%)= 35 PW(i)= $52,163
MARR(%)= 18 IRR(%)= 42%
0 1 2 3 4 5 6
Income Statement
Revenues (savings) $55,800 $55,800 $55,800 $55,800 $55,800 $55,800
Expenses:
Operating cost $8,120 $8,120 $8,120 $8,120 $8,120 $8,120
Depreciation 13,100 20,960 12,576 7,546 7,546 1,886
Taxable Income $34,580 $26,720 $35,104 $40,134 $40,134 $45,794
Income Taxes (35%) $12,103 $9,352 $12,286 $14,047 $14,047 $16,028
Net Income $22,477 $17,368 $22,818 $26,087 $26,087 $29,766
Cash Flow Statement
Operating Activities:
Net Income $22,477 $17,368 $22,818 $26,087 $26,087 $29,766
Depreciation $13,100 $20,960 $12,576 $7,546 $7,546 $1,886
Investment Activities:
Investment ($65,500)
Salvage $3,000
Gains Tax ($390)
Worikng capital ($10,000) $10,000
Net Cash Flow ($75,500) $35,577 $38,328 $35,394 $33,633 $33,633 $44,262
Comments: The operating cost represents the annual expenses related to operate the scanning
equipment.
Contemporary Engineering Economics, Fourth Edition, By Chan S. Park. ISBN 0-13-187628-7.
© 2007 Pearson Education, Inc., Upper Saddle River, NJ. All rights reserved. This material is protected by Copyright and written permission should be
obtained from the publisher prior to any prohibited reproduction, storage in a retrieval system, or transmission in any form or by means, electronic, mechanical,
photocopying, recording, or likewise. For information regarding permission(s), write to: Rights and Permissions Department,
Pearson Education, Inc., Upper Saddle River, NJ 07458.
- 11. 10.14 Delaware Chemical Corporation: (a), (b), and (c)
(All units in $000)
Calendar year 0 1 2 3 4 5 6 7 8 9 10 11 12 13
Base period -3 -2 -1 0 1 2 3 4 5 6 7 8 9 10
Income Statement
Revenues (savings) $50,000 $55,000 $60,500 $66,550 $73,205 $80,526 $72,473 $65,226 $58,703 $52,833
Expenses:
R&D expenses $500 $2,500 $2,000
Production cost $40,000 $44,000 $48,400 $53,240 $58,564 $64,420 $57,978 $52,181 $46,962 $42,266
Depreciation :
Building $49 $51 $51 $51 $51 $51 $51 $51 $51 $49
Equipment $429 $735 $525 $375 $268 $268 $268 $134
Taxable Income ($500) ($2,500) ($2,000) $9,522 $10,214 $11,524 $12,884 $14,322 $15,786 $14,175 $12,860 $11,689 $10,517
Income Taxes ($200) ($1,000) ($800) $3,809 $4,086 $4,610 $5,154 $5,729 $6,314 $5,670 $5,144 $4,676 $4,207
Net Income ($300) ($1,500) ($1,200) $5,713 $6,128 $6,914 $7,730 $8,593 $9,472 $8,505 $7,716 $7,014 $6,310
Cash Flow Statement
Operating Activities:
Net Income ($300) ($1,500) ($1,200) $5,713 $6,128 $6,914 $7,730 $8,593 $9,472 $8,505 $7,716 $7,014 $6,310
Depreciation $478 $786 $576 $426 $319 $319 $319 $185 $51 $49
Investment Activities:
Building ($2,000) $1,000
Machines ($3,000) $300
Gains Tax
Building $197
Equipment ($120)
Working capital ($5,000) ($500) ($550) ($605) ($666) ($732) $805 $725 $652 $587 $5,283
Net Cash Flow ($300) ($1,500) ($1,200) ($10,000) $5,691 $6,364 $6,885 $7,491 $8,180 $10,596 $9,549 $8,553 $7,652 $13,019
(b) IRR = 43.28%
(c) PW(20%) = $10,253
Contemporary Engineering Economics, Fourth Edition, By Chan S. Park. ISBN 0-13-187628-7.
© 2007 Pearson Education, Inc., Upper Saddle River, NJ. All rights reserved. This material is protected by Copyright and written permission should be
obtained from the publisher prior to any prohibited reproduction, storage in a retrieval system, or transmission in any form or by means, electronic, mechanical,
photocopying, recording, or likewise. For information regarding permission(s), write to: Rights and Permissions Department,
Pearson Education, Inc., Upper Saddle River, NJ 07458.
- 12. Effects of Borrowing
10.15
Income Statement
0 1 2 3 4 5
Income Statement
Revenue $3,034,510 $3,034,510 $3,034,510 $3,034,510 $3,034,510
Expenses:
O&M 330,000 380,000 430,000 480,000 530,000
Depreciation 306,713 320,513 320,513 320,513 306,713
Debt interest 1,250,000 1,045,253 820,032 572,288 299,770
Taxable Income $1,147,797 $1,288,744 $1,463,965 $1,661,709 $1,898,027
Income Taxes $401,729 $451,060 $512,388 $581,598 $664,309
Net Income $746,068 $837,684 $951,577 $1,080,111 $1,233,718
Cash Flow Statement
Cash from operation
Net Income $ 746,068 $ 837,684 $
951,577 $ 1,080,111 $ 1,233,718
Depreciation $ 306,713 $ 320,513 $
320,513 $ 320,513 $ 306,713
Investment / Salvage $ (12,500,000) $ 14,000,000
Gains Tax $ (1,076,238)
Loan repayment $ 12,500,000 $ (2,047,469) $ (2,252,216) $ (2,477,437) $ (2,725,181) $ (2,997,699)
Net Cash Flow $0 ($994,688) ($1,094,019) ($1,205,347) ($1,324,557) $11,466,494
PW (15%) = $2,458,837
IRR = 41.91%
Contemporary Engineering Economics, Fourth Edition, By Chan S. Park. ISBN 0-13-187628-7.
© 2007 Pearson Education, Inc., Upper Saddle River, NJ. All rights reserved. This material is protected by Copyright and written permission should be
obtained from the publisher prior to any prohibited reproduction, storage in a retrieval system, or transmission in any form or by means, electronic, mechanical,
photocopying, recording, or likewise. For information regarding permission(s), write to: Rights and Permissions Department,
Pearson Education, Inc., Upper Saddle River, NJ 07458.
- 13. 10.16
0 1 2 3 4 5 6 7
Income Statement
Revenues (savings) $120,000 $120,000 $120,000 $120,000 $120,000 $120,000 $120,000
Expenses:
Depreciation $37,000 $59,200 $35,520 $21,312 $21,312 $10,656
Deit interest $18,500 $14,800 $11,100 $7,400 $3,700
Taxable Income $64,500 $46,000 $73,380 $91,288 $94,988 $109,344 $120,000
Income Taxes(35%) $22,575 $16,100 $25,683 $31,951 $33,246 $38,270 $42,000
Net Income $41,925 $29,900 $47,697 $59,337 $61,742 $71,074 $78,000
Cash Flow Statement
Operating Activities:
Net Income $41,925 $29,900 $47,697 $59,337 $61,742 $71,074 $78,000
Depreciation $37,000 $59,200 $35,520 $21,312 $21,312 $10,656 $0
Investment Activities:
Investment ($185,000)
Salvage $40,000
Gains Tax ($14,000)
Financing Activities:
Borrowed funds $185,000
Principal repayment ($37,000) ($37,000) ($37,000) ($37,000) ($37,000)
Net Cash Flow $0 $41,925 $52,100 $46,217 $43,649 $46,054 $81,730 $104,000
Note: This situation calls for a constant rate of reduction on principal payment.
Contemporary Engineering Economics, Fourth Edition, By Chan S. Park. ISBN 0-13-187628-7.
© 2007 Pearson Education, Inc., Upper Saddle River, NJ. All rights reserved. This material is protected by Copyright and written permission should be
obtained from the publisher prior to any prohibited reproduction, storage in a retrieval system, or transmission in any form or by means, electronic, mechanical,
photocopying, recording, or likewise. For information regarding permission(s), write to: Rights and Permissions Department,
Pearson Education, Inc., Upper Saddle River, NJ 07458.
- 14. 10.17
• Annual payment = $100, 000( A / P,11%,5) = $27, 060
• New after tax cash flow
0 1 2 3 4 5
Income Statement
Revenues (savings) $250,000 $250,000 $250,000 $250,000 $250,000
Expenses:
O&M costs $50,000 $50,000 $50,000 $50,000 $50,000
Depreciation 40,000 64,000 38,400 23,040 11,520
Debt interest 11,000 9,233 7,272 5,096 2,680
Taxable Income $149,000 $126,767 $154,328 $171,864 $185,800
Income Taxes (40%) 59,600 50,707 61,731 68,746 74,320
Net Income $89,400 $76,060 $92,597 $103,118 $111,480
Cash Flow Statement
Operating Activities:
Net Income $ 89,400 $ 76,060 $ 92,597 $ 103,118 $ 111,480
Depreciation $ 40,000 $ 64,000 $ 38,400 $ 23,040 $ 11,520
Investment Activities:
Investment $ (200,000)
Salvage $ 5,000
Gains Tax $ 7,216
Financing Activities:
Borrowed funds $ 100,000
Principal repayment $ (16,060) $ (17,827) $ (19,788) $ (21,964) $ (24,380)
Net Cash Flow $ (100,000) $ 113,340 $ 122,233 $ 111,209 $ 104,194 $ 110,836
10.18
Cash flow statement 0 1 2
Operating activities:
Net income $10,400 $12,019
Depreciation $6,666 $4,445
Investment activities:
Investment ($20,000)
Salvage $8,000
Gains Tax (40%) $356
Financial activities:
Borrowed funds $10,000
Principal repayment ($4,762) ($5,238)
Net cash flow ($10,000) $12,304 $19,581
NPW(15%) = $15,505.48
Note: Annual installments for the loan = $10,000( A / P,10%, 2) = $5, 762
Contemporary Engineering Economics, Fourth Edition, By Chan S. Park. ISBN 0-13-187628-7.
© 2007 Pearson Education, Inc., Upper Saddle River, NJ. All rights reserved. This material is protected by Copyright and written permission should be
obtained from the publisher prior to any prohibited reproduction, storage in a retrieval system, or transmission in any form or by means, electronic, mechanical,
photocopying, recording, or likewise. For information regarding permission(s), write to: Rights and Permissions Department,
Pearson Education, Inc., Upper Saddle River, NJ 07458.
- 15. 10.19 Income statement approach:
Input Output
Tax Rate(% )= 40 PW(i) = $241,601
MARR(%) = 18 IRR(%) = 91.54%
(a)
0 1 2 3 4 5-7 8 9 10
Income Statement
Revenues:
Additional revenue $80,000 $80,000 $80,000 $80,000 $80,000 $80,000 $80,000 $80,000
Labor & materials savings $ 55,000 $ 55,000 $ 55,000 $ 55,000 $ 55,000 $ 55,000 $ 55,000 $ 55,000
Expenses:
Depreciation $ 28,580 $ 48,980 $ 34,980 $ 24,980 $ 17,860 $ 8,920
Debt interest $ 13,500 $ 9,000 $ 4,500
Taxable Income $ 92,920 $ 77,020 $ 95,520 $ 110,020 $ 117,140 $ 126,080 $ 135,000 $ 135,000
Income Taxes $ 37,168 $ 30,808 $ 38,208 $ 44,008 $ 46,856 $ 50,432 $ 54,000 $ 54,000
Net Income $55,752 $46,212 $57,312 $66,012 $70,284 $75,648 $81,000 $81,000
Cash Flow Statement
Operating Activities:
Net Income $ 55,752 $ 46,212 $ 57,312 $ 66,012 $ 70,284 $ 75,648 $ 81,000 $ 81,000
Depreciation $ 28,580 $ 48,980 $ 34,980 $ 24,980 $ 17,860 $ 8,920 $ - $ -
Investment Activities:
Investment $ (200,000)
Salvage $ 20,000
Gains Tax $ (8,000)
Financing Activities:
Borrowed funds $ 150,000
Principal repayment $ (50,000) $ (50,000) $ (50,000)
Net Cash Flow ($50,000) $34,332 $45,192 $42,292 $90,992 $88,144 $84,568 $81,000 $93,000
Contemporary Engineering Economics, Fourth Edition, By Chan S. Park. ISBN 0-13-187628-7.
© 2007 Pearson Education, Inc., Upper Saddle River, NJ. All rights reserved. This material is protected by Copyright and written permission should be
obtained from the publisher prior to any prohibited reproduction, storage in a retrieval system, or transmission in any form or by means, electronic, mechanical,
photocopying, recording, or likewise. For information regarding permission(s), write to: Rights and Permissions Department,
Pearson Education, Inc., Upper Saddle River, NJ 07458.
- 16. 10.20 (a) and (b)
Input Output
Tax Rate(%) = 35 PW(i) = ($1,318,770)
MARR(%) = 18 IRR(%) =
0 1 2 3 4 5
Income Statement
Revenues (savings)
Expenses:
Depreciation 285,800 489,800 349,800 249,800 89,300
Debt interest 80,000 66,896 52,482 36,626 19,185
Taxable Income ($365,800) ($556,696) ($402,282) ($286,426) ($108,485)
Income Taxes (35%) (128,030) (194,844) (140,799) (100,249) (37,970)
Net Income ($237,770) ($361,853) ($261,483) ($186,177) ($70,515)
Cash Flow Statement
Operating Activities:
Net Income $ (237,770) $ (361,853) $ (261,483) $ (186,177) $ (70,515)
Depreciation $ 285,800 $ 489,800 $ 349,800 $ 249,800 $ 89,300
Investment Activities:
Investment $ (2,000,000)
Salvage $ 200,000
Gains Tax $ 117,425
Financing Activities:
Borrowed funds $ 800,000
Principal repayment $ (131,038) $ (144,142) $ (158,556) $ (174,412) $ (191,853)
Net Cash Flow ($1,200,000) $ (83,008) $ (16,194) $ (70,239) $ (110,789) $ 144,357
(b) This is a service project. The equivalent annual cost is
AEC (18%) = $1,318, 770( A / P,18%,5)
= $421, 743
Contemporary Engineering Economics, Fourth Edition, By Chan S. Park. ISBN 0-13-187628-7.
© 2007 Pearson Education, Inc., Upper Saddle River, NJ. All rights reserved. This material is protected by Copyright and written permission should be
obtained from the publisher prior to any prohibited reproduction, storage in a retrieval system, or transmission in any form or by means, electronic, mechanical,
photocopying, recording, or likewise. For information regarding permission(s), write to: Rights and Permissions Department,
Pearson Education, Inc., Upper Saddle River, NJ 07458.
- 17. 10.21
(a) After tax cash flow
Input Output
Tax Rate(%) = 36 PW(i) = $3,593
MARR(%) = 15 IRR(%) =
0 1 2 3 4 5 6
Income Statement
Revenues (savings) $10,000 $10,000 $10,000 $10,000 $10,000 $10,000
Expenses:
Depreciation $5,002 $8,572 $6,122 $4,372 $3,126 $1,563
Debt interest $4,200 $3,683 $3,103 $2,454 $1,727 $913
Taxable Income $799 ($2,254) $775 $3,175 $5,148 $7,524
Income Taxes (36%) $287 ($811) $279 $1,143 $1,853 $2,709
Net Income $511 ($1,443) $496 $2,032 $3,294 $4,816
Cash Flow Statement
Operating Activities:
Net Income $511 ($1,443) $496 $2,032 $3,294 $4,816
Depreciation $5,002 $8,572 $6,122 $4,372 $3,126 $1,563
Investment Activities:
Investment ($35,000)
Salvage $3,000
Gains Tax $1,168
Financing Activities:
Borrowed funds $35,000
Principal repayment ($4,312) ($4,829) ($5,409) ($6,058) ($6,785) ($7,599)
Net Cash Flow $0 $1,201 $2,299 $1,209 $345 ($365) $2,948
(b) No meaningful IRR exists. We need to use the present worth analysis. Since
PW(15%) > 0, the project is acceptable.
Contemporary Engineering Economics, Fourth Edition, By Chan S. Park. ISBN 0-13-187628-7.
© 2007 Pearson Education, Inc., Upper Saddle River, NJ. All rights reserved. This material is protected by Copyright and written permission should be
obtained from the publisher prior to any prohibited reproduction, storage in a retrieval system, or transmission in any form or by means, electronic, mechanical,
photocopying, recording, or likewise. For information regarding permission(s), write to: Rights and Permissions Department,
Pearson Education, Inc., Upper Saddle River, NJ 07458.
- 18. 10.22 (a) and (b)
Input Output
Tax Rate(%) = 40 PW(i) = $35,723
MARR(%) = 14 IRR(%) = 31.02%
0 1 2 3 4 5 6 7 8
Income Statement
Revenues (savings) $40,000 $40,000 $40,000 $40,000 $40,000 $40,000 $40,000 $40,000
Expenses:
O&M cost 5,000 5,000 5,000 5,000 5,000 5,000 5,000 5,000
Depreciation 14,290 24,490 17,490 12,490 8,930 8,920 8,930 4,460
Debt interest 4,000 3,650 3,265 2,842 2,377 1,865 1,301 682
Taxable Income $16,710 $6,860 $14,245 $19,668 $23,693 $24,215 $24,769 $29,858
Income Taxes (40%) 6,684 2,744 5,698 7,867 9,477 9,686 9,907 11,943
Net Income $10,026 $4,116 $8,547 $11,801 $14,216 $14,529 $14,861 $17,915
Cash Flow Statement
Operating Activities:
Net Income $ 10,026 $ 4,116 $ 8,547 $ 11,801 $ 14,216 $ 14,529 $ 14,861 $ 17,915
Depreciation $ 14,290 $ 24,490 $ 17,490 $ 12,490 $ 8,930 $ 8,920 $ 8,930 $ 4,460
Investment Activities:
Investment $ (100,000)
Salvage $ 10,000
Gains Tax $ (4,000)
Financing Activities:
Borrowed funds $ 40,000
Principal repayment $ (3,498) $ (3,848) $ (4,232) $ (4,656) $ (5,121) $ (5,633) $ (6,196) $ (6,816)
Net Cash Flow ($60,000) $20,818 $24,758 $21,804 $19,635 $18,025 $17,816 $17,595 $21,559
Contemporary Engineering Economics, Fourth Edition, By Chan S. Park. ISBN 0-13-187628-7.
© 2007 Pearson Education, Inc., Upper Saddle River, NJ. All rights reserved. This material is protected by Copyright and written permission should be
obtained from the publisher prior to any prohibited reproduction, storage in a retrieval system, or transmission in any form or by means, electronic, mechanical,
photocopying, recording, or likewise. For information regarding permission(s), write to: Rights and Permissions Department,
Pearson Education, Inc., Upper Saddle River, NJ 07458.
- 19. Generalized Cash Flow Method
10.23 (a) with no borrowed funds:
Input Data Output
Tax Rate(%) = 35 PW(9%) = $416
MARR(%) = 9
Financial Data
year 0 1 2 3 4 5
Depreciation $ 2,000 $ 2,667 $ 889 $ 445
Book value $ 6,000 $ 4,000 $ 1,333 $ 445 $ - $ -
Salvage value $ 2,000
Gains tax $ (700)
Loan payment schedule
Interest
Principal
Revenues $ 1,500 $ 1,500 $ 1,500 $ 1,500 $ 1,500
O & M costs
Cash Flow Statement
0 1 2 3 4 5
Investment ($6,000)
Net proceeds from sale $1,300
Investment in working capital
Recovery of working capital
(1 - 0.35) (Revenue) $975 $975 $975 $975 $975
-(1 - 0.35) (Expenses) - - - - -
-(1 - 0.35) (Debt interest) - - - - -
+ (0.35) (Depreciation) $ 700 $ 933 $ 311 $ 156 -
Borrowed funds -
Principal repayment - - - - -
Net Cash Flow ($6,000) $1,675 $1,908 $1,286 $1,131 $2,275
Contemporary Engineering Economics, Fourth Edition, By Chan S. Park. ISBN 0-13-187628-7.
© 2007 Pearson Education, Inc., Upper Saddle River, NJ. All rights reserved. This material is protected by Copyright and written permission should be
obtained from the publisher prior to any prohibited reproduction, storage in a retrieval system, or transmission in any form or by means, electronic, mechanical,
photocopying, recording, or likewise. For information regarding permission(s), write to: Rights and Permissions Department,
Pearson Education, Inc., Upper Saddle River, NJ 07458.
- 20. (b) With borrowed funds:
Input Data Output
Tax Rate(%)= 35 PW(9%)= $10,104
MARR(%)= 9
year 0 1 2 3 4 5
Depreciation $2,000 $2,667 $889 $445 $0
Book value $6,000 4,000 1,333 445 0 0
Salvage value $2,000
Gains tax -700
Loan payment schedule
Interest $ 540 $ 450 $ 351 $ 244 $ 127
Principal $ 6,000 $ 1,003 $ 1,093 $ 1,191 $ 1,298 $ 1,415
Revenues $ 1,500 $ 1,500 $ 1,500 $ 1,500 $ 1,500
O&M costs
Cash Flow Statement
0 1 2 3 4 5
Investment ($6,000)
Net proceeds from sale $1,300
Investment in working capital
Recovery of working capital
(1 - 0.35) (Revenue) $975 $975 $975 $975 $975
-(1 - 0.35) (Expenses) - - - - -
-(1 - 0.35) (Debt interest) -351 -292 -228 -159 -83
+ (0.35) (Depreciation) 700 933 311 156 -
Borrowed funds $6,000
Principal repayment $ 1,003 $ 1,093 $ 1,191 $ 1,298 $ 1,415
Net Cash Flow $0 $2,327 $2,709 $2,249 $2,270 $3,607
(c) The debt financing option is more attractive. Note that the debt financing option
results in a higher net present value ($10,104 versus $416) due to the fact that the interest
payments are tax deductible and the loan interest rate is the same as the MARR.
Contemporary Engineering Economics, Fourth Edition, By Chan S. Park. ISBN 0-13-187628-7.
© 2007 Pearson Education, Inc., Upper Saddle River, NJ. All rights reserved. This material is protected by Copyright and written permission should be
obtained from the publisher prior to any prohibited reproduction, storage in a retrieval system, or transmission in any form or by means, electronic, mechanical,
photocopying, recording, or likewise. For information regarding permission(s), write to: Rights and Permissions Department,
Pearson Education, Inc., Upper Saddle River, NJ 07458.
- 21. 10.24 Net cash flow
Input Data Output
Tax Rate(%) = 40 PW(12%) = $75,393
MARR(%) = 12
Financial Data
year 0 1 2 3 4 5
Depreciation $ 17,863 $ 30,613 $ 21,863 $ 15,613 $ 5,581
Book value $ 125,000 $107,138 $ 76,525 $ 54,663 $ 39,050 $ 33,469
Salvage value $ 50,000
Gains tax $ (6,613)
Loan payment schedule
Interest $ 12,500 $ 10,453 $ 8,200 $ 5,723 $ 2,998
Principal $ 125,000 $ 20,475 $ 22,522 $ 24,774 $ 27,252 $ 29,977
Revenues $ 60,000 $ 60,000 $ 60,000 $ 60,000 $ 60,000
O&M costs
Cash Flow Statement
0 1 2 3 4 5
Investment ($125,000)
Net proceeds from sale $43,388
Investment in working capital
Recovery of working capital
(1 - 0.40) (Revenue) $36,000 $36,000 $36,000 $36,000 $36,000
-(1 - 0.40) (Expenses) - - - - -
-(1 - 0.40) (Debt interest) $ (7,500) $ (6,272) $ (4,920) $ (3,434) $ (1,799)
+ (0.40) (Depreciation) $ 7,145 $ 12,245 $ 8,745 $ 6,245 $ 2,233
Borrowed funds $ 125,000
Principal repayment $ (20,475) $ (22,522) $ (24,774) $ (27,252) $ (29,977)
Net Cash Flow $0 $15,170 $19,451 $15,050 $11,559 $49,844
Contemporary Engineering Economics, Fourth Edition, By Chan S. Park. ISBN 0-13-187628-7.
© 2007 Pearson Education, Inc., Upper Saddle River, NJ. All rights reserved. This material is protected by Copyright and written permission should be
obtained from the publisher prior to any prohibited reproduction, storage in a retrieval system, or transmission in any form or by means, electronic, mechanical,
photocopying, recording, or likewise. For information regarding permission(s), write to: Rights and Permissions Department,
Pearson Education, Inc., Upper Saddle River, NJ 07458.
- 22. 10.25 Air South Airline
Cash Flow Statement 0 1 2 3 4 5 6 7
Investment $ (60,000)
Net proceeds from sale
Investment in working capital
Recovery of working capital
(1 - 0.38)(Revenue) $ 21,700 $ 21,700 $ 21,700 $ 21,700 $ 21,700 $ 21,700 $ 21,700
-(1 - 0.38)(Expenses) $ (12,400) $ (12,400) $ (12,400) $ (12,400) $ (12,400) $ (12,400) $ (12,400)
-(1 - 0.38) (Debt interest) $ (4,018) $ (4,018) $ (4,018) $ (4,018) $ (4,018) $ (4,018) $ (4,018)
+(0.38)(Depreciation) $ 3,257 $ 5,584 $ 3,988 $ 2,849 $ 2,035 $ 2,035 $ 2,035
Borrowed funds $ 54,000
Principal repayment
Net cash flow $ (6,000) $ 8,539 $ 10,866 $ 9,270 $ 8,131 $ 7,317 $ 7,317 $ 7,317
Cash Flow Statement 8 9 10 11 12 13 14 15
Investment
Net proceeds from sale $ 5,580
Investment in working capital
Recovery of working capital
(1 - 0.38)(Revenue) $ 21,700 $ 21,700 $ 21,700 $ 21,700 $ 21,700 $ 21,700 $ 21,700 $ 21,700
-(1 - 0.38)(Expenses) $ (12,400) $ (12,400) $ (12,400) $ (12,400) $ (12,400) $ (12,400) $ (12,400) $ (12,400)
-(1 - 0.38) (Debt interest) $ (4,018) $ (4,018) $ (4,018)
+(0.38)(Depreciation) $ 1,017
Borrowed funds
Principal repayment $ (54,000)
Net cash flow $ 6,299 $ 5,282 $ (48,718) $ 9,300 $ 9,300 $ 9,300 $ 9,300 $ 14,880
PW(18%) = $ 26,663 > 0, Accept the investment.
Contemporary Engineering Economics, Fourth Edition, By Chan S. Park. ISBN 0-13-187628-7.
© 2007 Pearson Education, Inc., Upper Saddle River, NJ. All rights reserved. This material is protected by Copyright and written permission should be
obtained from the publisher prior to any prohibited reproduction, storage in a retrieval system, or transmission in any form or by means, electronic, mechanical,
photocopying, recording, or likewise. For information regarding permission(s), write to: Rights and Permissions Department,
Pearson Education, Inc., Upper Saddle River, NJ 07458.
- 23. Comparing Mutually Exclusive Alternatives
10.26
(a) The net after-tax cash flows for each financing option:
• Option 1: Retained earnings
Input Output
Tax Rate(%) = 39 PW(i) = $161,321
MARR(%) = 18 IRR(%) = 42.46%
Option 1: Financing with retained earnings
0 1 2 3 4 5 6
Income Statement
Revenues (savings) $174,000 $174,000 $174,000 $174,000 $174,000 $174,000
Expenses:
O&M costs $22,000 $22,000 $22,000 $22,000 $22,000 $22,000
Depreciation 28,580 48,980 34,980 24,980 17,860 8,930
Debt interest
Taxable Income $123,420 $103,020 $117,020 $127,020 $134,140 $143,070
Income Taxes 48,134 40,178 45,638 49,538 52,315 55,797
Net Income $75,286 $62,842 $71,382 $77,482 $81,825 $87,273
Cash Flow Statement
Operating Activities:
Net Income $ 75,286 $ 62,842 $ 71,382 $ 77,482 $ 81,825 $ 87,273
Depreciation $ 28,580 $ 48,980 $ 34,980 $ 24,980 $ 17,860 $ 8,930
Investment Activities:
Investment $ (200,000)
Salvage $ 30,000
Gains Tax $ 2,219
Working capital $ (25,000) $ 25,000
Financing Activities:
Borrowed funds
Principal repayment
Net Cash Flow ($225,000) $103,866 $111,822 $106,362 $102,462 $99,685 $153,422
Contemporary Engineering Economics, Fourth Edition, By Chan S. Park. ISBN 0-13-187628-7.
© 2007 Pearson Education, Inc., Upper Saddle River, NJ. All rights reserved. This material is protected by Copyright and written permission should be
obtained from the publisher prior to any prohibited reproduction, storage in a retrieval system, or transmission in any form or by means, electronic, mechanical,
photocopying, recording, or likewise. For information regarding permission(s), write to: Rights and Permissions Department,
Pearson Education, Inc., Upper Saddle River, NJ 07458.
- 24. • Option 2:Use a 12% term loan
Input Output
Tax Rate(%) = 39 PW(i) = $214,470
MARR(%) = 18 IRR(%) = 263.36%
Option 2: Debt Financing
0 1 2 3 4 5 6
Income Statement
Revenues (savings) $174,000 $174,000 $174,000 $174,000 $174,000 $174,000
Expenses:
O&M costs $22,000 $22,000 $22,000 $22,000 $22,000 $22,000
Depreciation 28,580 48,980 34,980 24,980 17,860 8,930
Debt interest 24,000 21,043 17,730 14,021 9,866 5,212
Taxable Income $99,420 $81,977 $99,290 $112,999 $124,274 $137,858
Income Taxes 38,774 31,971 38,723 44,070 48,467 53,765
Net Income $60,646 $50,006 $60,567 $68,929 $75,807 $84,093
Cash Flow Statement
Operating Activities:
Net Income $ 60,646 $ 50,006 $ 60,567 $ 68,929 $ 75,807 $ 84,093
Depreciation $ 28,580 $ 48,980 $ 34,980 $ 24,980 $ 17,860 $ 8,930
Investment Activities:
Investment $ (200,000)
Salvage $ 30,000
Gains Tax $ 2,219
Working capital $ (25,000) $ 25,000
Financing Activities:
Borrowed funds 200,000
Principal repayment $ (24,645) $ (27,602) $ (30,915) $ (34,624) $ (38,780) $ (43,433)
Net Cash Flow ($25,000) $64,581 $71,384 $64,632 $59,285 $54,887 $106,809
Contemporary Engineering Economics, Fourth Edition, By Chan S. Park. ISBN 0-13-187628-7.
© 2007 Pearson Education, Inc., Upper Saddle River, NJ. All rights reserved. This material is protected by Copyright and written permission should be
obtained from the publisher prior to any prohibited reproduction, storage in a retrieval system, or transmission in any form or by means, electronic, mechanical,
photocopying, recording, or likewise. For information regarding permission(s), write to: Rights and Permissions Department,
Pearson Education, Inc., Upper Saddle River, NJ 07458.
- 25. • Option 3: Leasing
Input Output
Tax Rate(%) = 39 PW(i) = $170,092
MARR(%) = 18 IRR(%) = 101.06%
Option 3: Lease Financing
0 1 2 3 4 5 6
Income Statement
Revenues (savings) $174,000 $174,000 $174,000 $174,000 $174,000 $174,000
Expenses:
O&M costs $22,000 $22,000 $22,000 $22,000 $22,000 $22,000
Financial lease $55,000 $55,000 $55,000 $55,000 $55,000 $55,000
Taxable Income ($55,000) $97,000 $97,000 $97,000 $97,000 $97,000 $152,000
Income Taxes ($21,450) 37,830 37,830 37,830 37,830 37,830 59,280
Net Income ($33,550) $59,170 $59,170 $59,170 $59,170 $59,170 $92,720
Cash Flow Statement
Operating Activities:
Net Income $ (33,550) $ 59,170 $ 59,170 $ 59,170 $ 59,170 $ 59,170 $ 92,720
Investment Activities:
Investment
Salvage
Gains Tax
Working capital $ (25,000) $ 25,000
Financing Activities:
Borrowed funds
Principal repayment
Net Cash Flow ($58,550) $59,170 $59,170 $59,170 $59,170 $59,170 $117,720
Note: With the financial lease, the lessee must assume responsibility for paying
most of the operating costs of the equipment, including the maintenance expenses.
Contemporary Engineering Economics, Fourth Edition, By Chan S. Park. ISBN 0-13-187628-7.
© 2007 Pearson Education, Inc., Upper Saddle River, NJ. All rights reserved. This material is protected by Copyright and written permission should be
obtained from the publisher prior to any prohibited reproduction, storage in a retrieval system, or transmission in any form or by means, electronic, mechanical,
photocopying, recording, or likewise. For information regarding permission(s), write to: Rights and Permissions Department,
Pearson Education, Inc., Upper Saddle River, NJ 07458.
- 26. (b) Vermont’s PW cost of owning the equipment by borrowing:
• PW of after-tax O&M
P = $22, 000(1 − 0.39)( P / A,18%, 6)
1
= $46,938
• PW of after-tax loan repayment:
P2 = $48, 645( P / A,18%, 6)
= $170,141
• PW of tax credit (shield) on depreciation and interest:
n Dn In Combined Tax Savings
1 $28,571 $24,000 $52,571(0.39) = $20,503
2 $48,980 $21,043 $70,023(0.39) = $27,309
3 $34,985 $17,730 $52,715(0.39) = $20,559
4 $24,990 $14,021 $39,011(0.39) = $15,214
5 $17,850 $9,866 $27,716(0.39) = $10,809
6 $8,925 $5,212 $14,137(0.39) = $5,513
P3 = $20,503( P / F ,18%,1) +
+$5,513( P / F ,18%, 6)
= $64,115
• PW of net proceeds from sale:
total depreciation amount = $164,301
book value = $35,699
taxable gain = $30,000 - $35,699
= ($5,699)
loss credit = (0.39)($5,699) = $2,223
net proceeds from sale = $30,000 + $2,223
= $32,223
P4 = $32,223(P / F ,18%, 6)
= $11,936
PW (15%) buy = P + P2 − P3 + P4 = $141, 028
1
Contemporary Engineering Economics, Fourth Edition, By Chan S. Park. ISBN 0-13-187628-7.
© 2007 Pearson Education, Inc., Upper Saddle River, NJ. All rights reserved. This material is protected by Copyright and written permission should be
obtained from the publisher prior to any prohibited reproduction, storage in a retrieval system, or transmission in any form or by means, electronic, mechanical,
photocopying, recording, or likewise. For information regarding permission(s), write to: Rights and Permissions Department,
Pearson Education, Inc., Upper Saddle River, NJ 07458.
- 27. (c) Vermont’s PW cost of leasing the equipment:
• PW of after-tax operating cost:
P = $22, 000(1 − 0.39)( P / A,18%, 6)
1
= $46,938
• PW of after-tax leasing expenses:
P2 = $55, 000(1 − 0.39) + $55, 000(1 − 0.39)( P / A,18%,5)
= $138, 467
P = P + P2
1
= $185, 405
(d) Buy the tipping machine.
10.27
• Option 1: Lease
PW (12%)lease = $144, 000(1 − 0.40)( P / A,12%,30)
= $695,968
• Option 2: Purchase
- Note 1: Net proceeds from sale of building:
total depreciation amount = $498,611
book value = $151,389
taxable gain (loss) = $65,000 - $151,389
= $86,389
loss credit = (0.40)($86,389) = $34,556
net proceeds from sale = $65,000 + $34,556
= $99,556
- Note 2: It is assumed that the property is placed in service during
the month of January and is disposed of during the month of
December:
D1 & D30 = (11.5 /12)(1/ 39)($650, 000) = $15,972
D2 to D29 = $650, 000 / 39 = $16, 667
Contemporary Engineering Economics, Fourth Edition, By Chan S. Park. ISBN 0-13-187628-7.
© 2007 Pearson Education, Inc., Upper Saddle River, NJ. All rights reserved. This material is protected by Copyright and written permission should be
obtained from the publisher prior to any prohibited reproduction, storage in a retrieval system, or transmission in any form or by means, electronic, mechanical,
photocopying, recording, or likewise. For information regarding permission(s), write to: Rights and Permissions Department,
Pearson Education, Inc., Upper Saddle River, NJ 07458.