SlideShare ist ein Scribd-Unternehmen logo
1 von 16
AIM: Histograms and Pictographs


                     Do Now


                                  1
The table on the left shows the number of hours students watch
television in one week. Construct a Frequency Table for the data on
the right.


                                                                      2
Anticipatory Set: Mr. Snowden ordered the grades his students 
  earned on a test.  Using these numbers, he created a histogram by 
  grouping the grades into 60’s, 70’s, 80’s, and 90’s.
    67 71 75 75 76 78 79 80 80 80 81 83 84 84 85 85 85 85 88 92


Answer the questions below the graph based on the data.

1.) What does each bar represent?

2.) How many students earned a grade between 80 and 100?


                                                                       3
Anticipatory Set: Mr. Snowden ordered the grades his students 
  earned on a test.  Using these numbers, he created a histogram by 
  grouping the grades into 60’s, 70’s, 80’s, and 90’s.
     67 71 75 75 76 78 79 80 80 80 81 83 84 84 85 85 85 85 88 92


Answer the questions below the graph based on the data.

1.) What does each bar represent?

2.) How many students earned a grade between 80 and 100?


                                                                       4
Anticipatory Set: Mr. Snowden ordered the grades his students 
  earned on a test.  Using these numbers, he created a histogram by 
  grouping the grades into 60’s, 70’s, 80’s, and 90’s.
     67 71 75 75 76 78 79 80 80 80 81 83 84 84 85 85 85 85 88 92


Answer the questions below the graph based on the data.

1.) What does each bar represent?

2.) How many students earned a grade between 80 and 100?


                                                                       5
Anticipatory Set: Mr. Snowden ordered the grades his students 
  earned on a test.  Using these numbers, he created a histogram by 
  grouping the grades into 60’s, 70’s, 80’s, and 90’s.
      67 71 75 75 76 78 79 80 80 80 81 83 84 84 85 85 85 85 88 92


Answer the questions below the graph based on the data.

1.) What does each bar represent?

2.) How many students earned a grade between 80 and 100?


                                                                       6
Anticipatory Set: Mr. Snowden ordered the grades his students 
  earned on a test.  Using these numbers, he created a histogram by 
  grouping the grades into 60’s, 70’s, 80’s, and 90’s.
      67 71 75 75 76 78 79 80 80 80 81 83 84 84 85 85 85 85 88 92


Answer the questions below the graph based on the data.

1.) What does each bar represent?

2.) How many students earned a grade between 80 and 100?


                                                                       7
Anticipatory Set: Mr. Snowden ordered the grades his students 
earned on a test.  Using these numbers, he created a histogram by 
grouping the grades into 60’s, 70’s, 80’s, and 90’s.
  67 71 75 75 76 78 79 80 80 80 81 83 84 84 85 85 85 85 88 92


 3.) Describe the similarities between bar graphs and histograms?

         Similarities                   Differences


                                                                     8
1.) Create a histogram based on the following frequency table
which show different coaches monthly practice times.


Number of Hours   Frequency

   1-5              10
   6-10             23
   11-15            14
   16-20            9


                                                                9
1.) Create a histogram based on the following frequency table
which show grades on the last exam.


 Grade Ranges   Frequency

   50-59             2
   60-69             5
   70-79             8
    80-89            10
    90-100            7


                                                                10
3.)  In which situation would you use a histogram to display data?  Explain.
      A to show how you spend money
      B to show the change in temperature throughout the day 
      C to show the golf scores from the whole team
      D to show the life expectancy of different animals


4.)  In which situation would you use a bar graph to display data?  Explain.
      F to compare the speed of different computers
      G to show how a cat spends its time
      H to show how a child’s height changes as he or she grows
      J to show the distribution of math grades in your class


                                                                               11
Pictographs: are drawings or pictures that represent a word,
sound or idea. Pictographs are used to represent numerical data in
a statistical or financial graph, with each value represented by the
size of pictures.
                                  6.) How much would you save on a
                                  15 minute weekday call by using
                                  UniDial Unity instead of using
                                  AT&T True Savings?


                                7.) Describe the differences in
                                the dollar bills between the
                                different companies?


                                8.) Which graph does this graph
                                resemble from previous classes?
                                Why?


                                                                       12
13
BEFORE YOU LEAVE


Describe a situation where a histogram would be
the best way to display the data involved in the
situation.


                                                   14
Before You Leave
      Below is a Mesopotamian pictograph.


1.) What do you think the Mesopotamian that
created this pictograph was trying to display?


                                                 15
Mr. Tjersland's Math 7


Homework: 1.) Page 23 #12-14 all


          Graph Paper link on Blog


                                     16

Weitere ähnliche Inhalte

Ähnlich wie Day 8 histogram and pictograph

HUM105 v7Divine Roles Across CulturesHUM105 v7Page 2 of 2D
HUM105 v7Divine Roles Across CulturesHUM105 v7Page 2 of 2DHUM105 v7Divine Roles Across CulturesHUM105 v7Page 2 of 2D
HUM105 v7Divine Roles Across CulturesHUM105 v7Page 2 of 2Deve2xjazwa
 
Graphing Practice
Graphing PracticeGraphing Practice
Graphing Practicejrt004
 
Graphing Practice
Graphing PracticeGraphing Practice
Graphing Practicejrt004
 
6.7 scatter plots and line of best fit
6.7 scatter plots and line of best fit6.7 scatter plots and line of best fit
6.7 scatter plots and line of best fitMsKendall
 
Graphing Practice
Graphing  PracticeGraphing  Practice
Graphing PracticeJoe McClung
 
Math stations
Math stationsMath stations
Math stationsKim Izsak
 
Graphing Practice
Graphing  PracticeGraphing  Practice
Graphing PracticeJoe McClung
 
Exer chp1 2
Exer chp1 2Exer chp1 2
Exer chp1 2IIUM
 
STAT 200 Final ExaminationFall 2016 OL3Page 4 of 9Answer all 2.docx
STAT 200 Final ExaminationFall 2016 OL3Page 4 of 9Answer all 2.docxSTAT 200 Final ExaminationFall 2016 OL3Page 4 of 9Answer all 2.docx
STAT 200 Final ExaminationFall 2016 OL3Page 4 of 9Answer all 2.docxwhitneyleman54422
 
Math 221 Massive Success / snaptutorial.com
Math 221 Massive Success / snaptutorial.comMath 221 Massive Success / snaptutorial.com
Math 221 Massive Success / snaptutorial.comStephenson164
 
Lecture 01 (Mean, Median, Mode).pdf
Lecture 01 (Mean, Median, Mode).pdfLecture 01 (Mean, Median, Mode).pdf
Lecture 01 (Mean, Median, Mode).pdfSirRafiLectures
 
MATH 106 QUIZ 6NAME _____ _________________ Professor Dr. K.docx
MATH 106 QUIZ 6NAME _____ _________________  Professor Dr. K.docxMATH 106 QUIZ 6NAME _____ _________________  Professor Dr. K.docx
MATH 106 QUIZ 6NAME _____ _________________ Professor Dr. K.docxandreecapon
 
THIRD QUARTER ASSESSMENT TEST.docx
THIRD QUARTER ASSESSMENT TEST.docxTHIRD QUARTER ASSESSMENT TEST.docx
THIRD QUARTER ASSESSMENT TEST.docxCeciliaTolentino3
 
De vry math 221 all ilabs latest 2016 november
De vry math 221 all ilabs latest 2016 novemberDe vry math 221 all ilabs latest 2016 november
De vry math 221 all ilabs latest 2016 novemberlenasour
 
De vry math 399 all ilabs latest 2016 november
De vry math 399 all ilabs latest 2016 novemberDe vry math 399 all ilabs latest 2016 november
De vry math 399 all ilabs latest 2016 novemberlenasour
 
De vry math221 all ilabs latest 2016 november
De vry math221 all ilabs latest 2016 novemberDe vry math221 all ilabs latest 2016 november
De vry math221 all ilabs latest 2016 novemberlenasour
 

Ähnlich wie Day 8 histogram and pictograph (20)

Math Module Sample
Math Module SampleMath Module Sample
Math Module Sample
 
Practive test 1
Practive test 1Practive test 1
Practive test 1
 
HUM105 v7Divine Roles Across CulturesHUM105 v7Page 2 of 2D
HUM105 v7Divine Roles Across CulturesHUM105 v7Page 2 of 2DHUM105 v7Divine Roles Across CulturesHUM105 v7Page 2 of 2D
HUM105 v7Divine Roles Across CulturesHUM105 v7Page 2 of 2D
 
Graphing Practice
Graphing PracticeGraphing Practice
Graphing Practice
 
Graphing Practice
Graphing PracticeGraphing Practice
Graphing Practice
 
6.7 scatter plots and line of best fit
6.7 scatter plots and line of best fit6.7 scatter plots and line of best fit
6.7 scatter plots and line of best fit
 
Graphing Practice
Graphing  PracticeGraphing  Practice
Graphing Practice
 
Math stations
Math stationsMath stations
Math stations
 
Graphing Practice
Graphing  PracticeGraphing  Practice
Graphing Practice
 
Exer chp1 2
Exer chp1 2Exer chp1 2
Exer chp1 2
 
G4ww1 4
G4ww1 4G4ww1 4
G4ww1 4
 
STAT 200 Final ExaminationFall 2016 OL3Page 4 of 9Answer all 2.docx
STAT 200 Final ExaminationFall 2016 OL3Page 4 of 9Answer all 2.docxSTAT 200 Final ExaminationFall 2016 OL3Page 4 of 9Answer all 2.docx
STAT 200 Final ExaminationFall 2016 OL3Page 4 of 9Answer all 2.docx
 
Math 221 Massive Success / snaptutorial.com
Math 221 Massive Success / snaptutorial.comMath 221 Massive Success / snaptutorial.com
Math 221 Massive Success / snaptutorial.com
 
Lecture 01 (Mean, Median, Mode).pdf
Lecture 01 (Mean, Median, Mode).pdfLecture 01 (Mean, Median, Mode).pdf
Lecture 01 (Mean, Median, Mode).pdf
 
MATH 106 QUIZ 6NAME _____ _________________ Professor Dr. K.docx
MATH 106 QUIZ 6NAME _____ _________________  Professor Dr. K.docxMATH 106 QUIZ 6NAME _____ _________________  Professor Dr. K.docx
MATH 106 QUIZ 6NAME _____ _________________ Professor Dr. K.docx
 
THIRD QUARTER ASSESSMENT TEST.docx
THIRD QUARTER ASSESSMENT TEST.docxTHIRD QUARTER ASSESSMENT TEST.docx
THIRD QUARTER ASSESSMENT TEST.docx
 
De vry math 221 all ilabs latest 2016 november
De vry math 221 all ilabs latest 2016 novemberDe vry math 221 all ilabs latest 2016 november
De vry math 221 all ilabs latest 2016 november
 
De vry math 399 all ilabs latest 2016 november
De vry math 399 all ilabs latest 2016 novemberDe vry math 399 all ilabs latest 2016 november
De vry math 399 all ilabs latest 2016 november
 
De vry math221 all ilabs latest 2016 november
De vry math221 all ilabs latest 2016 novemberDe vry math221 all ilabs latest 2016 november
De vry math221 all ilabs latest 2016 november
 
C24
C24C24
C24
 

Mehr von Erik Tjersland

Linear equations lesson 8 day 2 graphing linear equations
Linear equations lesson 8 day 2 graphing linear equationsLinear equations lesson 8 day 2 graphing linear equations
Linear equations lesson 8 day 2 graphing linear equationsErik Tjersland
 
Linear equations lesson 8 day 1 graphing linear equations
Linear equations lesson 8 day 1 graphing linear equationsLinear equations lesson 8 day 1 graphing linear equations
Linear equations lesson 8 day 1 graphing linear equationsErik Tjersland
 
Linear equations lesson 7 slope formula
Linear equations lesson 7 slope formulaLinear equations lesson 7 slope formula
Linear equations lesson 7 slope formulaErik Tjersland
 
Module 4.5 lesson 10 scale area
Module 4.5 lesson 10 scale areaModule 4.5 lesson 10 scale area
Module 4.5 lesson 10 scale areaErik Tjersland
 
Module 4.5 lesson 9 computing actual lengths
Module 4.5 lesson 9 computing actual lengthsModule 4.5 lesson 9 computing actual lengths
Module 4.5 lesson 9 computing actual lengthsErik Tjersland
 
Linear equations lesson 6 slope
Linear equations lesson 6 slopeLinear equations lesson 6 slope
Linear equations lesson 6 slopeErik Tjersland
 
Module 4.5 lesson 7 scale factor as a percent
Module 4.5 lesson 7 scale factor as a percentModule 4.5 lesson 7 scale factor as a percent
Module 4.5 lesson 7 scale factor as a percentErik Tjersland
 
Module 4.5 lesson 6 scale map
Module 4.5 lesson 6 scale mapModule 4.5 lesson 6 scale map
Module 4.5 lesson 6 scale mapErik Tjersland
 
Linear equations lesson 5 horizontal and vertical lines
Linear equations lesson 5 horizontal and vertical linesLinear equations lesson 5 horizontal and vertical lines
Linear equations lesson 5 horizontal and vertical linesErik Tjersland
 
Module 4.5 lesson 4 scale area problems
Module 4.5 lesson 4 scale area problemsModule 4.5 lesson 4 scale area problems
Module 4.5 lesson 4 scale area problemsErik Tjersland
 
Module 4.5 lesson 3 computing actual lengths from scale drawings
Module 4.5 lesson 3 computing actual lengths from scale drawingsModule 4.5 lesson 3 computing actual lengths from scale drawings
Module 4.5 lesson 3 computing actual lengths from scale drawingsErik Tjersland
 
Module 4.5 lesson 2 unit rate as the scale factor
Module 4.5 lesson 2 unit rate as the scale factorModule 4.5 lesson 2 unit rate as the scale factor
Module 4.5 lesson 2 unit rate as the scale factorErik Tjersland
 
Linear equations lesson 4 graphing linear equations
Linear equations lesson 4 graphing linear equationsLinear equations lesson 4 graphing linear equations
Linear equations lesson 4 graphing linear equationsErik Tjersland
 
Module 4.5 lesson 1 scale drawings
Module 4.5 lesson 1 scale drawingsModule 4.5 lesson 1 scale drawings
Module 4.5 lesson 1 scale drawingsErik Tjersland
 
Review for module 4 exam
Review for module 4 examReview for module 4 exam
Review for module 4 examErik Tjersland
 
Linear equations lesson 3 consecutive integers
Linear equations lesson 3 consecutive integersLinear equations lesson 3 consecutive integers
Linear equations lesson 3 consecutive integersErik Tjersland
 
14 mixed review with percents with answers
14   mixed review with percents with answers14   mixed review with percents with answers
14 mixed review with percents with answersErik Tjersland
 
Module 4 lesson 12 relative error
Module 4 lesson 12 relative errorModule 4 lesson 12 relative error
Module 4 lesson 12 relative errorErik Tjersland
 
Linear equations lesson 2 geometric word problems
Linear equations lesson 2 geometric word problemsLinear equations lesson 2 geometric word problems
Linear equations lesson 2 geometric word problemsErik Tjersland
 

Mehr von Erik Tjersland (20)

Linear equations lesson 8 day 2 graphing linear equations
Linear equations lesson 8 day 2 graphing linear equationsLinear equations lesson 8 day 2 graphing linear equations
Linear equations lesson 8 day 2 graphing linear equations
 
Linear equations lesson 8 day 1 graphing linear equations
Linear equations lesson 8 day 1 graphing linear equationsLinear equations lesson 8 day 1 graphing linear equations
Linear equations lesson 8 day 1 graphing linear equations
 
Linear equations lesson 7 slope formula
Linear equations lesson 7 slope formulaLinear equations lesson 7 slope formula
Linear equations lesson 7 slope formula
 
Module 4.5 lesson 10 scale area
Module 4.5 lesson 10 scale areaModule 4.5 lesson 10 scale area
Module 4.5 lesson 10 scale area
 
Module 4.5 lesson 9 computing actual lengths
Module 4.5 lesson 9 computing actual lengthsModule 4.5 lesson 9 computing actual lengths
Module 4.5 lesson 9 computing actual lengths
 
Linear equations lesson 6 slope
Linear equations lesson 6 slopeLinear equations lesson 6 slope
Linear equations lesson 6 slope
 
Module 4.5 lesson 7 scale factor as a percent
Module 4.5 lesson 7 scale factor as a percentModule 4.5 lesson 7 scale factor as a percent
Module 4.5 lesson 7 scale factor as a percent
 
Module 4.5 lesson 6 scale map
Module 4.5 lesson 6 scale mapModule 4.5 lesson 6 scale map
Module 4.5 lesson 6 scale map
 
Linear equations lesson 5 horizontal and vertical lines
Linear equations lesson 5 horizontal and vertical linesLinear equations lesson 5 horizontal and vertical lines
Linear equations lesson 5 horizontal and vertical lines
 
Module 4.5 lesson 4 scale area problems
Module 4.5 lesson 4 scale area problemsModule 4.5 lesson 4 scale area problems
Module 4.5 lesson 4 scale area problems
 
Module 4.5 lesson 3 computing actual lengths from scale drawings
Module 4.5 lesson 3 computing actual lengths from scale drawingsModule 4.5 lesson 3 computing actual lengths from scale drawings
Module 4.5 lesson 3 computing actual lengths from scale drawings
 
Module 4.5 lesson 2 unit rate as the scale factor
Module 4.5 lesson 2 unit rate as the scale factorModule 4.5 lesson 2 unit rate as the scale factor
Module 4.5 lesson 2 unit rate as the scale factor
 
Linear equations lesson 4 graphing linear equations
Linear equations lesson 4 graphing linear equationsLinear equations lesson 4 graphing linear equations
Linear equations lesson 4 graphing linear equations
 
Module 4.5 lesson 1 scale drawings
Module 4.5 lesson 1 scale drawingsModule 4.5 lesson 1 scale drawings
Module 4.5 lesson 1 scale drawings
 
Review for module 4 exam
Review for module 4 examReview for module 4 exam
Review for module 4 exam
 
Linear equations lesson 3 consecutive integers
Linear equations lesson 3 consecutive integersLinear equations lesson 3 consecutive integers
Linear equations lesson 3 consecutive integers
 
14 mixed review with percents with answers
14   mixed review with percents with answers14   mixed review with percents with answers
14 mixed review with percents with answers
 
Module 4 lesson 13
Module 4 lesson 13Module 4 lesson 13
Module 4 lesson 13
 
Module 4 lesson 12 relative error
Module 4 lesson 12 relative errorModule 4 lesson 12 relative error
Module 4 lesson 12 relative error
 
Linear equations lesson 2 geometric word problems
Linear equations lesson 2 geometric word problemsLinear equations lesson 2 geometric word problems
Linear equations lesson 2 geometric word problems
 

Day 8 histogram and pictograph

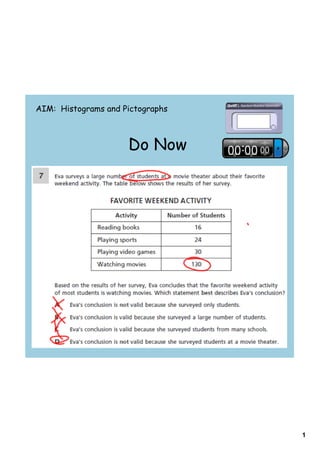
  • 1. AIM: Histograms and Pictographs Do Now 1
  • 2. The table on the left shows the number of hours students watch television in one week. Construct a Frequency Table for the data on the right. 2
  • 3. Anticipatory Set: Mr. Snowden ordered the grades his students  earned on a test.  Using these numbers, he created a histogram by  grouping the grades into 60’s, 70’s, 80’s, and 90’s. 67 71 75 75 76 78 79 80 80 80 81 83 84 84 85 85 85 85 88 92 Answer the questions below the graph based on the data. 1.) What does each bar represent? 2.) How many students earned a grade between 80 and 100? 3
  • 4. Anticipatory Set: Mr. Snowden ordered the grades his students  earned on a test.  Using these numbers, he created a histogram by  grouping the grades into 60’s, 70’s, 80’s, and 90’s. 67 71 75 75 76 78 79 80 80 80 81 83 84 84 85 85 85 85 88 92 Answer the questions below the graph based on the data. 1.) What does each bar represent? 2.) How many students earned a grade between 80 and 100? 4
  • 5. Anticipatory Set: Mr. Snowden ordered the grades his students  earned on a test.  Using these numbers, he created a histogram by  grouping the grades into 60’s, 70’s, 80’s, and 90’s. 67 71 75 75 76 78 79 80 80 80 81 83 84 84 85 85 85 85 88 92 Answer the questions below the graph based on the data. 1.) What does each bar represent? 2.) How many students earned a grade between 80 and 100? 5
  • 6. Anticipatory Set: Mr. Snowden ordered the grades his students  earned on a test.  Using these numbers, he created a histogram by  grouping the grades into 60’s, 70’s, 80’s, and 90’s. 67 71 75 75 76 78 79 80 80 80 81 83 84 84 85 85 85 85 88 92 Answer the questions below the graph based on the data. 1.) What does each bar represent? 2.) How many students earned a grade between 80 and 100? 6
  • 7. Anticipatory Set: Mr. Snowden ordered the grades his students  earned on a test.  Using these numbers, he created a histogram by  grouping the grades into 60’s, 70’s, 80’s, and 90’s. 67 71 75 75 76 78 79 80 80 80 81 83 84 84 85 85 85 85 88 92 Answer the questions below the graph based on the data. 1.) What does each bar represent? 2.) How many students earned a grade between 80 and 100? 7
  • 8. Anticipatory Set: Mr. Snowden ordered the grades his students  earned on a test.  Using these numbers, he created a histogram by  grouping the grades into 60’s, 70’s, 80’s, and 90’s. 67 71 75 75 76 78 79 80 80 80 81 83 84 84 85 85 85 85 88 92 3.) Describe the similarities between bar graphs and histograms? Similarities Differences 8
  • 9. 1.) Create a histogram based on the following frequency table which show different coaches monthly practice times. Number of Hours Frequency 1-5 10 6-10 23 11-15 14 16-20 9 9
  • 10. 1.) Create a histogram based on the following frequency table which show grades on the last exam. Grade Ranges Frequency 50-59 2 60-69 5 70-79 8 80-89 10 90-100 7 10
  • 11. 3.)  In which situation would you use a histogram to display data?  Explain. A to show how you spend money B to show the change in temperature throughout the day  C to show the golf scores from the whole team D to show the life expectancy of different animals 4.)  In which situation would you use a bar graph to display data?  Explain. F to compare the speed of different computers G to show how a cat spends its time H to show how a child’s height changes as he or she grows J to show the distribution of math grades in your class 11
  • 12. Pictographs: are drawings or pictures that represent a word, sound or idea. Pictographs are used to represent numerical data in a statistical or financial graph, with each value represented by the size of pictures. 6.) How much would you save on a 15 minute weekday call by using UniDial Unity instead of using AT&T True Savings? 7.) Describe the differences in the dollar bills between the different companies? 8.) Which graph does this graph resemble from previous classes? Why? 12
  • 13. 13
  • 14. BEFORE YOU LEAVE Describe a situation where a histogram would be the best way to display the data involved in the situation. 14
  • 15. Before You Leave Below is a Mesopotamian pictograph. 1.) What do you think the Mesopotamian that created this pictograph was trying to display? 15
  • 16. Mr. Tjersland's Math 7 Homework: 1.) Page 23 #12-14 all Graph Paper link on Blog 16