SlideShare ist ein Scribd-Unternehmen logo
1 von 11
AIM: Most Appropriate Measure
of Central Tendency
                     Do Now


                                1
2
AIM: Most Appropriate Measure
of Central Tendency
                             Do Now

    The table below shows the leading shot blockers in the
    WNBA during the 2001 season.
                 Player              Shots Blocked

              Vicky Bullet               58
             Margo Drydek                 113
              Lauren Jackson             64
               Lisa Leslie                71
             Maria Stepanoya             64

  1.) Read the following definition:
       Outlier: A value that is much less or much more than the
  other values.

  2.) Based on that definition, what is the outlier in the Shots
  Blocked data set?


                                                                   3
Anticipatory Set
    We will now explore the affect of the outlier on the
    measures of central tendency.

                  Player                  Shots Blocked

                Vicky Bullet                  58
               Margo Drydek                   113
               Lauren Jackson                 64
                Lisa Leslie                   71
              Maria Stepanoya                 64

         With Outlier                      Without Outlier

Data Set:      58 6464                              58 64
                       71 113
                                     Data Set:
                                                          64 71

 Measures of Central Tendency:       Measures of Central Tendency:


  1.) How does the outlier affect the mean and median of the data?


  2.) Which is the most appropriate measure of central tendency?


                                                                     4
5
Think-Pair-Share Activity:
1.) The data shows Sara‛s scores for the last 5 math tests:
               ,    ,      ,    ,
                88 90 55 94 89


       a.) What is the outlier?
       b.) What is the mean and median with the outlier?

               88   89
         55               90   94

       c.) What is the mean and median without the outlier?

              88    89
                         90    94
      d.) How does the outlier affect the mean and median of the
      data?


     e.) Which is the most appropriate measure of central
     tendency?


                                                                   6
2.) For the following data sets, select whether the mean or the
median would be the most appropriate measure of central tendency.
Provide a reason.

         a.) 50, 52, 60, 58, 54, 55


         b.) 7, 4, 30, 9, 5, 2


         c.) -60, -58, 65, -62, -59, -55


         d.) -2, 1, 0, -4, -3, 5, 2


        e.) Pizza, Hamburger, Chicken, Pizza, Pizza


                                                                    7
2.) For the following data sets, select whether the mean or the
median would be the most appropriate measure of central tendency.
Provide a reason.


       a.) 50, 52, 60, 58, 54, 55          Mean, no outlier


       b.) 7, 4, 30, 9, 5, 2              Median, outlier present


       c.) -60, -58, 65, -62, -59, -55       Median, outlier present


       d.) -2, 1, 0, -4, -3, 5, 2         Mean, no outlier


       e.) Pizza, Hamburger, Chicken, Pizza, Pizza
                                    Mode, data is not numerical


                                                                       8
BEFORE YOU LEAVE:
1.) Create a data set below.


2.) Trade your sheet with your partner.

3.) Would the mean or the median better represents the data
set and provide an explanation.


                                                              9
Mr. Tjersland's Math 7


Homework: Castle Homework due Friday


                                       10
AIM: Most Appropriate Measure
of Central Tendency


          Outlier: A value that is much less or much
          more than the other values.


2.) For the following data sets, select whether the mean or the
median would be the most appropriate measure of central tendency.
Provide a reason.
         a.) 50, 52, 60, 58, 54, 55         Mean, no outlier


         b.) 7, 4, 30, 9, 5, 2             Median, outlier present


         c.) -60, -58, 65, -62, -59, -55      Median, outlier present


         d.) -2, 1, 0, -4, -3, 5, 2        Mean, no outlier


           e.) Pizza, Hamburger, Chicken, Pizza, Pizza


                               Mode, data is not numerical


                                                                        11

Weitere ähnliche Inhalte

Andere mochten auch

Day 9 factoring with gcf
Day 9 factoring with gcfDay 9 factoring with gcf
Day 9 factoring with gcf
Erik Tjersland
 
Day 10 two step translate
Day 10 two step translateDay 10 two step translate
Day 10 two step translate
Erik Tjersland
 
Day 3 graphing linear equations
Day 3 graphing linear equationsDay 3 graphing linear equations
Day 3 graphing linear equations
Erik Tjersland
 
Day 7 multiply binomials
Day 7 multiply binomialsDay 7 multiply binomials
Day 7 multiply binomials
Erik Tjersland
 
Day 14 simple interest
Day 14 simple interestDay 14 simple interest
Day 14 simple interest
Erik Tjersland
 
Day 3 subtracting integers
Day 3 subtracting integersDay 3 subtracting integers
Day 3 subtracting integers
Erik Tjersland
 
Day 12 gcf lcm word problems
Day 12 gcf lcm word problemsDay 12 gcf lcm word problems
Day 12 gcf lcm word problems
Erik Tjersland
 
Day 3 metric and customary assessment
Day 3 metric and customary assessmentDay 3 metric and customary assessment
Day 3 metric and customary assessment
Erik Tjersland
 
Day 13 mark up and discount
Day 13 mark up and discountDay 13 mark up and discount
Day 13 mark up and discount
Erik Tjersland
 
Station activity for exam 2
Station activity for exam 2Station activity for exam 2
Station activity for exam 2
Erik Tjersland
 

Andere mochten auch (15)

Day 8 scale
Day 8 scaleDay 8 scale
Day 8 scale
 
Day 9 factoring with gcf
Day 9 factoring with gcfDay 9 factoring with gcf
Day 9 factoring with gcf
 
Day 10 two step translate
Day 10 two step translateDay 10 two step translate
Day 10 two step translate
 
Day 3 graphing linear equations
Day 3 graphing linear equationsDay 3 graphing linear equations
Day 3 graphing linear equations
 
Day 7 multiply binomials
Day 7 multiply binomialsDay 7 multiply binomials
Day 7 multiply binomials
 
Day 14 simple interest
Day 14 simple interestDay 14 simple interest
Day 14 simple interest
 
Day 3 subtracting integers
Day 3 subtracting integersDay 3 subtracting integers
Day 3 subtracting integers
 
Day 3 sample space
Day 3 sample spaceDay 3 sample space
Day 3 sample space
 
Day 12 gcf lcm word problems
Day 12 gcf lcm word problemsDay 12 gcf lcm word problems
Day 12 gcf lcm word problems
 
Day 3 metric and customary assessment
Day 3 metric and customary assessmentDay 3 metric and customary assessment
Day 3 metric and customary assessment
 
Day 10 Intro To 3 D
Day 10 Intro To 3 DDay 10 Intro To 3 D
Day 10 Intro To 3 D
 
Area of circles
Area of circlesArea of circles
Area of circles
 
Day 13 mark up and discount
Day 13 mark up and discountDay 13 mark up and discount
Day 13 mark up and discount
 
Station activity for exam 2
Station activity for exam 2Station activity for exam 2
Station activity for exam 2
 
Day 16 station review
Day 16 station reviewDay 16 station review
Day 16 station review
 

Ähnlich wie Day 4 measures of central tendency

Notes 7
Notes 7Notes 7
Notes 7
butest
 
Ashford 2 - Week 1 - Instructor GuidanceWeek OverviewThe f.docx
Ashford 2 - Week 1 - Instructor GuidanceWeek OverviewThe f.docxAshford 2 - Week 1 - Instructor GuidanceWeek OverviewThe f.docx
Ashford 2 - Week 1 - Instructor GuidanceWeek OverviewThe f.docx
fredharris32
 
2012 2013 3rd 9 weeks midterm review
2012 2013 3rd 9 weeks midterm review2012 2013 3rd 9 weeks midterm review
2012 2013 3rd 9 weeks midterm review
arinedge
 
1. According to the empirical rules, approximately 99.7 of the ob.docx
1. According to the empirical rules, approximately 99.7 of the ob.docx1. According to the empirical rules, approximately 99.7 of the ob.docx
1. According to the empirical rules, approximately 99.7 of the ob.docx
hyacinthshackley2629
 

Ähnlich wie Day 4 measures of central tendency (19)

Applied Math 40S March 12, 2008
Applied Math 40S March 12, 2008Applied Math 40S March 12, 2008
Applied Math 40S March 12, 2008
 
Applied 40S March 23, 2009
Applied 40S March 23, 2009Applied 40S March 23, 2009
Applied 40S March 23, 2009
 
Lect 3 background mathematics for Data Mining
Lect 3 background mathematics for Data MiningLect 3 background mathematics for Data Mining
Lect 3 background mathematics for Data Mining
 
Statistics101: Numerical Measures
Statistics101: Numerical MeasuresStatistics101: Numerical Measures
Statistics101: Numerical Measures
 
Applied Math 40S March 14, 2008
Applied Math 40S March 14, 2008Applied Math 40S March 14, 2008
Applied Math 40S March 14, 2008
 
Lect 3 background mathematics
Lect 3 background mathematicsLect 3 background mathematics
Lect 3 background mathematics
 
Applied 40S March 20, 2009
Applied 40S March 20, 2009Applied 40S March 20, 2009
Applied 40S March 20, 2009
 
ME SP 11 Q3 0302 PS.pptx statistics and probability
ME SP 11 Q3 0302 PS.pptx statistics and probabilityME SP 11 Q3 0302 PS.pptx statistics and probability
ME SP 11 Q3 0302 PS.pptx statistics and probability
 
Integrated Math 2 Section 1-2
Integrated Math 2 Section 1-2Integrated Math 2 Section 1-2
Integrated Math 2 Section 1-2
 
POINT_INTERVAL_estimates.ppt
POINT_INTERVAL_estimates.pptPOINT_INTERVAL_estimates.ppt
POINT_INTERVAL_estimates.ppt
 
StatVignette05_M3_v02_10_21_2020.pptx
StatVignette05_M3_v02_10_21_2020.pptxStatVignette05_M3_v02_10_21_2020.pptx
StatVignette05_M3_v02_10_21_2020.pptx
 
Practice Test 1
Practice Test 1Practice Test 1
Practice Test 1
 
Notes 7
Notes 7Notes 7
Notes 7
 
Statistics
StatisticsStatistics
Statistics
 
Two Means Independent Samples
Two Means Independent Samples  Two Means Independent Samples
Two Means Independent Samples
 
Ashford 2 - Week 1 - Instructor GuidanceWeek OverviewThe f.docx
Ashford 2 - Week 1 - Instructor GuidanceWeek OverviewThe f.docxAshford 2 - Week 1 - Instructor GuidanceWeek OverviewThe f.docx
Ashford 2 - Week 1 - Instructor GuidanceWeek OverviewThe f.docx
 
Measures of central tendency
Measures of central tendencyMeasures of central tendency
Measures of central tendency
 
2012 2013 3rd 9 weeks midterm review
2012 2013 3rd 9 weeks midterm review2012 2013 3rd 9 weeks midterm review
2012 2013 3rd 9 weeks midterm review
 
1. According to the empirical rules, approximately 99.7 of the ob.docx
1. According to the empirical rules, approximately 99.7 of the ob.docx1. According to the empirical rules, approximately 99.7 of the ob.docx
1. According to the empirical rules, approximately 99.7 of the ob.docx
 

Mehr von Erik Tjersland

Linear equations lesson 8 day 2 graphing linear equations
Linear equations lesson 8 day 2 graphing linear equationsLinear equations lesson 8 day 2 graphing linear equations
Linear equations lesson 8 day 2 graphing linear equations
Erik Tjersland
 
Linear equations lesson 8 day 1 graphing linear equations
Linear equations lesson 8 day 1 graphing linear equationsLinear equations lesson 8 day 1 graphing linear equations
Linear equations lesson 8 day 1 graphing linear equations
Erik Tjersland
 
Linear equations lesson 7 slope formula
Linear equations lesson 7 slope formulaLinear equations lesson 7 slope formula
Linear equations lesson 7 slope formula
Erik Tjersland
 
Module 4.5 lesson 9 computing actual lengths
Module 4.5 lesson 9 computing actual lengthsModule 4.5 lesson 9 computing actual lengths
Module 4.5 lesson 9 computing actual lengths
Erik Tjersland
 
Module 4.5 lesson 7 scale factor as a percent
Module 4.5 lesson 7 scale factor as a percentModule 4.5 lesson 7 scale factor as a percent
Module 4.5 lesson 7 scale factor as a percent
Erik Tjersland
 
Linear equations lesson 5 horizontal and vertical lines
Linear equations lesson 5 horizontal and vertical linesLinear equations lesson 5 horizontal and vertical lines
Linear equations lesson 5 horizontal and vertical lines
Erik Tjersland
 
Module 4.5 lesson 4 scale area problems
Module 4.5 lesson 4 scale area problemsModule 4.5 lesson 4 scale area problems
Module 4.5 lesson 4 scale area problems
Erik Tjersland
 
Module 4.5 lesson 3 computing actual lengths from scale drawings
Module 4.5 lesson 3 computing actual lengths from scale drawingsModule 4.5 lesson 3 computing actual lengths from scale drawings
Module 4.5 lesson 3 computing actual lengths from scale drawings
Erik Tjersland
 
Module 4.5 lesson 2 unit rate as the scale factor
Module 4.5 lesson 2 unit rate as the scale factorModule 4.5 lesson 2 unit rate as the scale factor
Module 4.5 lesson 2 unit rate as the scale factor
Erik Tjersland
 
Linear equations lesson 4 graphing linear equations
Linear equations lesson 4 graphing linear equationsLinear equations lesson 4 graphing linear equations
Linear equations lesson 4 graphing linear equations
Erik Tjersland
 
Module 4.5 lesson 1 scale drawings
Module 4.5 lesson 1 scale drawingsModule 4.5 lesson 1 scale drawings
Module 4.5 lesson 1 scale drawings
Erik Tjersland
 
Linear equations lesson 3 consecutive integers
Linear equations lesson 3 consecutive integersLinear equations lesson 3 consecutive integers
Linear equations lesson 3 consecutive integers
Erik Tjersland
 
14 mixed review with percents with answers
14   mixed review with percents with answers14   mixed review with percents with answers
14 mixed review with percents with answers
Erik Tjersland
 
Module 4 lesson 12 relative error
Module 4 lesson 12 relative errorModule 4 lesson 12 relative error
Module 4 lesson 12 relative error
Erik Tjersland
 
Linear equations lesson 2 geometric word problems
Linear equations lesson 2 geometric word problemsLinear equations lesson 2 geometric word problems
Linear equations lesson 2 geometric word problems
Erik Tjersland
 

Mehr von Erik Tjersland (20)

Linear equations lesson 8 day 2 graphing linear equations
Linear equations lesson 8 day 2 graphing linear equationsLinear equations lesson 8 day 2 graphing linear equations
Linear equations lesson 8 day 2 graphing linear equations
 
Linear equations lesson 8 day 1 graphing linear equations
Linear equations lesson 8 day 1 graphing linear equationsLinear equations lesson 8 day 1 graphing linear equations
Linear equations lesson 8 day 1 graphing linear equations
 
Linear equations lesson 7 slope formula
Linear equations lesson 7 slope formulaLinear equations lesson 7 slope formula
Linear equations lesson 7 slope formula
 
Module 4.5 lesson 10 scale area
Module 4.5 lesson 10 scale areaModule 4.5 lesson 10 scale area
Module 4.5 lesson 10 scale area
 
Module 4.5 lesson 9 computing actual lengths
Module 4.5 lesson 9 computing actual lengthsModule 4.5 lesson 9 computing actual lengths
Module 4.5 lesson 9 computing actual lengths
 
Linear equations lesson 6 slope
Linear equations lesson 6 slopeLinear equations lesson 6 slope
Linear equations lesson 6 slope
 
Module 4.5 lesson 7 scale factor as a percent
Module 4.5 lesson 7 scale factor as a percentModule 4.5 lesson 7 scale factor as a percent
Module 4.5 lesson 7 scale factor as a percent
 
Module 4.5 lesson 6 scale map
Module 4.5 lesson 6 scale mapModule 4.5 lesson 6 scale map
Module 4.5 lesson 6 scale map
 
Linear equations lesson 5 horizontal and vertical lines
Linear equations lesson 5 horizontal and vertical linesLinear equations lesson 5 horizontal and vertical lines
Linear equations lesson 5 horizontal and vertical lines
 
Module 4.5 lesson 4 scale area problems
Module 4.5 lesson 4 scale area problemsModule 4.5 lesson 4 scale area problems
Module 4.5 lesson 4 scale area problems
 
Module 4.5 lesson 3 computing actual lengths from scale drawings
Module 4.5 lesson 3 computing actual lengths from scale drawingsModule 4.5 lesson 3 computing actual lengths from scale drawings
Module 4.5 lesson 3 computing actual lengths from scale drawings
 
Module 4.5 lesson 2 unit rate as the scale factor
Module 4.5 lesson 2 unit rate as the scale factorModule 4.5 lesson 2 unit rate as the scale factor
Module 4.5 lesson 2 unit rate as the scale factor
 
Linear equations lesson 4 graphing linear equations
Linear equations lesson 4 graphing linear equationsLinear equations lesson 4 graphing linear equations
Linear equations lesson 4 graphing linear equations
 
Module 4.5 lesson 1 scale drawings
Module 4.5 lesson 1 scale drawingsModule 4.5 lesson 1 scale drawings
Module 4.5 lesson 1 scale drawings
 
Review for module 4 exam
Review for module 4 examReview for module 4 exam
Review for module 4 exam
 
Linear equations lesson 3 consecutive integers
Linear equations lesson 3 consecutive integersLinear equations lesson 3 consecutive integers
Linear equations lesson 3 consecutive integers
 
14 mixed review with percents with answers
14   mixed review with percents with answers14   mixed review with percents with answers
14 mixed review with percents with answers
 
Module 4 lesson 13
Module 4 lesson 13Module 4 lesson 13
Module 4 lesson 13
 
Module 4 lesson 12 relative error
Module 4 lesson 12 relative errorModule 4 lesson 12 relative error
Module 4 lesson 12 relative error
 
Linear equations lesson 2 geometric word problems
Linear equations lesson 2 geometric word problemsLinear equations lesson 2 geometric word problems
Linear equations lesson 2 geometric word problems
 

Day 4 measures of central tendency

  • 1. AIM: Most Appropriate Measure of Central Tendency Do Now 1
  • 2. 2
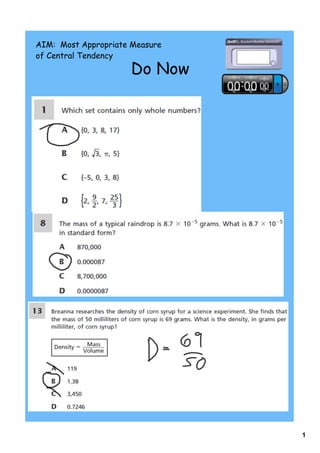
  • 3. AIM: Most Appropriate Measure of Central Tendency Do Now The table below shows the leading shot blockers in the WNBA during the 2001 season. Player Shots Blocked Vicky Bullet 58 Margo Drydek 113 Lauren Jackson 64 Lisa Leslie 71 Maria Stepanoya 64 1.) Read the following definition: Outlier: A value that is much less or much more than the other values. 2.) Based on that definition, what is the outlier in the Shots Blocked data set? 3
  • 4. Anticipatory Set We will now explore the affect of the outlier on the measures of central tendency. Player Shots Blocked Vicky Bullet 58 Margo Drydek 113 Lauren Jackson 64 Lisa Leslie 71 Maria Stepanoya 64 With Outlier Without Outlier Data Set: 58 6464 58 64 71 113 Data Set: 64 71 Measures of Central Tendency: Measures of Central Tendency: 1.) How does the outlier affect the mean and median of the data? 2.) Which is the most appropriate measure of central tendency? 4
  • 5. 5
  • 6. Think-Pair-Share Activity: 1.) The data shows Sara‛s scores for the last 5 math tests: , , , , 88 90 55 94 89 a.) What is the outlier? b.) What is the mean and median with the outlier? 88 89 55 90 94 c.) What is the mean and median without the outlier? 88 89 90 94 d.) How does the outlier affect the mean and median of the data? e.) Which is the most appropriate measure of central tendency? 6
  • 7. 2.) For the following data sets, select whether the mean or the median would be the most appropriate measure of central tendency. Provide a reason. a.) 50, 52, 60, 58, 54, 55 b.) 7, 4, 30, 9, 5, 2 c.) -60, -58, 65, -62, -59, -55 d.) -2, 1, 0, -4, -3, 5, 2 e.) Pizza, Hamburger, Chicken, Pizza, Pizza 7
  • 8. 2.) For the following data sets, select whether the mean or the median would be the most appropriate measure of central tendency. Provide a reason. a.) 50, 52, 60, 58, 54, 55 Mean, no outlier b.) 7, 4, 30, 9, 5, 2 Median, outlier present c.) -60, -58, 65, -62, -59, -55 Median, outlier present d.) -2, 1, 0, -4, -3, 5, 2 Mean, no outlier e.) Pizza, Hamburger, Chicken, Pizza, Pizza Mode, data is not numerical 8
  • 9. BEFORE YOU LEAVE: 1.) Create a data set below. 2.) Trade your sheet with your partner. 3.) Would the mean or the median better represents the data set and provide an explanation. 9
  • 10. Mr. Tjersland's Math 7 Homework: Castle Homework due Friday 10
  • 11. AIM: Most Appropriate Measure of Central Tendency Outlier: A value that is much less or much more than the other values. 2.) For the following data sets, select whether the mean or the median would be the most appropriate measure of central tendency. Provide a reason. a.) 50, 52, 60, 58, 54, 55 Mean, no outlier b.) 7, 4, 30, 9, 5, 2 Median, outlier present c.) -60, -58, 65, -62, -59, -55 Median, outlier present d.) -2, 1, 0, -4, -3, 5, 2 Mean, no outlier e.) Pizza, Hamburger, Chicken, Pizza, Pizza Mode, data is not numerical 11