1. ProductProfile
QIAGEN GeneRead DNAseq System for NGS
For PCR-enabled target enrichment and library quantification
The QIAGEN GeneRead DNAseq System enables focused amplification of genes, and subsequent library quantification with
integrated controls that assess sample quality, for next-generation sequencing (NGS). Using multiplex PCR-based target enrichment,
the QIAGEN GeneRead DNAseq Gene Panels increase the efficiency of sequencing efforts by focusing on the genes most relevant
to a specific disease or research area. Integrated within the panels are control amplification primers that target static regions within
the human genome. The QIAGEN GeneRead DNAseq Library Quantification System is a simple, real-time PCR method for library
quantification, which also serves as a quality-control checkpoint to assess whether the sample library can be effectively sequenced.
The QIAGEN GeneRead DNAseq System for NGS provides:
JJ Enrichment
JJ Integrated
JJ Free
to enable ultra-deep sequencing of disease-relevant genes
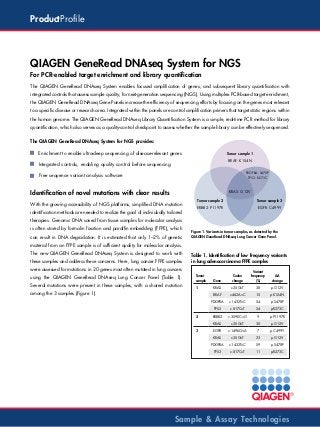
Tumor sample 1
BRAF: K154N
controls, enabling quality control before sequencing
PDGFRA: S478P
TP53: R273C
sequence variant analysis software
Identification of novel mutations with clear results
KRAS: G12V
With the growing accessibility of NGS platforms, simplified DNA mutation
identification methods are needed to realize the goal of individually tailored
Tumor sample 2
Tumor sample 3
ERBB2: P1197R
EGFR: C499Y
therapies. Genomic DNA saved from tissue samples for molecular analysis
is often stored by formalin fixation and paraffin embedding (FFPE), which
can result in DNA degradation. It is estimated that only 1–2% of genetic
Figure 1. Variants in tumor samples, as detected by the
QIAGEN GeneRead DNAseq Lung Cancer Gene Panel.
material from an FFPE sample is of sufficient quality for molecular analysis.
The new QIAGEN GeneRead DNAseq System is designed to work with
these samples and address these concerns. Here, lung cancer FFPE samples
Table 1. Identification of low frequency variants
in lung adenocarcinoma FFPE samples
were assessed for mutations in 20 genes most often mutated in lung cancers
Variant
frequency
(%)
KRAS
c.35G>T
38
p.G12V
c.462A>C
15
p.K154N
PDGFRA
c.1432T>C
54
p.S478P
TP53
c.817C>T
24
p.R273C
ERBB2
c.3590C>G
9
p.P1197R
KRAS
c.35G>T
30
p.G12V
EGFR
c.1496G>A
7
p.C499Y
KRAS
c.35G>T
23
p.G12V
PDGFRA
c.1432T>C
59
p.S478P
TP53
Several mutations were present in these samples, with a shared mutation
Codon
change
BRAF
using the QIAGEN GeneRead DNAseq Lung Cancer Panel (Table 1).
c.817C>T
11
p.R273C
Tumor
sample
Gene
1
among the 3 samples (Figure 1).
2
3
AA
change
Sample & Assay Technologies
2. QIAGEN GeneRead DNAseq Gene Panels
Gene of interest
Focused sequencing for the most important genes
DNA sequencing is a useful tool to detect genetic variations, including
variants important in diseases like cancer, neurological disease, heritable
diseases, developmental disorders, and many others. The QIAGEN
GeneRead DNAseq System uses overlapping primer pairs (Figure 2)
and a simple workflow (Figure 3) to achieve targeted enrichment of the
most important genes in your area of research, and is compatible with a
variety of NGS platforms, including the Ion PGM Sequencer, Ion Proton,
Figure 2. PCR-enabled targeted enrichment of genes of
interest (GOI). The QIAGEN GeneRead DNAseq System
employs overlapping primer sets across the exonic portions
of a gene or genes, maximizing target coverage and
minimizing nonspecific amplification.
and Illumina HiSeq and MiSeq sequencing systems.
Performance specifications of QIAGEN GeneRead
DNAseq Gene Panels
Central to the ability to identify point mutations within genomic
sequences is the ability of the design strategy to achieve high coverage.
This includes, and the values shown (Table 2) indicate:
Isolate DNA
JJ Design
coverage: 90%
JJ Amplicon
Gene of interest
Targeted enrichment
(PCR enabled)
specificity: 95%
JJ Sequence
coverage uniformity: 90%
In addition, for full confidence in mutation calls, it is recommended that
each base be covered at 500x or above. While newer NGS platforms
can perform the desirable function of processing multiple samples
simultaneously, it is important to keep in mind that the limitations for
Library preparation
sample processing are determined by the NGS platform.
Start adaptor
End adaptor
Table 2. Multiplex capacity of QIAGEN GeneRead DNAseq Gene Panels
in NGS platforms
Library quantification
Sequencing
AT G C AT G
Platform
AT G G AT TA A C
Typical number
of reads
A A C G TAT G
Recommended multiplex level per run for
500x coverage depth
4-gene panel
20-gene panel
124-gene panel
PGM 314
> 0.1 million
1 sample
X
X
PGM 316
> 1 million
10 samples
2 samples
X
PGM 318
> 2 million
20 samples
4 samples
1 sample
MiSeq
~ 5 million
40 samples
8 samples
2 samples
AT G C AT TAT T T
Guided assembly
AT G C AT G G AT TA A C G TAT G C AT TAT T T
Sequence analysis
AT G C AT G G AT TA A C G TAT G C AT TAT T T
AT G C AT G G T T TA A C G TAT G C AT TAT T T
AT G C AT G G AT TA A C C A G T G C AT TAT T T
Wild-type
Sample 1
Sample 2
Figure 3. QIAGEN GeneRead DNAseq Gene Panel System
targeted enrichment NGS workflow. Extract DNA, and use
QIAGEN GeneRead DNAseq Gene Panels for targeted
exon enrichment. Then construct your NGS library, quantify
and quality-control using the QIAGEN GeneRead Library
Quantification System, and perform NGS and data analysis
using the QIAGEN NGS Data Analysis Web Portal.
www.qiagen.com
3. QIAGEN GeneRead DNAseq Library Quant Array
Accurate quantification and quality control
Current methods for sample NGS library quantification all have
significant drawbacks, from false positives to a lengthy time-to-result.
The new QIAGEN GeneRead DNAseq Library Quant Array serves two
purposes: first, to provide a simple library quantification method, and
second, to provide a method to assess sample library quality.
Completing NGS analysis with multiple samples requires a uniform starting
concentration. The QIAGEN GeneRead DNAseq Library Quant Array
provides a set of prediluted standards (5 sequential 10-fold dilutions) prealiquoted onto a PCR array plate. The experimental sample library is then
assessed against the standard curve (Figure 4).
Target DNA
PCR primer set (forward and reverse)
for target DNA
Control DNA
PCR primer set (forward and reverse)
for control DNA
CT
Standards
(serial dilution)
Figure 5. Integrated controls for target enrichment success.
QIAGEN GeneRead DNAseq Gene Panels include control
regions that can be assessed with the QIAGEN GeneRead
DNAseq Library Quant Array.
Log (concentration)
Your sample library
Figure 4. Principle of the QIAGEN GeneRead DNAseq Library Quant Array. The serial
dilutions of the DNA standard (5 sequential 10-fold dilutions) generate a standard curve.
The sample library should fall within the standard curve.
Sample library quality assessment
While the ability to selectively target genes of interest decreases costs, NGS
is still not an inexpensive tool. Therefore, assessing sample quality prior to
NGS analysis is ideal. The QIAGEN GeneRead DNAseq Library Quant
Array accomplishes this by measuring integrated controls in the target
enrichment process. These controls are primer sets targeted to nonvariable
regions of genomic DNA amplified during target enrichment (Figure 5). In
addition, by measuring the relative amplification of these controls versus
the targets, a QC score is provided that describes the quality of the sample
library prior to NGS analysis (Table 3).
Table 3. QC score indicates DNASeq library quality (affected by sample
quality, target enrichment process, and library construction process).
Sample
QC score
On-target reads (specificity)
FFPE-1 (20-gene panel)
FFPE-2 (4-gene panel)
1.3
15.2
91%
45%
Average read length (bp)
128 bp
24 bp
Median coverage depth
206x
83
101
Number of variants per kb region
887x
Total number of variants identified
0.79
7.4
Sample Assay Technologies
Two FFPE samples were subjected to target enrichment,
QC score generation, and NGS. FFPE-1, enriched with a
20-gene panel, showed a QC score of 1.3, while FFPE-2,
enriched with a 4-gene panel, had a QC score of 15.2.
A QC score from 1–4 indicates high quality, while a score
8 indicates low quality. FFPE-1 showed high specificity,
expected average read length, and good coverage depth,
while FFPE-2 showed poorer results in all categories,
verifying the accuracy of the QC score.