SlideShare ist ein Scribd-Unternehmen logo
1 von 38
RATIOS<br />2628900316230Liquidity ratios<br />a) Current ratio =   Current assets<br />                               Current liabilities   <br />For 2005                                                                                                                                                                                                                        <br />Current ratio = 14040781               <br />                        8238179<br />                                                                                                       <br />                        =1.7 <br />For 2006 <br />Current ratio = 15764057<br />                        10371383<br />                     = 1.5<br />For 2007<br />Current ratio = 17719703<br />                        11516361<br />                     =  1.5<br />NOTE: Current ratio is depends on debtors pay back period and creditors pay back period and in the above figure the current ratio fluctuate between 1.7 to 1.5 it shows that firm is becoming insufficiently liquid every year which is not good.<br />b) Quick ratio = Current Assets-Inventory-Prepaid Expenses<br />                                 Current Liabilities<br />    Quick Assets = Current assets-stock-prepaid expenses<br />For 2005<br />    <br />Quick Ratio = Quick Assets<br />                    Current Liabilities<br />  <br />                     = 9090199<br />                        8238179                                                <br />                     =1.1<br />2438400-38100For 2006<br /> <br /> Quick ratio = 9772894<br />                      10371383<br />                       =.94<br />For 2007<br /> <br />Quick Ratio = 11094587<br />                        11516361<br />                    = .96<br />NOTE: In  the above figure quick ratio is decreasing from 1.1 to .96 it shows the ability of the firm to repay its short term obligation is not perfect. <br />B) Solvency Ratios<br />  <br />a)Debt Equity Ratio=    Long term debts <br />                                                   Shareholder’s Fund     <br />For 2005<br />   <br />2952750109855Debt Equity Ratio =  Debt<br />                                 Equity<br />                               = 2504328<br />                                 39147690<br />                               = 0.06<br />                                                           <br />For 2006<br />Debt Equity Ratio =  3136185<br />                                48719696<br />                               = 0.06<br /> <br />For 2007<br />Debt Equity Ratio = 3051473  <br />                               54968682<br />                              = 0.05<br />              <br />NOTE: In the figure for the first two years debt equity ratio is constant but in the third year it decrease it shows Equity is increasing but LTD is decreasing so it is good for the firm because companies liabilities is decreasing so company paid less interest on their LTD.   <br />b) Debt to Total Funds Employed<br />Debt to total funds Employed=       Long term Debts<br />                                                      Total Funds Employed<br />3429000-3175<br />For 2005<br />Debt to total funds Employed= 2504328 <br />                                                     41652018<br />                                                  = 0.06<br />For 2006<br />Debt to total funds Employed = 3136185 <br />                                                     51855821<br />                                                   = 0.06<br />  For 2006<br />Debt to total funds Employed =   3051473 <br />                                                      58020155<br />                                                   = 0.05<br />NOTE: In the figure for the first two years debt equity ratio is constant but in the third year it decrease it shows Capital employed  is increasing but LTD is decreasing so it is good for the firm because companies liabilities is decreasing so company paid less interest on their LTD.   <br />C) Interest Coverage Ratio =     NPBTAI<br />                                                        Interest  on LTD<br />309562568580<br />For 2005<br />    ICR =  8756636                                                                                                                                                            .                 41672      <br />      =     210.13<br />For  2006<br />ICR = 9920557<br />           52612                                                                                                                                                                                                                             <br />       =    188-56<br />For 2007<br />ICR =9200431 <br />           50990<br />     =   180.43<br />NOTE: Interest coverage ratio in the above figure is decreasing it is good for the firm because companies interest is decreasing it mean their margin of profit is increasing.  <br />C) Activity Ratio<br />a) Capital Turnover Ratio <br />Capital Turnover Ratio=         Net Sales<br />286702592075                                            Capital Employed<br />For 2005<br />Capital Turnover Ratio=   56720306 <br />                                             41652018<br />                                        =  1.36 times<br />For 2006<br />Capital Turnover Ratio=   63479833 <br />                                           51855821<br />                                        =  1.2 times<br />For 2007<br />Capital Turnover Ratio=   67351778 <br />                                           58020155<br />                                        =  1.16 times<br />NOTE: Capital  Turnover Ratio in the figure is decreasing it shows company is not efficient with which the capital employed is utilized. <br />b) Fixed Asset Turnover Ratio<br />286702588265<br />Fixed Asset Turnover Ratio =     Net Sales<br />                                                   Net Fixed Asset<br />For 2005<br />Fixed Asset Turnover Ratio = 56720306  <br />                                                  24333854   <br />                                                =  2.33 times<br />For 2006<br />Fixed Asset Turnover Ratio = 63479833  <br />                                                  31023081   <br />                                                =  2.04times<br />For 2007<br />Fixed Asset Turnover Ratio = 67351778 <br />                                                  31745610<br />                                                =  2.12 times<br />NOTE: In the above figure it shows initially company is not utilizing their fixed asset but in 2007 the ratio is increased it shows company I using their fixed asset efficiently.    <br />c) Working Capital Turnover Ratio<br />Working Capital Turnover Ratio =     Net Sales<br />320040014605                                                            Working Capital<br />For 2005<br />Working Capital Turnover Ratio = 56720360  <br />                                                           5802602  <br />                                                          = 9.77 <br />For 2006<br />Working Capital Turnover Ratio = 63479833  <br />                                                          5392674 <br />                                                          =  11.77<br />For 2007<br />Working Capital Turnover Ratio = 67351778  <br />                                                          6203342 <br />                                                          = 10.85<br />NOTE: in the above figure WCTR firstly increasing  and decreased in 2007 which is not good from the companies point of view <br />d) Stock Turnover Ratio<br />293370063500<br />Stock Turnover Ratio =     Cost of Goods Sold<br />                                                  Average Stock<br />For 2005<br />Stock Turnover Ratio = 39642794  <br />                                         2992974  <br />                                       =  13.24 times <br />For 2006<br />Stock Turnover Ratio = 45597151  <br />                                         1889353  <br />                                       =  24.13 times <br />For 2007<br />Stock Turnover Ratio = 49943013  <br />                                        3495387  <br />                                       =  14.28 times <br />NOTE: firstly STR is increasing which is not suitable for the company because their COGS are more but when STR is declining it is good for the company because their expense are declining.<br />e) Debtors Turnover Ratio<br />309562580010Debtors Turnover Ratio =     Net Credit Sales<br />                                                  Average Debtors<br />For 2005<br />Debtors Turnover Ratio = 56720360  <br />                                            2274932 <br />                                         =  24.93 times <br />For 2006<br />Debtors Turnover Ratio = 63479833 <br />                                            1582930 <br />                                           =  40.10 times <br />For 2007<br />Debtors Turnover Ratio = 67351778 <br />                                            2825873.5 <br />                                           =  23.83  times <br />NOTE: in the above figure firstly DTR is increased to much and it go up to 40.10 which is good for the company because the risk is less but when it declining in 2007 it shows the companies debtors are increasing which mean their risk is also increased. <br />318135048260f). Creditors Turnover Ratio<br />Creditors Turnover Ratio =     Net Credit Purchases<br />                                                       Average Creditors<br />                                              <br />For 2005<br />Creditors Turnover Ratio = 39642794 <br />                                              2542802 <br />                                         =  15.59 times <br />For 2006<br />Creditors Turnover Ratio = 45597157 <br />                                              5352929<br />                                         =  8.51 times<br />For 2007<br />Creditors Turnover Ratio = 49943013 <br />                                             5359852 <br />                                         =  9.31 times <br />NOTE: Above figure shows when CTR is increased in 2006 it shows company is having less creditor but when it is increased in 2007 it is not good for the company because company is more liable to pay to their creditors.<br />D) Profitability Ratios<br />309562534925a) Gross Profit Ratio =     Gross Profit × 100<br />                                                   Net Sales<br />For 2005<br />Gross Profit Ratio = 17077512 × 100<br />                                         56720306<br />                                       =   30.10 %<br />For 2006<br />Gross Profit Ratio = 17882682 × 100<br />                                         63479833<br />                                       =   28.17 %<br />For 2007<br />Gross Profit Ratio = 17408765 × 100<br />                                        67351778<br />                                       =   25.84%<br />NOTE: in the above figure it shows the GP is declining which is not good for the company because their margin of profit is decreasing.<br />f) Net Profit Ratio <br /> Net Profit Ratio =     Net Profit × 100<br />                                              Net Sales<br />2743200111125For 2005<br />Net Profit Ratio = 7542165 × 100<br />                                     56720306<br />                                       =   13.29 %<br />For 2006<br />Net Profit Ratio = 8531848 × 100<br />                                  63479833<br />                                       =  13.44 %<br />For 2007<br />Net Profit Ratio =  7915795 × 100<br />                                   67351778<br />                                       =  11.75 %<br />NOTE : Above figure shows NPR is firstly increase which is good but in the year  2007 it is decreased it mean companies margin of profit is decreasing. <br />a) Operating Profit Ratio =     Operating Profit × 100<br />                                                              Net Sales<br />298132567945<br />For 2005<br />Operating Profit Ratio = 7956343 × 100<br />                                              56720306<br />                                       =   14.02 %<br />For 2006<br />Operating Profit Ratio = 7463868 × 100<br />                                             63479833<br />                                          = 11.75%<br />For 2007<br />Operating Profit Ratio =  6335666 × 100<br />                                              67351778<br />                                       =  9.41 %<br />NOTE : above figure also shows that companies margin of profit is decreasing. <br />3162300147320<br />e) Return on Total Assets =     NPBIT × 100<br />                                                     Total Assets<br />For 2005<br />Return on Total Assets = 8756636 × 100<br />                                             49090197<br />                                        =   17.84%<br />For 2006<br />Return on Total Assets = 9920557 × 100<br />                                             62227264<br />                                        =   15.94 %<br />For 2007<br />Return on Total Assets = 9200431 × 100<br />                                            69536516<br />                                        =  13.23 %<br />NOTE : Above figure shows company is not utilizing their asset  efficiently. <br />f) Return on Capital Employed =      NPBIT × 100<br />                                                           Capital Employed<br />325755088265For 2005<br />Return on Capital Employed = 8756636 × 100<br />                                                       41652018<br />                                                     =   21.02%<br />For 2006<br />Return on Capital Employed = 9920557 × 100<br />                                                       51855821<br />                                                     =   19.13 %<br />For 2007<br />Return on Capital Employed = 9200431 × 100<br />                                                        58020155<br />                                                     =  15.85  %<br />NOTE: Above figure graph is declining it shows  that company return on total capital employed are not in a good position. <br />g) Return on Shareholder’s Capital =      NPAIT × 100<br />                                                                    Shareholder’s fund<br />For 2005<br />3295650635<br />Return on Shareholder’s Capital = 7542165 × 100<br />                                                              39147690<br />                                                          = 19.26  %<br />For 2006<br />Return on Capital Employed = 8531848 × 100<br />                                                       48719696<br />                                                     =  17.51%<br />For 2007<br />Return on Capital Employed = 7915795 × 100<br />                                                        45968682<br />                                                     =  17.21  %<br />NOTE: Above figure graph is declining it shows  that company return on share capital are not in a good position. <br />g) Return on Equity =      NPAIT × 100<br />                                        Equity Shareholder’s fund<br />300037583185<br />For 2005<br />Return on Equity = 7542165 × 100<br />                                     39147690<br />                              =   19.26%<br />For 2006<br />Return on Equity   = 8531848 × 100<br />                                      48719696<br />                               =  17.51%<br />For 2007<br />Return on Equity = 7915795 × 100<br />                                     45968682<br />                              =    17.22%<br />NOTE : Above figure graph is declining which mean that returns on equity shareholder fund are nor perfect.  <br />280987574930<br />h) Earning per share=NPAIT <br />                                       No. of shares<br />  <br />     EPS  =  49<br />For 2006<br />      EPS  = 56921<br />For 2007<br />      EPS   = 53<br />i)  Dividend per share  = Dividend declared<br />                                           No. of shares<br />274320010160For 2005<br />  DPS  =  48<br />                                                                                           <br />                                                                                <br /> For 2006<br />DPS   = 56103<br />                                                                                                                                                            <br />     <br />For 2007<br />DPS  = 52             <br /> Samsung Electronics Co., Ltd.<br />Non-Consolidated Statements of Income<br />For the years ended December 31, 2005 and 2004<br />(In millions of Korean won, in2005200420052004thousands of U.S. dollars (Note 3))Sales (Note 26)₩57,457,670₩57,632,359$56,720,306$56,892,753Cost of sales40,158,15037,279,68639,642,79436,801,269Gross profit17,299,52020,352,67317,077,51220,091,484Selling, general and administrativeexpenses9,239,7458,335,7969,121,1698,228,822Operating profit8,059,77512,016,8777,956,34311,862,662Non-operating incomeInterest and dividend income229,654295,428226,707291,637Commission income366,519205,287361,815202,653Foreign exchange gains399,624402,774394,496397,605Gain on foreign currency translation(Note 28)90,187138,52889,030136,750Gain on valuation of investmentsusing the equity methodof accounting (Note 10)1,131,014576,9231,116,500569,519Others454,361517,801448,529511,1562,671,3592,136,7412,637,0772,109,320Non-operating expensesInterest expense42,21465,97041,67265,123Foreign exchange losses348,804364,867344,328360,185Loss on foreign currency translation(Note 28)31,24441,90330,84341,365Loss on valuation of investmentsusing the equity methodof accounting (Note 10)972,173-959,697-Others466,227556,352460,244549,2121,860,6621,029,0921,836,7841,015,885Ordinary profit8,870,47213,124,5268,756,63612,956,097<br />Samsung Electronics Co., Ltd.<br />Non-Consolidated Statements of Income<br />For the years ended December 31, 2005 and 2004<br />(In millions of Korean won, in thousands of U.S. dollars (Note 3))2005200420052004Extraordinary income₩-₩-$-$-Extraordinary loss----Net income before income taxes8,870,47213,124,5268,756,63612,956,097Income tax expense (Note 24)1,230,2592,337,7841,214,4712,307,783Net income₩ 7,640,213₩10,786,742$7,542,165$  10,648,314Basic earnings per share (Note 25)(in Korean won and U.S. dollars)₩49,970₩67,899$49$67Diluted earnings per share (Note 25)(in Korean won and U.S. dollars)₩49,128₩66,864$48$66<br />The accompanying notes are an integral part of these non-consolidated financial statements.<br />Samsung Electronics Co., Ltd.<br />Non-Consolidated Balance Sheets December 31, 2005 and 2004<br />(In millions of Korean won, in thousands of U.S. dollars (Note 3))2005200420052004AssetsCurrent assetsCash and cash equivalents₩ 1,053,552₩  957,819$1,040,032$945,527Short-term financial instruments(Note 4)3,897,9314,186,7063,847,9084,132,977Short-term available-for-salesecurities (Note 5)1,917,1222,289,3651,892,5192,259,985Trade accounts and notesreceivable, net of allowance fordoubtful accounts (Note 6)1,496,9391,331,5871,477,7291,314,499Other accounts and notes receivable,net of allowance for doubtfulaccounts (Note 6)842,828937,658832,011925,625Inventories, net of valuation losses(Note 7)2,909,4473,154,3182,872,1103,113,838Short-term deferred incometax assets (Note 24)907,680-896,032-Prepaid expenses and other currentassets1,197,8121,101,0381,182,4401,086,908Total current assets14,223,31113,958,49114,040,78113,779,359Lease receivables under capitallease (Note 8)269,179312,034265,725308,030Property, plant and equipment,including revalued portion,net of accumulated depreciation(Note 11)24,650,19419,727,80724,333,85419,474,637Long-term available-for-salesecurities (Note 9)977,409463,197964,866457,253Equity-method investments (Note 10)8,891,8808,353,2118,777,7698,246,013Intangible assets, net of accumulatedamortization (Note 12)465,801399,376459,823394,251Long-term deposits and other assets(Note 13)1,060,996602,4271,047,379594,695Total assets₩50,538,770₩43,816,543$49,890,197$43,254,238<br />Samsung Electronics Co., Ltd.<br />Non-Consolidated Balance Sheets December 31, 2005 and 2004<br />(In millions of Korean won, in thousands of U.S. dollars (Note 3))2005200420052004Liabilities andShareholders' EquityCurrent liabilitiesTrade accounts and notes payable₩ 1,867,185₩ 1,823,316$1,843,223$1,799,917Other accounts and notes payable2,917,6592,595,5572,880,2162,562,248Accrued expenses (Note 16)2,506,5012,359,7512,474,3352,329,468Income taxes payable789,9251,378,429779,7881,360,739Other current liabilities264,005563,850260,617556,614Total current liabilities8,345,2758,720,9038,238,1798,608,986Foreign currency notes andbonds (Note 14)95,55798,54594,33197,280Long-term advances received505,950-499,457-Long-term accrued expenses(Note 16)133,748-132,031-Deferred income tax liabilities(Note 24)865,76119,983854,65019,727Accrued severance benefits (Note 15)498,488397,084492,091391,988Other long-term liabilities437,381139,619431,768137,828Total liabilities₩10,882,160₩ 9,376,134$10,742,507$9,255,809<br />Samsung Electronics Co., Ltd.<br />Non-Consolidated Balance Sheets December 31, 2005 and 2004<br />(In millions of Korean won, in thousands of U.S. dollars (Note 3))2005200420052004Commitments and contingencies(Note 17)Shareholders' equityCapital stock (Note 18)Common stock₩  778,047₩  778,047$768,062$768,062Preferred stock119,467119,467117,934117,934Capital surplusPaid-in capital in excess ofpar value4,403,8934,403,8934,347,3774,347,377Other capital surplus1,961,4221,927,7731,936,2511,903,034Retained earnings (Note 19)37,365,89230,575,04136,886,36930,182,666(Net income of ₩7,640,213 millionin 2005 and₩10,786,742 millionin 2004)Capital adjustmentsTreasury stock (Note 21)(5,970,778)(4,159,639)(5,894,154)(4,106,258)Others (Note 22)998,667795,827985,851785,614Total shareholders' equity39,656,61034,440,40939,147,69033,998,429Total liabilities &shareholder's equity₩50,538,770₩43,816,543$49,890,197$43,254,238<br />The accompanying notes are an integral part of these non-consolidated financial statements.<br />Samsung Electronics Co., Ltd.<br />Non-Consolidated Balance Sheets December 31, 2006 and 2005<br />(In millions of Korean won, in thousands of U.S. dollars (Note 3))2006200520062005AssetsCurrent assetsCash and cash equivalents₩  977,989₩ 1,053,552$1,052,733$1,134,07Short-term financial instruments3,335,1413,897,9313,590,0334,195,83(Note 4)Short-term available-for-sale2,058,7811,917,1222,216,1262,063,64securities (Note 5)Trade accounts and notes  receivable,net of allowance for doubtful1,842,4391,496,9391,983,2501,611,34accounts (Note 6)Other accounts and notes receivable,net of allowance for doubtful864,669842,828930,752907,24accounts (Note 6)Inventories, net of valuation losses3,219,4742,909,4473,465,5263,131,80(Note 7)Short-term deferred income tax1,155,410907,6801,243,714977,05assets (Note 24)Prepaid expenses and other current1,190,9061,197,8121,281,9231,289,35assetsTotal current assets14,644,80914,223,31115,764,05715,310,34Lease receivables under finance lease223,488269,179240,569289,75(Note 8)Property, plant and equipment,including revaluations, net of28,820,44224,650,19431,023,08126,534,11accumulated depreciation (Note 11)Long-term available-for-sale securities1,148,944977,4091,236,7531,052,10(Note 9)Equity-method investments (Note 10)11,265,0838,891,88012,126,0319,571,45Intangible assets, net of accumulated522,378465,801562,301501,40amortization (Note 12)Long-term deposits and other assets,1,183,9841,060,9961,274,4721,142,08net (Note 13)Total assets₩57,809,128₩50,538,770$62,227,264$ 54,401,25<br />Samsung Electronics Co., Ltd.<br />Non-Consolidated Balance Sheets December 31, 2006 and 2005<br />(In millions of Korean won, in thousands of U.S. dollars (Note 3))2006200520062005Liabilities and Shareholders' EquityCurrent liabilitiesTrade accounts and notes payable₩ 1,869,101₩ 1,867,185$2,011,949$2,009,887Other accounts and notes payable3,291,7972,917,6593,543,3773,140,645Accrued expenses (Note 16)2,873,1482,506,5013,092,7322,698,064Income taxes payable1,111,233789,9251,196,160850,296Other current liabilities489,736264,005527,165284,181Total current liabilities9,635,0158,345,27510,371,3838,983,073Foreign currency notes and bonds87,31795,55793,990102,860(Note 14)Long-term advances received340,033505,950366,020544,618Long-term accrued expenses (Note 16)274,527133,748295,508143,970Deferred income tax liabilities1,158,802865,7611,247,365931,928(Note 24)Accrued severance benefits,net620,469498,488667,889536,586(Note 15)Other long-term liabilities432,368437,381465,413470,808Total liabilities12,548,53110,882,16013,507,56811,713,843Commitments and contingencies(Note 17)Shareholders' equityCapital stock (Note 18)Common stock778,047778,047837,510837,510Preferred stock119,467119,467128,597128,597Capital surplusPaid-in capital in excess of par4,403,8934,403,8934,740,4664,740,466valueOther capital surplus1,963,3511,961,4222,113,4042,111,326Retained earnings (Note 19)(Net income of ₩7,926,087 millionin 2006 and ₩7,640,213 million in44,460,18937,365,89247,858,11540,221,6282005)Capital adjustmentsTreasury stock (Note 21)(7,520,023)(5,970,778)(8,094,750)(6,427,102)Others (Note 22)1,055,673998,6671,136,3541,074,991Total shareholders' equity45,260,59739,656,61048,719,69642,687,416Total  liabilities  &  shareholders'₩ 57,809,128₩50,538,770$62,227,264$54,401,259equity<br />The accompanying notes are an integral part of these non-consolidated financial statements.<br />Samsung Electronics Co., Ltd.<br />Non-Consolidated Statements of Income<br />For the years ended December 31, 2006 and 2005<br />(In millions of Korean won, in thousands of U.S. dollars (Note 3))2006200520062005Sales (Note 26)₩58,972,765₩57,457,670$ 63,479,833$ 61,848,945Cost of sales42,359,75340,158,15045,597,15143,227,287Gross profit16,613,01217,299,52017,882,68218,621,658Selling, general and administrativeexpenses9,679,0799,239,74510,418,8149,945,905Operating profit6,933,9338,059,7757,463,8688,675,753Non-operating incomeInterest and dividend income257,417229,654277,090247,206Commission income315,172366,519339,259394,531Gain on disposal of available-for-salesecurities58,98033,27163,48835,814Gain on disposal of property, plantand equipment78,63641,29184,64644,447Foreign exchange gains403,701399,624434,554430,166Gain on foreign currency translation(Note 28)124,99890,187134,55197,080Gain on valuation of equity-methodinvestments (Note 10)1,798,5051,131,0141,935,9581,217,453Others372,013379,799400,445408,8243,409,4222,671,3593,669,9912,875,521Non-operating expensesInterest expenses48,87742,21452,61245,440Loss on disposal of trade accountsand notes receivable253,740185,536273,132199,716Donations175,249173,563188,643186,828Loss on disposal of available-for-salesecurities3,69121,5333,97323,179Loss on disposal of property, plantand equipment37,87613,51740,77114,550Foreign exchange losses391,831348,804421,777375,462Loss on foreign currency translation(Note 28)28,98831,24431,20333,632Loss on valuation of equity-methodinvestments (Note 10)92,553972,17399,6261,046,473Others94,35372,078101,56577,5851,127,1581,860,6621,213,3022,002,865Ordinary profit9,216,1978,870,4729,920,5579,548,409<br />Samsung Electronics Co., Ltd.<br />Non-Consolidated Statements of Income<br />For the years ended December 31, 2006 and 2005<br />(In millions of Korean won, in thousands of U.S. dollars (Note 3))2006200520062005Extraordinary income₩-₩-$-$-Extraordinary loss----Net income before income tax9,216,1978,870,4729,920,5579,548,409Income tax expense (Note 24)1,290,1101,230,2591,388,7091,324,283Net income₩ 7,926,087₩ 7,640,213$8,531,848$8,224,126Basic earnings per share (Note 25)(in Korean won and U.S. dollars)₩52,880₩49,970$56,921$53,789Diluted earnings per share(Note 25) (in Korean won and U.S.dollars)₩52,120₩49,128$56,103$52,883<br />The accompanying notes are an integral part of these non-consolidated financial statements.<br />Samsung Electronics Co., Ltd.<br />Non-Consolidated Balance Sheets December 31, 2007 and 2006<br />(In millions of Korean won, in thousands of U.S. dollars (Note 3))2007200620072006AssetsCurrent assetsCash and cash equivalents₩  2,026,791₩     977,989$2,160,758$1,042,632Short-term financial instruments(Note 4)4,862,8693,335,1415,184,2953,555,587Short-term available-for-salesecurities (Note 5)922,8332,058,781983,8302,194,862Trade accounts and notesreceivable, net of allowance for1,780,5071,842,4391,898,1951,964,221doubtful accounts (Note 6)Other accounts and notes receivable,net of allowance for doubtful813,723864,669867,509921,822accounts (Note 6)Inventories, net of valuation losses3,337,8723,219,4743,558,4993,432,275(Note 7)Short-term deferred income taxassets (Note 24)1,241,6361,155,4101,323,7061,231,780Short-term lease receivables underfinance  lease112,29569,348119,71773,932Advanced payments859,713551,479916,538587,931Prepaid expenses407,082400,824433,989427,318Other current assets255,760238,603272,667254,375Total current assets16,621,08114,714,15717,719,70315,686,735Property, plant and equipment,including revaluations, net of29,777,38228,820,44231,745,61030,725,418accumulated depreciation (Note 11)Long-term available-for-sale securities1,936,1761,148,9442,064,1541,224,887(Note 9)Equity-method investments (Note 10)15,008,46211,265,08316,000,49312,009,683Intangible assets, net of accumulated568,316522,378605,881556,906amortization (Note 12)Long-term lease receivables under245,410154,140261,631164,328finance leaseLong-term deposits and other assets,net (Note 13)1,068,4251,183,9841,139,0441,262,244Total assets₩65,225,252₩57,809,128$69,536,516$ 61,630,201<br />Samsung Electronics Co., Ltd.<br />Non-Consolidated Balance Sheets December 31, 2007 and 2006<br />(In millions of Korean won, in thousands of U.S. dollars (Note 3))2007200620072006Liabilities and Shareholders' EquityCurrent liabilitiesTrade accounts and notes payable₩   1,935,663₩  1,869,101$2,063,607$1,992,645Other accounts and notes payable2,958,5213,291,7973,154,0743,509,378Accrued expenses (Note 16)4,071,1442,873,1484,340,2393,063,058Income taxes payable1,114,0481,111,2331,187,6841,184,683Other current liabilities722,970489,736770,757522,107Total current liabilities10,802,3469,635,01511,516,36110,271,871Foreign currency notes and bonds,net of current portion (Note 14)83,81587,31789,35593,088Long-term advances received168,650340,033179,797362,509Long-term accrued expenses (Note 16)39,174274,52741,763292,673Deferred income tax liabilities(Note 24)1,508,4491,221,8151,608,1551,302,575Accrued severance benefits, net(Note 15)623,147620,469664,336661,481Other long-term liabilities439,047432,368468,067460,946Total liabilities13,664,62812,611,54414,567,83413,445,143<br />Commitments and contingencies (Note 17)<br />Samsung Electronics Co., Ltd.<br />Non-Consolidated Balance Sheets December 31, 2007 and 2006<br />(In millions of Korean won, in thousands of U.S. dollars (Note 3))2007200620072006Shareholders' equityCapital stock (Note 18)Common stock₩778,047₩778,047$829,474$829,474Preferred stock119,467119,467127,364127,364Capital surplusPaid-in capital in excess of parvalue4,403,8934,403,8934,694,9824,694,982Other capital surplus1,959,6401,963,3512,089,1682,093,125Capital adjustmentsTreasury stock (Note 21)(9,157,492)(7,520,023)(9,762,785)(8,017,082)Stock options475,197539,153506,607574,790Accumulated other comprehensiveincome (Note 23)2,019,195556,9242,152,660593,735Retained earnings (Note 19)50,962,67744,356,77254,331,21247,288,670Total shareholders' equity51,560,62445,197,58454,968,68248,185,058Total  liabilities  &  shareholders'equity₩65,225,252₩ 57,809,128$ 69,536,516$61,630,201<br />The accompanying notes are an integral part of these non-consolidated financial statements.<br />Samsung Electronics Co., Ltd.<br />Non-Consolidated Statements of Income<br />For the years ended December 31, 2007 and 2006<br />(In millions of Korean won, in thousands of U.S. dollars (Note 3))2007200620072006Sales (Note 27)₩63,175,968₩58,972,765$  67,351,778$ 62,870,752Cost of sales46,846,54642,359,75349,943,01345,159,652Gross profit16,329,42216,613,01217,408,76517,711,100Selling, general and administrativeexpenses10,386,5679,679,07911,073,09910,318,847Operating profit5,942,8556,933,9336,335,6667,392,253Non-operating incomeInterest and dividend income292,983257,417312,349274,432Commission income339,496315,172361,936336,004Gain on disposal of available-for-salesecurities38,51158,98041,05762,878Gain on disposal of  property, plantand equipment101,60578,636108,32183,834Foreign exchange gains347,061403,701370,001430,385Gain on foreign currency translation(Note 29)48,573124,99851,784133,260Gain on valuation of equity-methodinvestments (Note 10)2,627,1651,798,5052,800,8161,917,383Others366,690372,013390,926396,6024,162,0843,409,4224,437,1903,634,778Non-operating expensesInterest expenses47,82948,87750,99052,108Loss on disposal of trade accountsand notes receivable284,204253,740302,989270,512Donations182,565175,249194,632186,833Loss on disposal of available-for-salesecurities1,7543,6911,8703,935Loss on disposal of equity methodinvestments26,653-28,415-Loss on disposal of  property, plantand equipment55,68537,87659,36640,380Foreign exchange losses457,020391,831487,228417,730Loss on foreign currency translation(Note 29)46,04828,98849,09230,904Loss on valuation of  equity-methodinvestments (Note 10)262,28492,553279,62098,671Others110,89394,353118,223100,5881,474,9351,127,1581,572,4251,201,661<br />Samsung Electronics Co., Ltd.<br />Non-Consolidated Statements of Income<br />For the years ended December 31, 2007 and 2006<br />(In millions of Korean won, in thousands of U.S. dollars (Note 3))2007200620072006Net income before income tax₩  8,630,004₩  9,216,197$9,200,431$9,825,370Income tax expense (Note 24)1,204,9881,299,7061,284,6361,385,614Net income₩ 7,425,016₩  7,916,491$7,915,795$8,439,756Basic earnings per share (Note 25)(in Korean won and U.S. dollars)₩49,532₩52,816$53$56Diluted earnings per share(Note 25) (in Korean won and U.S.dollars)₩48,954₩52,057$52$55<br />The accompanying notes are an integral part of these non-consolidated financial statements.<br />       RATIO ANALYSIS PROJECT <br />           ON SAMSUNG<br />             <br />                   (FOR THE YEAR 2005/2006/2007)<br />                                                                                                          <br />                                                                                                 <br />                                                                                                           SUBMITTED BY:-<br />                                                                                                                         DEEPAK KHANDODIYA<br />                                                                                                                         MOHIT ARYA<br />                                                                                                                         PRANJAL AERON<br />                                                                                                                         PRASOON VARSHNEY<br />                                                                                                                          TASAVUR<br />                                                                                                                          VARUN VARSHNEY<br />                                                        <br />                        <br />
Ratios Analysis
Ratios Analysis
Ratios Analysis
Ratios Analysis
Ratios Analysis
Ratios Analysis
Ratios Analysis
Ratios Analysis
Ratios Analysis
Ratios Analysis
Ratios Analysis
Ratios Analysis
Ratios Analysis
Ratios Analysis
Ratios Analysis
Ratios Analysis
Ratios Analysis
Ratios Analysis
Ratios Analysis
Ratios Analysis
Ratios Analysis
Ratios Analysis
Ratios Analysis
Ratios Analysis
Ratios Analysis
Ratios Analysis
Ratios Analysis
Ratios Analysis
Ratios Analysis
Ratios Analysis
Ratios Analysis
Ratios Analysis
Ratios Analysis
Ratios Analysis
Ratios Analysis
Ratios Analysis
Ratios Analysis

Weitere ähnliche Inhalte

Was ist angesagt?

Presentation of Swedbank's first quarter 2012 results
Presentation of Swedbank's first quarter 2012 results Presentation of Swedbank's first quarter 2012 results
Presentation of Swedbank's first quarter 2012 results Swedbank
 
MMS - initiation of equity research report
MMS - initiation of equity research reportMMS - initiation of equity research report
MMS - initiation of equity research reportGeorge Gabriel
 
Fin 515 week 5
Fin 515 week 5Fin 515 week 5
Fin 515 week 5ecambry
 
14123 cost of capitalnew (2)
14123 cost of capitalnew (2)14123 cost of capitalnew (2)
14123 cost of capitalnew (2)Ranga Naik
 

Was ist angesagt? (7)

Presentation of Swedbank's first quarter 2012 results
Presentation of Swedbank's first quarter 2012 results Presentation of Swedbank's first quarter 2012 results
Presentation of Swedbank's first quarter 2012 results
 
Dividend and Valuation
Dividend and Valuation Dividend and Valuation
Dividend and Valuation
 
MMS - initiation of equity research report
MMS - initiation of equity research reportMMS - initiation of equity research report
MMS - initiation of equity research report
 
Ratios project
Ratios projectRatios project
Ratios project
 
Fin 515 week 5
Fin 515 week 5Fin 515 week 5
Fin 515 week 5
 
14123 cost of capitalnew (2)
14123 cost of capitalnew (2)14123 cost of capitalnew (2)
14123 cost of capitalnew (2)
 
Dividend policy
Dividend policyDividend policy
Dividend policy
 

Ähnlich wie Ratios Analysis

Liquidity ratios its me
Liquidity ratios  its meLiquidity ratios  its me
Liquidity ratios its meShashi Prakash
 
Cornelia wong wen chieh
Cornelia wong wen chiehCornelia wong wen chieh
Cornelia wong wen chiehCarra Chin
 
Stock Analysis of HDFC Bank.pptx
Stock Analysis of HDFC Bank.pptxStock Analysis of HDFC Bank.pptx
Stock Analysis of HDFC Bank.pptxAdarshSingh749984
 
presentation on Integrative Case of Track Software Ltd
presentation on Integrative Case of Track Software Ltd presentation on Integrative Case of Track Software Ltd
presentation on Integrative Case of Track Software Ltd Pritom27
 
Analysis of financial statements
Analysis of financial statementsAnalysis of financial statements
Analysis of financial statementsKhalid Aziz
 
Performance evaluation of Dhaka Bank Ltd.
Performance evaluation of Dhaka Bank Ltd.Performance evaluation of Dhaka Bank Ltd.
Performance evaluation of Dhaka Bank Ltd.12inch
 
celanese q3_2006_ir_e
celanese q3_2006_ir_ecelanese q3_2006_ir_e
celanese q3_2006_ir_efinance44
 
ameriprise 1Q06_Release
ameriprise 1Q06_Releaseameriprise 1Q06_Release
ameriprise 1Q06_Releasefinance43
 
Presentation Accounting.pptx
Presentation Accounting.pptxPresentation Accounting.pptx
Presentation Accounting.pptxConsentQUEEN
 
Pirooz Pourdad - Valuation and Exit Strategies for Family Enterprise
Pirooz Pourdad - Valuation and Exit Strategies for Family EnterprisePirooz Pourdad - Valuation and Exit Strategies for Family Enterprise
Pirooz Pourdad - Valuation and Exit Strategies for Family EnterpriseEstate Planning Council of Abbotsford
 
Budgeting basics iii cashflow
Budgeting basics iii   cashflowBudgeting basics iii   cashflow
Budgeting basics iii cashflowJan Bendtsen
 
FifthThird 2Q 08 Earnings Release_Fina
FifthThird 2Q 08 Earnings Release_FinaFifthThird 2Q 08 Earnings Release_Fina
FifthThird 2Q 08 Earnings Release_Finafinance28
 
FifthThird 2Q 08 EarningsRelease_Fina
FifthThird 2Q 08 EarningsRelease_FinaFifthThird 2Q 08 EarningsRelease_Fina
FifthThird 2Q 08 EarningsRelease_Finafinance28
 
Silver river manufacturing company
Silver river manufacturing companySilver river manufacturing company
Silver river manufacturing companyPawan Kawan
 
Working capital management and the importance
Working capital management and the importanceWorking capital management and the importance
Working capital management and the importanceMohammedAshik64
 
ameriprise 3Q06_Release
ameriprise 3Q06_Releaseameriprise 3Q06_Release
ameriprise 3Q06_Releasefinance43
 
raytheon Q4 Earnings Presentation
raytheon Q4 Earnings Presentationraytheon Q4 Earnings Presentation
raytheon Q4 Earnings Presentationfinance12
 

Ähnlich wie Ratios Analysis (20)

Liquidity ratios its me
Liquidity ratios  its meLiquidity ratios  its me
Liquidity ratios its me
 
Cornelia wong wen chieh
Cornelia wong wen chiehCornelia wong wen chieh
Cornelia wong wen chieh
 
Stock Analysis of HDFC Bank.pptx
Stock Analysis of HDFC Bank.pptxStock Analysis of HDFC Bank.pptx
Stock Analysis of HDFC Bank.pptx
 
presentation on Integrative Case of Track Software Ltd
presentation on Integrative Case of Track Software Ltd presentation on Integrative Case of Track Software Ltd
presentation on Integrative Case of Track Software Ltd
 
Analysis of financial statements
Analysis of financial statementsAnalysis of financial statements
Analysis of financial statements
 
Performance evaluation of Dhaka Bank Ltd.
Performance evaluation of Dhaka Bank Ltd.Performance evaluation of Dhaka Bank Ltd.
Performance evaluation of Dhaka Bank Ltd.
 
celanese q3_2006_ir_e
celanese q3_2006_ir_ecelanese q3_2006_ir_e
celanese q3_2006_ir_e
 
ameriprise 1Q06_Release
ameriprise 1Q06_Releaseameriprise 1Q06_Release
ameriprise 1Q06_Release
 
Financial mgt exercises
Financial mgt exercisesFinancial mgt exercises
Financial mgt exercises
 
Presentation Accounting.pptx
Presentation Accounting.pptxPresentation Accounting.pptx
Presentation Accounting.pptx
 
Pirooz Pourdad - Valuation and Exit Strategies for Family Enterprise
Pirooz Pourdad - Valuation and Exit Strategies for Family EnterprisePirooz Pourdad - Valuation and Exit Strategies for Family Enterprise
Pirooz Pourdad - Valuation and Exit Strategies for Family Enterprise
 
Budgeting basics iii cashflow
Budgeting basics iii   cashflowBudgeting basics iii   cashflow
Budgeting basics iii cashflow
 
St.mgt
St.mgtSt.mgt
St.mgt
 
FifthThird 2Q 08 Earnings Release_Fina
FifthThird 2Q 08 Earnings Release_FinaFifthThird 2Q 08 Earnings Release_Fina
FifthThird 2Q 08 Earnings Release_Fina
 
FifthThird 2Q 08 EarningsRelease_Fina
FifthThird 2Q 08 EarningsRelease_FinaFifthThird 2Q 08 EarningsRelease_Fina
FifthThird 2Q 08 EarningsRelease_Fina
 
Silver river manufacturing company
Silver river manufacturing companySilver river manufacturing company
Silver river manufacturing company
 
Working capital management and the importance
Working capital management and the importanceWorking capital management and the importance
Working capital management and the importance
 
ameriprise 3Q06_Release
ameriprise 3Q06_Releaseameriprise 3Q06_Release
ameriprise 3Q06_Release
 
credit-suisse Slides Q2 Results
credit-suisse Slides Q2 Resultscredit-suisse Slides Q2 Results
credit-suisse Slides Q2 Results
 
raytheon Q4 Earnings Presentation
raytheon Q4 Earnings Presentationraytheon Q4 Earnings Presentation
raytheon Q4 Earnings Presentation
 

Mehr von Ankit Gupta, FRM (20)

Price Discrimination
Price DiscriminationPrice Discrimination
Price Discrimination
 
Status symbol
Status symbolStatus symbol
Status symbol
 
It happened in India" Kishore Biyani"
It happened in India" Kishore Biyani"It happened in India" Kishore Biyani"
It happened in India" Kishore Biyani"
 
Macro Economics Outlook
Macro Economics OutlookMacro Economics Outlook
Macro Economics Outlook
 
Organization Behaviour
Organization Behaviour Organization Behaviour
Organization Behaviour
 
Tata sky Case Study
Tata sky Case StudyTata sky Case Study
Tata sky Case Study
 
Teamwork
TeamworkTeamwork
Teamwork
 
Bata Rejuvenation
Bata RejuvenationBata Rejuvenation
Bata Rejuvenation
 
A commercial law presentation
A commercial law presentationA commercial law presentation
A commercial law presentation
 
Business Plan
Business PlanBusiness Plan
Business Plan
 
Vs
VsVs
Vs
 
Sunset in the morning caselet: Tata Sky
Sunset in the morning caselet: Tata SkySunset in the morning caselet: Tata Sky
Sunset in the morning caselet: Tata Sky
 
System Essential Report
System Essential ReportSystem Essential Report
System Essential Report
 
The Google story (Book Presentation)
The Google story (Book Presentation)The Google story (Book Presentation)
The Google story (Book Presentation)
 
Purple cow ppt
Purple cow pptPurple cow ppt
Purple cow ppt
 
Nokia ppt
Nokia pptNokia ppt
Nokia ppt
 
Archies ppt
Archies pptArchies ppt
Archies ppt
 
Hong kong business culture(Cross culture ppt)
Hong kong business culture(Cross culture ppt)Hong kong business culture(Cross culture ppt)
Hong kong business culture(Cross culture ppt)
 
Book Presentation on" THE WALMART WAY"
Book Presentation on" THE WALMART WAY"Book Presentation on" THE WALMART WAY"
Book Presentation on" THE WALMART WAY"
 
CRM
CRMCRM
CRM
 

Kürzlich hochgeladen

Russian Call Girls In Gtb Nagar (Delhi) 9711199012 💋✔💕😘 Naughty Call Girls Se...
Russian Call Girls In Gtb Nagar (Delhi) 9711199012 💋✔💕😘 Naughty Call Girls Se...Russian Call Girls In Gtb Nagar (Delhi) 9711199012 💋✔💕😘 Naughty Call Girls Se...
Russian Call Girls In Gtb Nagar (Delhi) 9711199012 💋✔💕😘 Naughty Call Girls Se...shivangimorya083
 
OAT_RI_Ep19 WeighingTheRisks_Apr24_TheYellowMetal.pptx
OAT_RI_Ep19 WeighingTheRisks_Apr24_TheYellowMetal.pptxOAT_RI_Ep19 WeighingTheRisks_Apr24_TheYellowMetal.pptx
OAT_RI_Ep19 WeighingTheRisks_Apr24_TheYellowMetal.pptxhiddenlevers
 
Malad Call Girl in Services 9892124323 | ₹,4500 With Room Free Delivery
Malad Call Girl in Services  9892124323 | ₹,4500 With Room Free DeliveryMalad Call Girl in Services  9892124323 | ₹,4500 With Room Free Delivery
Malad Call Girl in Services 9892124323 | ₹,4500 With Room Free DeliveryPooja Nehwal
 
VVIP Pune Call Girls Katraj (7001035870) Pune Escorts Nearby with Complete Sa...
VVIP Pune Call Girls Katraj (7001035870) Pune Escorts Nearby with Complete Sa...VVIP Pune Call Girls Katraj (7001035870) Pune Escorts Nearby with Complete Sa...
VVIP Pune Call Girls Katraj (7001035870) Pune Escorts Nearby with Complete Sa...Call Girls in Nagpur High Profile
 
00_Main ppt_MeetupDORA&CyberSecurity.pptx
00_Main ppt_MeetupDORA&CyberSecurity.pptx00_Main ppt_MeetupDORA&CyberSecurity.pptx
00_Main ppt_MeetupDORA&CyberSecurity.pptxFinTech Belgium
 
Solution Manual for Principles of Corporate Finance 14th Edition by Richard B...
Solution Manual for Principles of Corporate Finance 14th Edition by Richard B...Solution Manual for Principles of Corporate Finance 14th Edition by Richard B...
Solution Manual for Principles of Corporate Finance 14th Edition by Richard B...ssifa0344
 
The Economic History of the U.S. Lecture 17.pdf
The Economic History of the U.S. Lecture 17.pdfThe Economic History of the U.S. Lecture 17.pdf
The Economic History of the U.S. Lecture 17.pdfGale Pooley
 
Log your LOA pain with Pension Lab's brilliant campaign
Log your LOA pain with Pension Lab's brilliant campaignLog your LOA pain with Pension Lab's brilliant campaign
Log your LOA pain with Pension Lab's brilliant campaignHenry Tapper
 
The Economic History of the U.S. Lecture 30.pdf
The Economic History of the U.S. Lecture 30.pdfThe Economic History of the U.S. Lecture 30.pdf
The Economic History of the U.S. Lecture 30.pdfGale Pooley
 
20240429 Calibre April 2024 Investor Presentation.pdf
20240429 Calibre April 2024 Investor Presentation.pdf20240429 Calibre April 2024 Investor Presentation.pdf
20240429 Calibre April 2024 Investor Presentation.pdfAdnet Communications
 
Booking open Available Pune Call Girls Shivane 6297143586 Call Hot Indian Gi...
Booking open Available Pune Call Girls Shivane  6297143586 Call Hot Indian Gi...Booking open Available Pune Call Girls Shivane  6297143586 Call Hot Indian Gi...
Booking open Available Pune Call Girls Shivane 6297143586 Call Hot Indian Gi...Call Girls in Nagpur High Profile
 
Call US 📞 9892124323 ✅ Kurla Call Girls In Kurla ( Mumbai ) secure service
Call US 📞 9892124323 ✅ Kurla Call Girls In Kurla ( Mumbai ) secure serviceCall US 📞 9892124323 ✅ Kurla Call Girls In Kurla ( Mumbai ) secure service
Call US 📞 9892124323 ✅ Kurla Call Girls In Kurla ( Mumbai ) secure servicePooja Nehwal
 
Vip B Aizawl Call Girls #9907093804 Contact Number Escorts Service Aizawl
Vip B Aizawl Call Girls #9907093804 Contact Number Escorts Service AizawlVip B Aizawl Call Girls #9907093804 Contact Number Escorts Service Aizawl
Vip B Aizawl Call Girls #9907093804 Contact Number Escorts Service Aizawlmakika9823
 
06_Joeri Van Speybroek_Dell_MeetupDora&Cybersecurity.pdf
06_Joeri Van Speybroek_Dell_MeetupDora&Cybersecurity.pdf06_Joeri Van Speybroek_Dell_MeetupDora&Cybersecurity.pdf
06_Joeri Van Speybroek_Dell_MeetupDora&Cybersecurity.pdfFinTech Belgium
 
03_Emmanuel Ndiaye_Degroof Petercam.pptx
03_Emmanuel Ndiaye_Degroof Petercam.pptx03_Emmanuel Ndiaye_Degroof Petercam.pptx
03_Emmanuel Ndiaye_Degroof Petercam.pptxFinTech Belgium
 
TEST BANK For Corporate Finance, 13th Edition By Stephen Ross, Randolph Weste...
TEST BANK For Corporate Finance, 13th Edition By Stephen Ross, Randolph Weste...TEST BANK For Corporate Finance, 13th Edition By Stephen Ross, Randolph Weste...
TEST BANK For Corporate Finance, 13th Edition By Stephen Ross, Randolph Weste...ssifa0344
 
Instant Issue Debit Cards - High School Spirit
Instant Issue Debit Cards - High School SpiritInstant Issue Debit Cards - High School Spirit
Instant Issue Debit Cards - High School Spiritegoetzinger
 
20240417-Calibre-April-2024-Investor-Presentation.pdf
20240417-Calibre-April-2024-Investor-Presentation.pdf20240417-Calibre-April-2024-Investor-Presentation.pdf
20240417-Calibre-April-2024-Investor-Presentation.pdfAdnet Communications
 

Kürzlich hochgeladen (20)

Russian Call Girls In Gtb Nagar (Delhi) 9711199012 💋✔💕😘 Naughty Call Girls Se...
Russian Call Girls In Gtb Nagar (Delhi) 9711199012 💋✔💕😘 Naughty Call Girls Se...Russian Call Girls In Gtb Nagar (Delhi) 9711199012 💋✔💕😘 Naughty Call Girls Se...
Russian Call Girls In Gtb Nagar (Delhi) 9711199012 💋✔💕😘 Naughty Call Girls Se...
 
OAT_RI_Ep19 WeighingTheRisks_Apr24_TheYellowMetal.pptx
OAT_RI_Ep19 WeighingTheRisks_Apr24_TheYellowMetal.pptxOAT_RI_Ep19 WeighingTheRisks_Apr24_TheYellowMetal.pptx
OAT_RI_Ep19 WeighingTheRisks_Apr24_TheYellowMetal.pptx
 
Malad Call Girl in Services 9892124323 | ₹,4500 With Room Free Delivery
Malad Call Girl in Services  9892124323 | ₹,4500 With Room Free DeliveryMalad Call Girl in Services  9892124323 | ₹,4500 With Room Free Delivery
Malad Call Girl in Services 9892124323 | ₹,4500 With Room Free Delivery
 
VVIP Pune Call Girls Katraj (7001035870) Pune Escorts Nearby with Complete Sa...
VVIP Pune Call Girls Katraj (7001035870) Pune Escorts Nearby with Complete Sa...VVIP Pune Call Girls Katraj (7001035870) Pune Escorts Nearby with Complete Sa...
VVIP Pune Call Girls Katraj (7001035870) Pune Escorts Nearby with Complete Sa...
 
Commercial Bank Economic Capsule - April 2024
Commercial Bank Economic Capsule - April 2024Commercial Bank Economic Capsule - April 2024
Commercial Bank Economic Capsule - April 2024
 
00_Main ppt_MeetupDORA&CyberSecurity.pptx
00_Main ppt_MeetupDORA&CyberSecurity.pptx00_Main ppt_MeetupDORA&CyberSecurity.pptx
00_Main ppt_MeetupDORA&CyberSecurity.pptx
 
Veritas Interim Report 1 January–31 March 2024
Veritas Interim Report 1 January–31 March 2024Veritas Interim Report 1 January–31 March 2024
Veritas Interim Report 1 January–31 March 2024
 
Solution Manual for Principles of Corporate Finance 14th Edition by Richard B...
Solution Manual for Principles of Corporate Finance 14th Edition by Richard B...Solution Manual for Principles of Corporate Finance 14th Edition by Richard B...
Solution Manual for Principles of Corporate Finance 14th Edition by Richard B...
 
The Economic History of the U.S. Lecture 17.pdf
The Economic History of the U.S. Lecture 17.pdfThe Economic History of the U.S. Lecture 17.pdf
The Economic History of the U.S. Lecture 17.pdf
 
Log your LOA pain with Pension Lab's brilliant campaign
Log your LOA pain with Pension Lab's brilliant campaignLog your LOA pain with Pension Lab's brilliant campaign
Log your LOA pain with Pension Lab's brilliant campaign
 
The Economic History of the U.S. Lecture 30.pdf
The Economic History of the U.S. Lecture 30.pdfThe Economic History of the U.S. Lecture 30.pdf
The Economic History of the U.S. Lecture 30.pdf
 
20240429 Calibre April 2024 Investor Presentation.pdf
20240429 Calibre April 2024 Investor Presentation.pdf20240429 Calibre April 2024 Investor Presentation.pdf
20240429 Calibre April 2024 Investor Presentation.pdf
 
Booking open Available Pune Call Girls Shivane 6297143586 Call Hot Indian Gi...
Booking open Available Pune Call Girls Shivane  6297143586 Call Hot Indian Gi...Booking open Available Pune Call Girls Shivane  6297143586 Call Hot Indian Gi...
Booking open Available Pune Call Girls Shivane 6297143586 Call Hot Indian Gi...
 
Call US 📞 9892124323 ✅ Kurla Call Girls In Kurla ( Mumbai ) secure service
Call US 📞 9892124323 ✅ Kurla Call Girls In Kurla ( Mumbai ) secure serviceCall US 📞 9892124323 ✅ Kurla Call Girls In Kurla ( Mumbai ) secure service
Call US 📞 9892124323 ✅ Kurla Call Girls In Kurla ( Mumbai ) secure service
 
Vip B Aizawl Call Girls #9907093804 Contact Number Escorts Service Aizawl
Vip B Aizawl Call Girls #9907093804 Contact Number Escorts Service AizawlVip B Aizawl Call Girls #9907093804 Contact Number Escorts Service Aizawl
Vip B Aizawl Call Girls #9907093804 Contact Number Escorts Service Aizawl
 
06_Joeri Van Speybroek_Dell_MeetupDora&Cybersecurity.pdf
06_Joeri Van Speybroek_Dell_MeetupDora&Cybersecurity.pdf06_Joeri Van Speybroek_Dell_MeetupDora&Cybersecurity.pdf
06_Joeri Van Speybroek_Dell_MeetupDora&Cybersecurity.pdf
 
03_Emmanuel Ndiaye_Degroof Petercam.pptx
03_Emmanuel Ndiaye_Degroof Petercam.pptx03_Emmanuel Ndiaye_Degroof Petercam.pptx
03_Emmanuel Ndiaye_Degroof Petercam.pptx
 
TEST BANK For Corporate Finance, 13th Edition By Stephen Ross, Randolph Weste...
TEST BANK For Corporate Finance, 13th Edition By Stephen Ross, Randolph Weste...TEST BANK For Corporate Finance, 13th Edition By Stephen Ross, Randolph Weste...
TEST BANK For Corporate Finance, 13th Edition By Stephen Ross, Randolph Weste...
 
Instant Issue Debit Cards - High School Spirit
Instant Issue Debit Cards - High School SpiritInstant Issue Debit Cards - High School Spirit
Instant Issue Debit Cards - High School Spirit
 
20240417-Calibre-April-2024-Investor-Presentation.pdf
20240417-Calibre-April-2024-Investor-Presentation.pdf20240417-Calibre-April-2024-Investor-Presentation.pdf
20240417-Calibre-April-2024-Investor-Presentation.pdf
 

Ratios Analysis

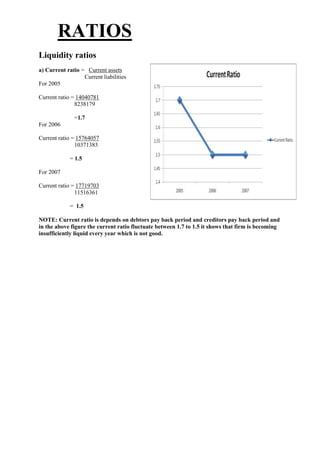
  • 1. RATIOS<br />2628900316230Liquidity ratios<br />a) Current ratio = Current assets<br /> Current liabilities <br />For 2005 <br />Current ratio = 14040781 <br /> 8238179<br /> <br /> =1.7 <br />For 2006 <br />Current ratio = 15764057<br /> 10371383<br /> = 1.5<br />For 2007<br />Current ratio = 17719703<br /> 11516361<br /> = 1.5<br />NOTE: Current ratio is depends on debtors pay back period and creditors pay back period and in the above figure the current ratio fluctuate between 1.7 to 1.5 it shows that firm is becoming insufficiently liquid every year which is not good.<br />b) Quick ratio = Current Assets-Inventory-Prepaid Expenses<br /> Current Liabilities<br /> Quick Assets = Current assets-stock-prepaid expenses<br />For 2005<br /> <br />Quick Ratio = Quick Assets<br /> Current Liabilities<br /> <br /> = 9090199<br /> 8238179 <br /> =1.1<br />2438400-38100For 2006<br /> <br /> Quick ratio = 9772894<br /> 10371383<br /> =.94<br />For 2007<br /> <br />Quick Ratio = 11094587<br /> 11516361<br /> = .96<br />NOTE: In the above figure quick ratio is decreasing from 1.1 to .96 it shows the ability of the firm to repay its short term obligation is not perfect. <br />B) Solvency Ratios<br /> <br />a)Debt Equity Ratio= Long term debts <br /> Shareholder’s Fund <br />For 2005<br /> <br />2952750109855Debt Equity Ratio = Debt<br /> Equity<br /> = 2504328<br /> 39147690<br /> = 0.06<br /> <br />For 2006<br />Debt Equity Ratio = 3136185<br /> 48719696<br /> = 0.06<br /> <br />For 2007<br />Debt Equity Ratio = 3051473 <br /> 54968682<br /> = 0.05<br /> <br />NOTE: In the figure for the first two years debt equity ratio is constant but in the third year it decrease it shows Equity is increasing but LTD is decreasing so it is good for the firm because companies liabilities is decreasing so company paid less interest on their LTD. <br />b) Debt to Total Funds Employed<br />Debt to total funds Employed= Long term Debts<br /> Total Funds Employed<br />3429000-3175<br />For 2005<br />Debt to total funds Employed= 2504328 <br /> 41652018<br /> = 0.06<br />For 2006<br />Debt to total funds Employed = 3136185 <br /> 51855821<br /> = 0.06<br /> For 2006<br />Debt to total funds Employed = 3051473 <br /> 58020155<br /> = 0.05<br />NOTE: In the figure for the first two years debt equity ratio is constant but in the third year it decrease it shows Capital employed is increasing but LTD is decreasing so it is good for the firm because companies liabilities is decreasing so company paid less interest on their LTD. <br />C) Interest Coverage Ratio = NPBTAI<br /> Interest on LTD<br />309562568580<br />For 2005<br /> ICR = 8756636 . 41672 <br /> = 210.13<br />For 2006<br />ICR = 9920557<br /> 52612 <br /> = 188-56<br />For 2007<br />ICR =9200431 <br /> 50990<br /> = 180.43<br />NOTE: Interest coverage ratio in the above figure is decreasing it is good for the firm because companies interest is decreasing it mean their margin of profit is increasing. <br />C) Activity Ratio<br />a) Capital Turnover Ratio <br />Capital Turnover Ratio= Net Sales<br />286702592075 Capital Employed<br />For 2005<br />Capital Turnover Ratio= 56720306 <br /> 41652018<br /> = 1.36 times<br />For 2006<br />Capital Turnover Ratio= 63479833 <br /> 51855821<br /> = 1.2 times<br />For 2007<br />Capital Turnover Ratio= 67351778 <br /> 58020155<br /> = 1.16 times<br />NOTE: Capital Turnover Ratio in the figure is decreasing it shows company is not efficient with which the capital employed is utilized. <br />b) Fixed Asset Turnover Ratio<br />286702588265<br />Fixed Asset Turnover Ratio = Net Sales<br /> Net Fixed Asset<br />For 2005<br />Fixed Asset Turnover Ratio = 56720306 <br /> 24333854 <br /> = 2.33 times<br />For 2006<br />Fixed Asset Turnover Ratio = 63479833 <br /> 31023081 <br /> = 2.04times<br />For 2007<br />Fixed Asset Turnover Ratio = 67351778 <br /> 31745610<br /> = 2.12 times<br />NOTE: In the above figure it shows initially company is not utilizing their fixed asset but in 2007 the ratio is increased it shows company I using their fixed asset efficiently. <br />c) Working Capital Turnover Ratio<br />Working Capital Turnover Ratio = Net Sales<br />320040014605 Working Capital<br />For 2005<br />Working Capital Turnover Ratio = 56720360 <br /> 5802602 <br /> = 9.77 <br />For 2006<br />Working Capital Turnover Ratio = 63479833 <br /> 5392674 <br /> = 11.77<br />For 2007<br />Working Capital Turnover Ratio = 67351778 <br /> 6203342 <br /> = 10.85<br />NOTE: in the above figure WCTR firstly increasing and decreased in 2007 which is not good from the companies point of view <br />d) Stock Turnover Ratio<br />293370063500<br />Stock Turnover Ratio = Cost of Goods Sold<br /> Average Stock<br />For 2005<br />Stock Turnover Ratio = 39642794 <br /> 2992974 <br /> = 13.24 times <br />For 2006<br />Stock Turnover Ratio = 45597151 <br /> 1889353 <br /> = 24.13 times <br />For 2007<br />Stock Turnover Ratio = 49943013 <br /> 3495387 <br /> = 14.28 times <br />NOTE: firstly STR is increasing which is not suitable for the company because their COGS are more but when STR is declining it is good for the company because their expense are declining.<br />e) Debtors Turnover Ratio<br />309562580010Debtors Turnover Ratio = Net Credit Sales<br /> Average Debtors<br />For 2005<br />Debtors Turnover Ratio = 56720360 <br /> 2274932 <br /> = 24.93 times <br />For 2006<br />Debtors Turnover Ratio = 63479833 <br /> 1582930 <br /> = 40.10 times <br />For 2007<br />Debtors Turnover Ratio = 67351778 <br /> 2825873.5 <br /> = 23.83 times <br />NOTE: in the above figure firstly DTR is increased to much and it go up to 40.10 which is good for the company because the risk is less but when it declining in 2007 it shows the companies debtors are increasing which mean their risk is also increased. <br />318135048260f). Creditors Turnover Ratio<br />Creditors Turnover Ratio = Net Credit Purchases<br /> Average Creditors<br /> <br />For 2005<br />Creditors Turnover Ratio = 39642794 <br /> 2542802 <br /> = 15.59 times <br />For 2006<br />Creditors Turnover Ratio = 45597157 <br /> 5352929<br /> = 8.51 times<br />For 2007<br />Creditors Turnover Ratio = 49943013 <br /> 5359852 <br /> = 9.31 times <br />NOTE: Above figure shows when CTR is increased in 2006 it shows company is having less creditor but when it is increased in 2007 it is not good for the company because company is more liable to pay to their creditors.<br />D) Profitability Ratios<br />309562534925a) Gross Profit Ratio = Gross Profit × 100<br /> Net Sales<br />For 2005<br />Gross Profit Ratio = 17077512 × 100<br /> 56720306<br /> = 30.10 %<br />For 2006<br />Gross Profit Ratio = 17882682 × 100<br /> 63479833<br /> = 28.17 %<br />For 2007<br />Gross Profit Ratio = 17408765 × 100<br /> 67351778<br /> = 25.84%<br />NOTE: in the above figure it shows the GP is declining which is not good for the company because their margin of profit is decreasing.<br />f) Net Profit Ratio <br /> Net Profit Ratio = Net Profit × 100<br /> Net Sales<br />2743200111125For 2005<br />Net Profit Ratio = 7542165 × 100<br /> 56720306<br /> = 13.29 %<br />For 2006<br />Net Profit Ratio = 8531848 × 100<br /> 63479833<br /> = 13.44 %<br />For 2007<br />Net Profit Ratio = 7915795 × 100<br /> 67351778<br /> = 11.75 %<br />NOTE : Above figure shows NPR is firstly increase which is good but in the year 2007 it is decreased it mean companies margin of profit is decreasing. <br />a) Operating Profit Ratio = Operating Profit × 100<br /> Net Sales<br />298132567945<br />For 2005<br />Operating Profit Ratio = 7956343 × 100<br /> 56720306<br /> = 14.02 %<br />For 2006<br />Operating Profit Ratio = 7463868 × 100<br /> 63479833<br /> = 11.75%<br />For 2007<br />Operating Profit Ratio = 6335666 × 100<br /> 67351778<br /> = 9.41 %<br />NOTE : above figure also shows that companies margin of profit is decreasing. <br />3162300147320<br />e) Return on Total Assets = NPBIT × 100<br /> Total Assets<br />For 2005<br />Return on Total Assets = 8756636 × 100<br /> 49090197<br /> = 17.84%<br />For 2006<br />Return on Total Assets = 9920557 × 100<br /> 62227264<br /> = 15.94 %<br />For 2007<br />Return on Total Assets = 9200431 × 100<br /> 69536516<br /> = 13.23 %<br />NOTE : Above figure shows company is not utilizing their asset efficiently. <br />f) Return on Capital Employed = NPBIT × 100<br /> Capital Employed<br />325755088265For 2005<br />Return on Capital Employed = 8756636 × 100<br /> 41652018<br /> = 21.02%<br />For 2006<br />Return on Capital Employed = 9920557 × 100<br /> 51855821<br /> = 19.13 %<br />For 2007<br />Return on Capital Employed = 9200431 × 100<br /> 58020155<br /> = 15.85 %<br />NOTE: Above figure graph is declining it shows that company return on total capital employed are not in a good position. <br />g) Return on Shareholder’s Capital = NPAIT × 100<br /> Shareholder’s fund<br />For 2005<br />3295650635<br />Return on Shareholder’s Capital = 7542165 × 100<br /> 39147690<br /> = 19.26 %<br />For 2006<br />Return on Capital Employed = 8531848 × 100<br /> 48719696<br /> = 17.51%<br />For 2007<br />Return on Capital Employed = 7915795 × 100<br /> 45968682<br /> = 17.21 %<br />NOTE: Above figure graph is declining it shows that company return on share capital are not in a good position. <br />g) Return on Equity = NPAIT × 100<br /> Equity Shareholder’s fund<br />300037583185<br />For 2005<br />Return on Equity = 7542165 × 100<br /> 39147690<br /> = 19.26%<br />For 2006<br />Return on Equity = 8531848 × 100<br /> 48719696<br /> = 17.51%<br />For 2007<br />Return on Equity = 7915795 × 100<br /> 45968682<br /> = 17.22%<br />NOTE : Above figure graph is declining which mean that returns on equity shareholder fund are nor perfect. <br />280987574930<br />h) Earning per share=NPAIT <br /> No. of shares<br /> <br /> EPS = 49<br />For 2006<br /> EPS = 56921<br />For 2007<br /> EPS = 53<br />i) Dividend per share = Dividend declared<br /> No. of shares<br />274320010160For 2005<br /> DPS = 48<br /> <br /> <br /> For 2006<br />DPS = 56103<br /> <br /> <br />For 2007<br />DPS = 52 <br /> Samsung Electronics Co., Ltd.<br />Non-Consolidated Statements of Income<br />For the years ended December 31, 2005 and 2004<br />(In millions of Korean won, in2005200420052004thousands of U.S. dollars (Note 3))Sales (Note 26)₩57,457,670₩57,632,359$56,720,306$56,892,753Cost of sales40,158,15037,279,68639,642,79436,801,269Gross profit17,299,52020,352,67317,077,51220,091,484Selling, general and administrativeexpenses9,239,7458,335,7969,121,1698,228,822Operating profit8,059,77512,016,8777,956,34311,862,662Non-operating incomeInterest and dividend income229,654295,428226,707291,637Commission income366,519205,287361,815202,653Foreign exchange gains399,624402,774394,496397,605Gain on foreign currency translation(Note 28)90,187138,52889,030136,750Gain on valuation of investmentsusing the equity methodof accounting (Note 10)1,131,014576,9231,116,500569,519Others454,361517,801448,529511,1562,671,3592,136,7412,637,0772,109,320Non-operating expensesInterest expense42,21465,97041,67265,123Foreign exchange losses348,804364,867344,328360,185Loss on foreign currency translation(Note 28)31,24441,90330,84341,365Loss on valuation of investmentsusing the equity methodof accounting (Note 10)972,173-959,697-Others466,227556,352460,244549,2121,860,6621,029,0921,836,7841,015,885Ordinary profit8,870,47213,124,5268,756,63612,956,097<br />Samsung Electronics Co., Ltd.<br />Non-Consolidated Statements of Income<br />For the years ended December 31, 2005 and 2004<br />(In millions of Korean won, in thousands of U.S. dollars (Note 3))2005200420052004Extraordinary income₩-₩-$-$-Extraordinary loss----Net income before income taxes8,870,47213,124,5268,756,63612,956,097Income tax expense (Note 24)1,230,2592,337,7841,214,4712,307,783Net income₩ 7,640,213₩10,786,742$7,542,165$ 10,648,314Basic earnings per share (Note 25)(in Korean won and U.S. dollars)₩49,970₩67,899$49$67Diluted earnings per share (Note 25)(in Korean won and U.S. dollars)₩49,128₩66,864$48$66<br />The accompanying notes are an integral part of these non-consolidated financial statements.<br />Samsung Electronics Co., Ltd.<br />Non-Consolidated Balance Sheets December 31, 2005 and 2004<br />(In millions of Korean won, in thousands of U.S. dollars (Note 3))2005200420052004AssetsCurrent assetsCash and cash equivalents₩ 1,053,552₩ 957,819$1,040,032$945,527Short-term financial instruments(Note 4)3,897,9314,186,7063,847,9084,132,977Short-term available-for-salesecurities (Note 5)1,917,1222,289,3651,892,5192,259,985Trade accounts and notesreceivable, net of allowance fordoubtful accounts (Note 6)1,496,9391,331,5871,477,7291,314,499Other accounts and notes receivable,net of allowance for doubtfulaccounts (Note 6)842,828937,658832,011925,625Inventories, net of valuation losses(Note 7)2,909,4473,154,3182,872,1103,113,838Short-term deferred incometax assets (Note 24)907,680-896,032-Prepaid expenses and other currentassets1,197,8121,101,0381,182,4401,086,908Total current assets14,223,31113,958,49114,040,78113,779,359Lease receivables under capitallease (Note 8)269,179312,034265,725308,030Property, plant and equipment,including revalued portion,net of accumulated depreciation(Note 11)24,650,19419,727,80724,333,85419,474,637Long-term available-for-salesecurities (Note 9)977,409463,197964,866457,253Equity-method investments (Note 10)8,891,8808,353,2118,777,7698,246,013Intangible assets, net of accumulatedamortization (Note 12)465,801399,376459,823394,251Long-term deposits and other assets(Note 13)1,060,996602,4271,047,379594,695Total assets₩50,538,770₩43,816,543$49,890,197$43,254,238<br />Samsung Electronics Co., Ltd.<br />Non-Consolidated Balance Sheets December 31, 2005 and 2004<br />(In millions of Korean won, in thousands of U.S. dollars (Note 3))2005200420052004Liabilities andShareholders' EquityCurrent liabilitiesTrade accounts and notes payable₩ 1,867,185₩ 1,823,316$1,843,223$1,799,917Other accounts and notes payable2,917,6592,595,5572,880,2162,562,248Accrued expenses (Note 16)2,506,5012,359,7512,474,3352,329,468Income taxes payable789,9251,378,429779,7881,360,739Other current liabilities264,005563,850260,617556,614Total current liabilities8,345,2758,720,9038,238,1798,608,986Foreign currency notes andbonds (Note 14)95,55798,54594,33197,280Long-term advances received505,950-499,457-Long-term accrued expenses(Note 16)133,748-132,031-Deferred income tax liabilities(Note 24)865,76119,983854,65019,727Accrued severance benefits (Note 15)498,488397,084492,091391,988Other long-term liabilities437,381139,619431,768137,828Total liabilities₩10,882,160₩ 9,376,134$10,742,507$9,255,809<br />Samsung Electronics Co., Ltd.<br />Non-Consolidated Balance Sheets December 31, 2005 and 2004<br />(In millions of Korean won, in thousands of U.S. dollars (Note 3))2005200420052004Commitments and contingencies(Note 17)Shareholders' equityCapital stock (Note 18)Common stock₩ 778,047₩ 778,047$768,062$768,062Preferred stock119,467119,467117,934117,934Capital surplusPaid-in capital in excess ofpar value4,403,8934,403,8934,347,3774,347,377Other capital surplus1,961,4221,927,7731,936,2511,903,034Retained earnings (Note 19)37,365,89230,575,04136,886,36930,182,666(Net income of ₩7,640,213 millionin 2005 and₩10,786,742 millionin 2004)Capital adjustmentsTreasury stock (Note 21)(5,970,778)(4,159,639)(5,894,154)(4,106,258)Others (Note 22)998,667795,827985,851785,614Total shareholders' equity39,656,61034,440,40939,147,69033,998,429Total liabilities &shareholder's equity₩50,538,770₩43,816,543$49,890,197$43,254,238<br />The accompanying notes are an integral part of these non-consolidated financial statements.<br />Samsung Electronics Co., Ltd.<br />Non-Consolidated Balance Sheets December 31, 2006 and 2005<br />(In millions of Korean won, in thousands of U.S. dollars (Note 3))2006200520062005AssetsCurrent assetsCash and cash equivalents₩ 977,989₩ 1,053,552$1,052,733$1,134,07Short-term financial instruments3,335,1413,897,9313,590,0334,195,83(Note 4)Short-term available-for-sale2,058,7811,917,1222,216,1262,063,64securities (Note 5)Trade accounts and notes receivable,net of allowance for doubtful1,842,4391,496,9391,983,2501,611,34accounts (Note 6)Other accounts and notes receivable,net of allowance for doubtful864,669842,828930,752907,24accounts (Note 6)Inventories, net of valuation losses3,219,4742,909,4473,465,5263,131,80(Note 7)Short-term deferred income tax1,155,410907,6801,243,714977,05assets (Note 24)Prepaid expenses and other current1,190,9061,197,8121,281,9231,289,35assetsTotal current assets14,644,80914,223,31115,764,05715,310,34Lease receivables under finance lease223,488269,179240,569289,75(Note 8)Property, plant and equipment,including revaluations, net of28,820,44224,650,19431,023,08126,534,11accumulated depreciation (Note 11)Long-term available-for-sale securities1,148,944977,4091,236,7531,052,10(Note 9)Equity-method investments (Note 10)11,265,0838,891,88012,126,0319,571,45Intangible assets, net of accumulated522,378465,801562,301501,40amortization (Note 12)Long-term deposits and other assets,1,183,9841,060,9961,274,4721,142,08net (Note 13)Total assets₩57,809,128₩50,538,770$62,227,264$ 54,401,25<br />Samsung Electronics Co., Ltd.<br />Non-Consolidated Balance Sheets December 31, 2006 and 2005<br />(In millions of Korean won, in thousands of U.S. dollars (Note 3))2006200520062005Liabilities and Shareholders' EquityCurrent liabilitiesTrade accounts and notes payable₩ 1,869,101₩ 1,867,185$2,011,949$2,009,887Other accounts and notes payable3,291,7972,917,6593,543,3773,140,645Accrued expenses (Note 16)2,873,1482,506,5013,092,7322,698,064Income taxes payable1,111,233789,9251,196,160850,296Other current liabilities489,736264,005527,165284,181Total current liabilities9,635,0158,345,27510,371,3838,983,073Foreign currency notes and bonds87,31795,55793,990102,860(Note 14)Long-term advances received340,033505,950366,020544,618Long-term accrued expenses (Note 16)274,527133,748295,508143,970Deferred income tax liabilities1,158,802865,7611,247,365931,928(Note 24)Accrued severance benefits,net620,469498,488667,889536,586(Note 15)Other long-term liabilities432,368437,381465,413470,808Total liabilities12,548,53110,882,16013,507,56811,713,843Commitments and contingencies(Note 17)Shareholders' equityCapital stock (Note 18)Common stock778,047778,047837,510837,510Preferred stock119,467119,467128,597128,597Capital surplusPaid-in capital in excess of par4,403,8934,403,8934,740,4664,740,466valueOther capital surplus1,963,3511,961,4222,113,4042,111,326Retained earnings (Note 19)(Net income of ₩7,926,087 millionin 2006 and ₩7,640,213 million in44,460,18937,365,89247,858,11540,221,6282005)Capital adjustmentsTreasury stock (Note 21)(7,520,023)(5,970,778)(8,094,750)(6,427,102)Others (Note 22)1,055,673998,6671,136,3541,074,991Total shareholders' equity45,260,59739,656,61048,719,69642,687,416Total liabilities & shareholders'₩ 57,809,128₩50,538,770$62,227,264$54,401,259equity<br />The accompanying notes are an integral part of these non-consolidated financial statements.<br />Samsung Electronics Co., Ltd.<br />Non-Consolidated Statements of Income<br />For the years ended December 31, 2006 and 2005<br />(In millions of Korean won, in thousands of U.S. dollars (Note 3))2006200520062005Sales (Note 26)₩58,972,765₩57,457,670$ 63,479,833$ 61,848,945Cost of sales42,359,75340,158,15045,597,15143,227,287Gross profit16,613,01217,299,52017,882,68218,621,658Selling, general and administrativeexpenses9,679,0799,239,74510,418,8149,945,905Operating profit6,933,9338,059,7757,463,8688,675,753Non-operating incomeInterest and dividend income257,417229,654277,090247,206Commission income315,172366,519339,259394,531Gain on disposal of available-for-salesecurities58,98033,27163,48835,814Gain on disposal of property, plantand equipment78,63641,29184,64644,447Foreign exchange gains403,701399,624434,554430,166Gain on foreign currency translation(Note 28)124,99890,187134,55197,080Gain on valuation of equity-methodinvestments (Note 10)1,798,5051,131,0141,935,9581,217,453Others372,013379,799400,445408,8243,409,4222,671,3593,669,9912,875,521Non-operating expensesInterest expenses48,87742,21452,61245,440Loss on disposal of trade accountsand notes receivable253,740185,536273,132199,716Donations175,249173,563188,643186,828Loss on disposal of available-for-salesecurities3,69121,5333,97323,179Loss on disposal of property, plantand equipment37,87613,51740,77114,550Foreign exchange losses391,831348,804421,777375,462Loss on foreign currency translation(Note 28)28,98831,24431,20333,632Loss on valuation of equity-methodinvestments (Note 10)92,553972,17399,6261,046,473Others94,35372,078101,56577,5851,127,1581,860,6621,213,3022,002,865Ordinary profit9,216,1978,870,4729,920,5579,548,409<br />Samsung Electronics Co., Ltd.<br />Non-Consolidated Statements of Income<br />For the years ended December 31, 2006 and 2005<br />(In millions of Korean won, in thousands of U.S. dollars (Note 3))2006200520062005Extraordinary income₩-₩-$-$-Extraordinary loss----Net income before income tax9,216,1978,870,4729,920,5579,548,409Income tax expense (Note 24)1,290,1101,230,2591,388,7091,324,283Net income₩ 7,926,087₩ 7,640,213$8,531,848$8,224,126Basic earnings per share (Note 25)(in Korean won and U.S. dollars)₩52,880₩49,970$56,921$53,789Diluted earnings per share(Note 25) (in Korean won and U.S.dollars)₩52,120₩49,128$56,103$52,883<br />The accompanying notes are an integral part of these non-consolidated financial statements.<br />Samsung Electronics Co., Ltd.<br />Non-Consolidated Balance Sheets December 31, 2007 and 2006<br />(In millions of Korean won, in thousands of U.S. dollars (Note 3))2007200620072006AssetsCurrent assetsCash and cash equivalents₩ 2,026,791₩ 977,989$2,160,758$1,042,632Short-term financial instruments(Note 4)4,862,8693,335,1415,184,2953,555,587Short-term available-for-salesecurities (Note 5)922,8332,058,781983,8302,194,862Trade accounts and notesreceivable, net of allowance for1,780,5071,842,4391,898,1951,964,221doubtful accounts (Note 6)Other accounts and notes receivable,net of allowance for doubtful813,723864,669867,509921,822accounts (Note 6)Inventories, net of valuation losses3,337,8723,219,4743,558,4993,432,275(Note 7)Short-term deferred income taxassets (Note 24)1,241,6361,155,4101,323,7061,231,780Short-term lease receivables underfinance lease112,29569,348119,71773,932Advanced payments859,713551,479916,538587,931Prepaid expenses407,082400,824433,989427,318Other current assets255,760238,603272,667254,375Total current assets16,621,08114,714,15717,719,70315,686,735Property, plant and equipment,including revaluations, net of29,777,38228,820,44231,745,61030,725,418accumulated depreciation (Note 11)Long-term available-for-sale securities1,936,1761,148,9442,064,1541,224,887(Note 9)Equity-method investments (Note 10)15,008,46211,265,08316,000,49312,009,683Intangible assets, net of accumulated568,316522,378605,881556,906amortization (Note 12)Long-term lease receivables under245,410154,140261,631164,328finance leaseLong-term deposits and other assets,net (Note 13)1,068,4251,183,9841,139,0441,262,244Total assets₩65,225,252₩57,809,128$69,536,516$ 61,630,201<br />Samsung Electronics Co., Ltd.<br />Non-Consolidated Balance Sheets December 31, 2007 and 2006<br />(In millions of Korean won, in thousands of U.S. dollars (Note 3))2007200620072006Liabilities and Shareholders' EquityCurrent liabilitiesTrade accounts and notes payable₩ 1,935,663₩ 1,869,101$2,063,607$1,992,645Other accounts and notes payable2,958,5213,291,7973,154,0743,509,378Accrued expenses (Note 16)4,071,1442,873,1484,340,2393,063,058Income taxes payable1,114,0481,111,2331,187,6841,184,683Other current liabilities722,970489,736770,757522,107Total current liabilities10,802,3469,635,01511,516,36110,271,871Foreign currency notes and bonds,net of current portion (Note 14)83,81587,31789,35593,088Long-term advances received168,650340,033179,797362,509Long-term accrued expenses (Note 16)39,174274,52741,763292,673Deferred income tax liabilities(Note 24)1,508,4491,221,8151,608,1551,302,575Accrued severance benefits, net(Note 15)623,147620,469664,336661,481Other long-term liabilities439,047432,368468,067460,946Total liabilities13,664,62812,611,54414,567,83413,445,143<br />Commitments and contingencies (Note 17)<br />Samsung Electronics Co., Ltd.<br />Non-Consolidated Balance Sheets December 31, 2007 and 2006<br />(In millions of Korean won, in thousands of U.S. dollars (Note 3))2007200620072006Shareholders' equityCapital stock (Note 18)Common stock₩778,047₩778,047$829,474$829,474Preferred stock119,467119,467127,364127,364Capital surplusPaid-in capital in excess of parvalue4,403,8934,403,8934,694,9824,694,982Other capital surplus1,959,6401,963,3512,089,1682,093,125Capital adjustmentsTreasury stock (Note 21)(9,157,492)(7,520,023)(9,762,785)(8,017,082)Stock options475,197539,153506,607574,790Accumulated other comprehensiveincome (Note 23)2,019,195556,9242,152,660593,735Retained earnings (Note 19)50,962,67744,356,77254,331,21247,288,670Total shareholders' equity51,560,62445,197,58454,968,68248,185,058Total liabilities & shareholders'equity₩65,225,252₩ 57,809,128$ 69,536,516$61,630,201<br />The accompanying notes are an integral part of these non-consolidated financial statements.<br />Samsung Electronics Co., Ltd.<br />Non-Consolidated Statements of Income<br />For the years ended December 31, 2007 and 2006<br />(In millions of Korean won, in thousands of U.S. dollars (Note 3))2007200620072006Sales (Note 27)₩63,175,968₩58,972,765$ 67,351,778$ 62,870,752Cost of sales46,846,54642,359,75349,943,01345,159,652Gross profit16,329,42216,613,01217,408,76517,711,100Selling, general and administrativeexpenses10,386,5679,679,07911,073,09910,318,847Operating profit5,942,8556,933,9336,335,6667,392,253Non-operating incomeInterest and dividend income292,983257,417312,349274,432Commission income339,496315,172361,936336,004Gain on disposal of available-for-salesecurities38,51158,98041,05762,878Gain on disposal of property, plantand equipment101,60578,636108,32183,834Foreign exchange gains347,061403,701370,001430,385Gain on foreign currency translation(Note 29)48,573124,99851,784133,260Gain on valuation of equity-methodinvestments (Note 10)2,627,1651,798,5052,800,8161,917,383Others366,690372,013390,926396,6024,162,0843,409,4224,437,1903,634,778Non-operating expensesInterest expenses47,82948,87750,99052,108Loss on disposal of trade accountsand notes receivable284,204253,740302,989270,512Donations182,565175,249194,632186,833Loss on disposal of available-for-salesecurities1,7543,6911,8703,935Loss on disposal of equity methodinvestments26,653-28,415-Loss on disposal of property, plantand equipment55,68537,87659,36640,380Foreign exchange losses457,020391,831487,228417,730Loss on foreign currency translation(Note 29)46,04828,98849,09230,904Loss on valuation of equity-methodinvestments (Note 10)262,28492,553279,62098,671Others110,89394,353118,223100,5881,474,9351,127,1581,572,4251,201,661<br />Samsung Electronics Co., Ltd.<br />Non-Consolidated Statements of Income<br />For the years ended December 31, 2007 and 2006<br />(In millions of Korean won, in thousands of U.S. dollars (Note 3))2007200620072006Net income before income tax₩ 8,630,004₩ 9,216,197$9,200,431$9,825,370Income tax expense (Note 24)1,204,9881,299,7061,284,6361,385,614Net income₩ 7,425,016₩ 7,916,491$7,915,795$8,439,756Basic earnings per share (Note 25)(in Korean won and U.S. dollars)₩49,532₩52,816$53$56Diluted earnings per share(Note 25) (in Korean won and U.S.dollars)₩48,954₩52,057$52$55<br />The accompanying notes are an integral part of these non-consolidated financial statements.<br /> RATIO ANALYSIS PROJECT <br /> ON SAMSUNG<br /> <br /> (FOR THE YEAR 2005/2006/2007)<br /> <br /> <br /> SUBMITTED BY:-<br /> DEEPAK KHANDODIYA<br /> MOHIT ARYA<br /> PRANJAL AERON<br /> PRASOON VARSHNEY<br /> TASAVUR<br /> VARUN VARSHNEY<br /> <br /> <br />