2008 Q3: The Impact of the Global Financial and Economic Crisis on Botswana
2006:Q4: Feature on the New CPI Basket
1. Bifm Economic Review 4th Quarter 2006
Economic Review
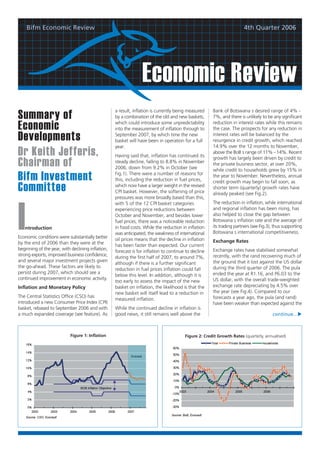
a result, inflation is currently being measured Bank of Botswana s desired range of 4% -
Summary of by a combination of the old and new baskets, 7%, and there is unlikely to be any significant
reduction in interest rates while this remains
Economic which could introduce some unpredictability
into the measurement of inflation through to the case. The prospects for any reduction in
Developments September 2007, by which time the new
basket will have been in operation for a full
interest rates will be balanced by the
resurgence in credit growth, which reached
year. 14.9% over the 12 months to November,
Dr Keith Jefferis, Having said that, inflation has continued its
above the BoB s range of 11% - 14%. Recent
growth has largely been driven by credit to
Chairman of steady decline, falling to 8.8% in November
2006, down from 9.2% in October (see
the private business sector, at over 20%,
while credit to households grew by 15% in
Bifm Investment Fig.1). There were a number of reasons for
this, including the reduction in fuel prices,
the year to November. Nevertheless, annual
credit growth may begin to fall soon, as
Committee which now have a larger weight in the revised
CPI basket. However, the softening of price
shorter term (quarterly) growth rates have
already peaked (see Fig.2).
pressures was more broadly based than this,
with 5 of the 12 CPI basket categories The reduction in inflation, while international
I experiencing price reductions between and regional inflation has been rising, has
October and November, and besides lower also helped to close the gap between
fuel prices, there was a noticeable reduction Botswana s inflation rate and the average of
ntroduction in food costs. While the reduction in inflation its trading partners (see Fig.3), thus supporting
was anticipated, the weakness of international Botswana s international competitiveness.
Economic conditions were substantially better oil prices means that the decline in inflation
by the end of 2006 than they were at the Exchange Rates
has been faster than expected. Our current
beginning of the year, with declining inflation, Exchange rates have stabilised somewhat
forecast is for inflation to continue to decline
strong exports, improved business confidence, recently, with the rand recovering much of
during the first half of 2007, to around 7%,
and several major investment projects given the ground that it lost against the US dollar
although if there is a further significant
the go-ahead. These factors are likely to during the third quarter of 2006. The pula
reduction in fuel prices inflation could fall
persist during 2007, which should see a ended the year at R1.16, and P6.03 to the
below this level. In addition, although it is
continued improvement in economic activity. US dollar, with the overall trade-weighted
too early to assess the impact of the new
Inflation and Monetary Policy basket on inflation, the likelihood is that the exchange rate depreciating by 4.5% over
new basket will itself lead to a reduction in the year (see Fig.4). Compared to our
The Central Statistics Office (CSO) has forecasts a year ago, the pula (and rand)
measured inflation.
introduced a new Consumer Price Index (CPI) have been weaker than expected against the
basket, rebased to September 2006 and with While the continued decline in inflation is
a much expanded coverage (see feature). As good news, it still remains well above the continue...
Figure 1: Inflation Figure 2: Credit Growth Rates (quarterly, annualised)
2. 2 Economic Review
Figure 3: Botswana and Trading Partner Inflation Figure 4: Pula Exchange Rates
dollar, and as a result the pula has been Further investigation, however, reveals that revenues have been rapid growth in revenues
stronger against the rand. the underlying situation may not be quite so from the Southern African Customs Union
encouraging. While overall employment has (which was expected) and from non-mineral
Given the volatility that characterises the
increased by 203,000 over the ten years income tax receipts. On the spending side,
rand, to which the pula is partially pegged,
between the two Labour Force Surveys, more the poor performance of development
predicting exchange rate movements during
than half of this increase (116,000) was due spending is clear — down 13% compared to
2007 is a risky business — probably the most
to a rise in employment in own farms, lands the previous year — especially when compared
reliable forecast is that forecasts will be
and cattle posts . This in turn reflects last with a budgeted 38% increase in 2006/07
wrong. The consensus of opinion is that the
year s relatively good rains and the resulting as a whole.
rand will on average weaken again during
temporary increase in subsistence agricultural
2007; however, South Africa s relatively The 2007 Budget, due to be delivered in
activities. Whether this really counts as
large current account deficit, and early February, will contain final revenue and
employment , however, is questionable,
dependence upon short term portfolio expenditure figures for the full 2005/06 fiscal
as the survey methodology counts as
capital flows to finance it, may well cause year, as well as revised figures for 2006/07
employed someone who did one hour or
the rand to fluctuate widely again. Our and projections for 2007/08. Data for
more of work over a seven day reference
forecast is that the pula will weaken by 2005/06 are likely to show a budget surplus
period. Furthermore, the increase in recorded
around 10% against the dollar during 2007, larger than the P1.5 billion (3% of GDP) that
agricultural employment contrasts with the
to finish the year around 6.70, but will was indicated last year, and likewise a surplus
results of other surveys, which show a long-
remain fairly stable against the rand (at for 2006/07 larger than the P0.9 bn that
term decline.
around 1.16-1.17), albeit with some was initially estimated, with revenue above
fluctuations along the way. The rise in non-agricultural employment has budget and expenditure below. Given the
been less impressive, although at 2.7% poor expenditure performance, the Budget
Employment
annual average growth, it has at least kept Speech will no doubt devote considerable
The Central Statistics Office has released pace with (or slightly exceeded) the growth attention to why government has been
preliminary results from the 2005/06 Labour of the population and the labour force. unable to spend the additional resources
Force Survey (LFS), providing data on Nevertheless, if it had not been for the provided for in 2006/07, especially for
employment and unemployment in fortunate rains during the LFS survey period, development projects, thus inhibiting the
Botswana. The CSO is to be commended for recorded unemployment would most likely anticipated recovery in economic growth. It
getting these preliminary results out quickly have remained between 20% and 30% of is likely that most of these projects will be
after the completion of the survey in June the labour force. carried forward to 2007/08, hopefully
2006. The headline results of the LFS accompanied by concrete measures to
Government Budget
provide encouraging information: since the improve the efficiency of project
previous LFS in 1995/96, overall employment Recent data on government revenue and implementation and public procurement
has been growing rapidly, at an average rate spending are patchy, but the data that are processes. No major policy initiatives are
of 4.7% a year, which is substantially faster available suggest that revenues have been expected in the Budget, although there may
than the growth of the population and the rising at a steady pace, up 15.1% in the first be some indication of the likely response to
labour force. As a result, the measured half of the 2006/07 fiscal year (April- the report of the Business and Economic
unemployment rate has declined, from 21.5% September) compared to the same period in Advisory Council (BEAC), which government
of the labour force in 1995/96 to 17.3% in 2005/06 (see Fig.6). Expenditure rose by only is now considering.
2005/06 (and compares with recorded 7.3% over the same period, leading to a
unemployment rates of 19.5% in the 2001 half-year budget surplus of P2.1billion
Census and 23.8% in the 2002/03 HIES) (see (compared to a P1.3bn surplus in H1
Fig.5). 2005/06). The main drivers of increased continue...
3. 3 Economic Review
Figure 5: Employment & Unemployment Figure 4: Government Revenue & Spending (quarterly)
BoB
Prospects for 2007 developments will contribute positively 2006 should materialise in 2007.
towards economic diversification.
The likelihood of continued above-trend As a result it should be possible to sustain
global economic growth, combined with On the macroeconomic front, inflation should economic growth in the 4%-5% range, not
strong economic performance in South continue to decline slowly and this will in particularly high by Botswana s historical
Africa, should provide a supportive turn provide some room for lower interest standards but reasonably good by the
environment for a continued improvement rates, which will in turn support investment
standards of middle income developing
in Botswana s economic growth and growth. However, it would not be
countries. With population growth estimated
performance. Recent movements in realistic to expect dramatic reductions in
commodity prices have also been favourable, either inflation or interest rates during 2007. at barely over 1%, economic growth at this
with falling oil prices helping to bring down Government finances are likely to remain rate will support a meaningful increase in
inflation, and although other commodity healthy, and the increase in spending on real per capita incomes, as well as a reduction
prices (notably copper and nickel) have also development projects that was expected in in unemployment and poverty.
fallen, they remain above long-term levels
which will support continued mineral
Table 1: Key variables and forecasts
exploration an development in Botswana.
Three major mining-related projects (Tati 2006 2007
Nickel mine expansion and Activox nickel actual / est. forecast
refinery near Francistown, the Dukwe copper
Inflation
mine, and the Martin s Drift diamond mine),
as well as one or more diamond-cutting CPI average 11.6% 7.2%
operations, will be implemented during CPI end of year 8.8% 7.0%
2007, while final decisions will be taken on
at least two others (African Diamonds AK7 Interest Rates
project near Orapa, and the CIC Prime lending end of year 16.5% 16%
Energy/International Power Mmamabula Exchange rates
coal mine and power station project). These
will all provide a boost for various related Rand per Pula end of year 1.16 1.17
activities, including construction, utilities Pula per US$ end of year 6.03 6.67
(water, electricity and telecoms),
Economic Growth 4% 5%
transportation as well as other suppliers of
goods and services. Other exports should Source: Econsult
continue the growth seen in 2006,
supported by the improved competitiveness
that resulted from the devaluations of 2004
and 2005, and textiles should benefit from
the five-year extension to the developing
county concessions under the US Africa Feature:
Growth & Opportunity Act (AGOA)
announced in late 2006. The economy The New Consumer Price Index
should also benefit from the liberalisation
measures in the telecommunications sector
(CPI) Basket
announced in 2006. All of these see following pages
4. 4 Economic Review
Feature:
The New
Consumer Price Index (CPI) Basket
A new CPI basket was introduced in
the October 2006 CPI report from the Central
Statistics Office. The index has a base of
September 2006=100, and replaces the old
will help to make measured price changes
more internationally comparable), and
changes the way in which item substitution
takes place.
additions include new health items (X-rays,
consultations with traditional doctors, hospital
stays), transport (combi fares, car rental),
recreational items (TV decoders, DVDs,
index which had a November 1996 base. computers), education (college & university
Table 2: CPI Basket Coverage
The new basket is derived from expenditure fees) and telecommunications (cellphone
patterns recorded in the 2002/03 Household New Old purchase and call charges, internet caf and
Income and Expenditure Survey (HIES), and Items in basket 384 256 home connections) and funeral costs. Some
therefore updated the previous basket which items have disappeared (e.g. telegrams and
was based on the 1993/94 HIES. Areas surveyed 46 21 safari suits). The main changes for item and
Outlets surveyed 1235 550 group weights include much increased weights
As we had previously commented, the old for fuel (petrol & diesel), restaurant meals,
index and basket had become increasingly Price quotes obtained 30˚000 8 100 medical aid premiums, telecommunications,
problematic as it became more and more leisure goods & services, and clothing. The
out of date, and hence less accurate when Coverage of prices in rural areas has been main reductions in weights have been for
used to measure inflation. A particular enhanced, with 26 rural areas now surveyed, food and alcohol & tobacco. Notwithstanding
problem had the omission of items which compared to 5 in the old basket (see table 3). the latter, beer (consumed in various forms
had recently become important in However, expenditure patterns are dominated and locations) remains the largest single
expenditure patterns (e.g. cellphones and by urban areas (with a 47% weight in total consumption item. Within food consumption,
airtime), but more generally the CPI basket spending) and urban villages (34%), while we are spending proportionately more on
had become less representative of rural areas account for only 19%. Given this, fruit and vegetables, and have shifted meat
expenditure patterns in the economy. Analysis and the expense involved in surveying prices consumption from beef to chicken.
from other countries suggests that this type in rural areas, it is questionable whether such
of problem leads to an upward bias in a large increase in the geographical survey The treatment of rent in the CPI basket has
measured inflation, and hence it is likely that coverage of rural prices is justified. also been much improved. Previously, BHC
the old index was exaggerating Botswana s rentals were used as proxy for almost all
Table 3: Geographical Coverage (No. of rentals, including private rentals, such that
inflation. A second problem had been
areas surveyed) any change in BHC rents — an administered
experienced when items in the basket had
price determined by government — had a
become unavailable, requiring the
˚New Old disproportionate effect on inflation. In the
substitution of new items, and there had
revised basket, the weight of BHC rentals
been a number of errors (and subsequent Urban 5 5
has been reduced and that of private rentals
revisions) in the inflation calculation resulting
Urban village 16 11 significantly increased, to reflect more
from such item substitution.
appropriately the pattern of actual expenditure.
In updating the basket, its coverage has been Rural 26 5
Overall, the new index marks a considerable
considerably expanded in terms of numbers
improvement over the old one, being more
of items included, the number of price quotes There has been extensive change in the items up to date, comprehensive and with
obtained each month, and its geographical making up the basket, and their weights (see improved methodology. It should provide a
coverage (see table 2). This should help the table 4). While the new basket contains 12 more accurate measurement of inflation.
CPI to provide a more representative (and groups, like the old basket, the groups have Nevertheless, it would be particularly helpful
hence more accurate) record of price changes been re-arranged and because of the if the CSO continued recording and
in the economy. The methodology of CPI changed item composition they are not fully calculating inflation using both the old and
calculation has been improved in various comparable between the two baskets. Many
ways; specifically, it uses internationally new items have been introduced, reflecting
agreed criteria for classifying items (which changed lifestyles and economic activities: continue...
5. 5 Economic Review
Feature:
The New Consumer Price Index (CPI) Basket
continued
the new baskets over a period of, say, 12 months, so that a more accurate assessment of the divergence between the two could be
obtained.
Table 4: CPI Basket Weights (total 100)
Old Basket New Basket
(1996) (2006) Change
Increased Weights
Clothing 5.84 7.52 29%
Recreation 1.55 2.22 43%
Telecommunications 1.60 2.97 86%
Fuel (petrol, diesel, paraffin) 3.10 7.74 150%
Medical aid premiums 1.16 5.18 347%
Restaurant & take-away meals 0.35 3.08 780%
Funeral expenses - 1.74 n/a
Reduced Weights
Food (excl. purch. meals) 25.18 21.84 -13%
o/w fruit & vegetables 2.42 2.61 7.9%
o/w beef 4.18 1.79 -57.2%
o/w chicken 0.69 1.33 92.8%
Alcohol & tobacco 13.49 9.29 -31%
o/w beer (incl. chibuku) 9.57 8.21 -14%
Rent 6.88 5.68 -17%
o/w BHC 5.50 1.64 -70%
o/w private 1.38 4.04 193%
Bifm Botswana Limited
Asset Management. Property Management. Private Equity. Corporate Advisory Services.
Private Bag BR 185, Broadhurst, Botswana Tel: +(267) 395 1564. Fax: +(267) 390 0358. Website: www.bifm.co.bw