
Empfohlen
Weitere ähnliche Inhalte
Was ist angesagt?
Andere mochten auch
Andere mochten auch (9)
Ähnlich wie Q1 2009 Earning Report of Advanced Micro Devices
Ähnlich wie Q1 2009 Earning Report of Advanced Micro Devices (20)
Mehr von earningreport earningreport
Mehr von earningreport earningreport (20)
Kürzlich hochgeladen
Kürzlich hochgeladen (20)
Q1 2009 Earning Report of Advanced Micro Devices
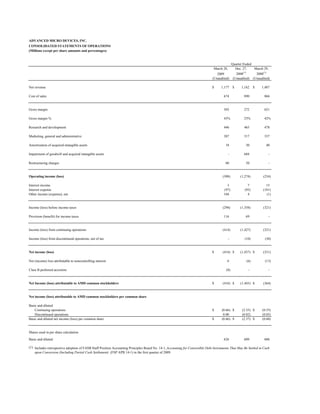
- 1. ADVANCED MICRO DEVICES, INC. CONSOLIDATED STATEMENTS OF OPERATIONS (Millions except per share amounts and percentages) Quarter Ended March 28, Dec. 27, March 29, 2008 (1) 2008 (1) 2009 (Unaudited) (Unaudited) (Unaudited) Net revenue $ 1,177 $ 1,162 $ 1,487 Cost of sales 674 890 866 Gross margin 503 272 621 Gross margin % 43% 23% 42% Research and development 446 465 478 Marketing, general and administrative 287 317 337 Amortization of acquired intangible assets 18 30 40 Impairment of goodwill and acquired intangible assets - 684 - Restructuring charges 60 50 - Operating income (loss) (308) (1,274) (234) Interest income 3 7 15 Interest expense (97) (95) (101) Other income (expense), net 104 4 (1) Income (loss) before income taxes (298) (1,358) (321) Provision (benefit) for income taxes 116 69 - Income (loss) from continuing operations (414) (1,427) (321) Income (loss) from discontinued operations, net of tax - (10) (30) Net income (loss) $ (414) $ (1,437) $ (351) Net (income) loss attributable to noncontrolling interest 6 (6) (13) Class B preferred accretion (8) - - Net Income (loss) attributable to AMD common stockholders $ (416) $ (1,443) $ (364) Net income (loss) attributable to AMD common stockholders per common share Basic and diluted Continuing operations $ (0.66) $ (2.35) $ (0.55) Discontinued operations 0.00 (0.02) (0.05) Basic and diluted net income (loss) per common share $ (0.66) $ (2.37) $ (0.60) Shares used in per share calculation Basic and diluted 626 609 606 (1) Includes retrospective adoption of FASB Staff Position Accounting Principles Board No. 14-1, Accounting for Convertible Debt Instruments That May Be Settled in Cash upon Conversion (Including Partial Cash Settlement) (FSP APB 14-1) in the first quarter of 2009.
- 2. ADVANCED MICRO DEVICES, INC. AMD NON-GAAP AND RECONCILIATIONS TO CONSOLIDATED STATEMENTS OF OPERATIONS(2) (Millions except per share amounts and percentages) Quarter Ended March 28, 2009 Foundry segment and AMD Product intersegment Company (3) eliminations (4) AMD Net revenue $ 1,177 $ -$ 1,177 Cost of sales 701 (27) 674 Gross margin 476 27 503 Gross margin % 40% 43% Research and development 305 141 446 Marketing, general and administrative 252 35 287 Amortization of acquired intangible assets 18 - 18 Restructuring charges 60 - 60 Operating income (loss) (159) (149) (308) Interest income 6 (3) 3 Interest expense (74) (23) (97) Other income (expense), net 129 (25) 104 Income (loss) before income taxes (98) (200) (298) Provision (benefit) for income taxes (1) 117 116 Net income (loss) $ (97) $ (317) $ (414) Net (income) loss attributable to noncontrolling interest 6 Class B preferred accretion (8) Net income (loss) attributable to AMD common stockholders $ (416) (2) The Company believes this non-GAAP presentation makes it easier for investors to understand what AMD financial results would be if it were not required to consolidate the operations of GLOBALFOUNDRIES. (3) Consists of the results of the Computing Solutions and Graphics segments and the All other category. (4) See footnotes 3 and 5 in Selected Corporate Data
- 3. ADVANCED MICRO DEVICES, INC. CONSOLIDATED BALANCE SHEETS (Millions) March 28, Dec. 27, (5) 2008 2009 (Unaudited) Assets Current assets: Cash, cash equivalents and marketable securities $ 2,719 $ 1,096 Accounts receivable, net 414 320 Inventories 539 656 Prepaid expenses and other current assets 254 279 Deferred income taxes 45 28 Total current assets 3,971 2,379 Property, plant and equipment, net 4,137 4,296 Goodwill 323 323 Acquisition related intangible assets, net 150 168 Other assets 471 506 Total Assets $ 9,052 $ 7,672 Liabilities and Stockholders' Equity (Deficit) Current liabilities: Accounts payable $ 497 $ 631 Accrued compensation and benefits 147 162 Accrued liabilities 684 785 Deferred income on shipments to distributors 87 50 Current portion of long-term debt and capital lease obligations 281 286 Other short-term obligations 134 86 Other current liabilities 249 226 Total current liabilities 2,079 2,226 Deferred income taxes 219 91 Long-term debt and capital lease obligations, less current portion 5,282 4,490 Other long-term liabilities 546 569 Noncontrolling interest 1,089 169 Stockholders' equity (deficit): Capital stock: Common stock, par value 7 6 Capital in excess of par value 6,380 6,264 Retained earnings (deficit) (6,667) (6,251) Accumulated other comprehensive income 117 108 Total stockholders' equity (deficit) (163) 127 Total Liabilities and Stockholders' Equity (Deficit) $ 9,052 $ 7,672 (5) Amounts for the year ended December 27, 2008 were derived from the December 27, 2008 audited financial statements, including retrospective adoption of FSP APB 14-1 implemented in the first quarter of 2009.
- 4. ADVANCED MICRO DEVICES, INC. SELECTED CORPORATE DATA (Unaudited) (Millions except headcount and percentages) Quarter Ended March 28, Dec. 27, March 29, Segment and Category Information from Continuing Operations 2009 2008 2008 Computing Solutions (1) Net revenue $ 938 $ 873 $ 1,194 Operating income (loss) $ (36) $ (431) $ (164) Graphics (2) Net revenue 222 270 262 Operating income (loss) 1 (10) 13 Foundry (3) Net revenue 283 Operating income (loss) (141) All Other (4) Net revenue 17 19 31 Operating income (loss) (124) (833) (83) Intersegment eliminations (5) Net revenue (283) Operating income (loss) (8) Total from Continuing Operations Net revenue $ 1,177 $ 1,162 $ 1,487 Operating income (loss) $ (308) $ (1,274) $ (234) Revenue Reconciliation Revenue from continuing operations $ 1,177 $ 1,162 $ 1,487 Revenue from discontinued operations - 8 18 Total revenue $ 1,177 $ 1,170 $ 1,505 Other Data AMD Product Company (excludes Foundry segment and intersegment eliminations) Depreciation and amortization (excluding amortization of acquired intangible assets) $ 105 Capital additions $ 17 Adjusted EBITDA (6) $ 99 Cash, cash equivalents and marketable securities (7) $ 1,599 Total assets (7) $ 4,536 Long-term debt (7) $ 3,711 Headcount 10,511 AMD Depreciation and amortization (excluding amortization of acquired intangible assets) $ 262 $ 271 $ 266 Capital additions $ 84 $ 112 $ 322 Adjusted EBITDA (6) $ 77 $ (284) $ 73 Headcount 13,408 14,652 16,398 See footnotes on the next page
- 5. (1) Computing Solutions segment includes microprocessors, chipsets and embedded processors. (2) Graphics segment includes graphics, video and multimedia products developed for use in desktop and notebook computers, including home media PCs, professional workstations, servers and also includes royalties received in connection with the sale of game console systems that incorporate the Company’s graphics technology. (3) Foundry segment includes the operating results attributable to the front end wafer manufacturing operations and related activities as of the beginning of the first quarter of 2009, which includes the operating results of GLOBALFOUNDRIES from March 2, 2009 through March 28, 2009. Prior periods have not been recast. (4) All Other category includes non-Foundry segment employee stock-based compensation expense and certain operating expenses and credits that are not allocated to the operating segments. Also included in this category are charges for the impairment of goodwill and acquired intangible assets for prior periods, amortization of acquired intangible assets, restructuring and AMD Product Company formation costs associated with GLOBALFOUNDRIES. Details of these significant items are shown below. The All Other category also includes the results of our Handheld business. Employee stock-based compensation expense, ATI acquisition-related charges, restructuring charges and AMD Product Company formation costs associated with GLOBALFOUNDRIES: Quarter Ended Q109 Q408 Q108 Employee stock-based compensation expense $ 17 $ 20 $ 21 Impairment of goodwill and acquired intangible assets - 684 - Amortization of acquired intangible assets 18 30 40 Restructuring charges 60 50 - AMD Product Company formation costs associated with GLOBALFOUNDRIES 21 23 - $ 116 $ 807 $ 61 (5) Represents intersegment eliminations of $283 million in revenue and $275 million in cost of sales and profits on inventory between AMD Product Company and the Foundry segment. (6) AMD reconciliation of net income (loss) attributable to AMD common stockholders to AMD Product Company (excluding Foundry segment and intersegment eliminations) Adjusted EBITDA* Quarter Ended Q109 Net income (loss) attributable to AMD common stockholders $ (416) Net income (loss) attributable to noncontrolling interest (6) Class B preferred accretion 8 Foundry segment and intersegment eliminations net loss 317 AMD Product Company net income (loss) $ (97) Depreciation and amortization 105 Amortization of acquired intangible assets 18 Interest expense 74 Provision (benefit) for income taxes (1) Adjusted EBITDA $ 99 AMD reconciliation of net income (loss) attributable to AMD common stockholders to Adjusted EBITDA* Quarter Ended Q109 Q408 Q108 Net income (loss) attributable to AMD common stockholders $ (416) $ (1,443) $ (364) Impairment of goodwill and acquired intangible assets - 684 - Depreciation and amortization 262 271 266 Amortization of acquired intangible assets 18 30 40 Interest expense 97 95 101 Provision (benefit) for income taxes 116 69 - Income (loss) from discontinued operations, net of tax - 10 30 Adjusted EBITDA $ 77 $ (284) $ 73 (7) Reconciliation of select balance sheet items Cash, cash equivalents and marketable securities Total Assets Long-term debt AMD Product Company $ 1,599 $ 4,536 $ 3,711 Foundry segment and intersegment eliminations 1,120 4,516 1,717 AMD $ 2,719 $ 9,052 $ 5,428 *The Company defines Adjusted EBITDA as net income (loss) attributable to AMD common stockholders adjusted for impairment of goodwill and acquired intangible assets, depreciation and amortization, amortization of acquired intangible assets, interest expense, taxes and discontinued operations. AMD Product Company's adjusted EBITDA is also adjusted for the Foundry segment and intersegment eliminations net income (loss), net income (loss) attributable to noncontrolling interest and class B preferred accretion. The Company calculates and communicates Adjusted EBITDA because management believes it is of interest to investors and lenders in relation to its overall capital structure and its ability to borrow additional funds. The Company’s calculation of Adjusted EBITDA may or may not be consistent with the calculation of this measure by other companies in the same industry. Investors should not view Adjusted EBITDA as an alternative to the U.S. GAAP operating measure of net income or U.S. GAAP liquidity measures of cash flows from operating, investing and financing activities. In addition, Adjusted EBITDA does not take into account changes in certain assets and liabilities as well as interest and income taxes that can affect cash flows.