SlideShare ist ein Scribd-Unternehmen logo
1 von 11
Downloaden Sie, um offline zu lesen
®


 third quarter 2012                                                                                                                                      Published oct ober 2012


Apartment Quarter in Review                                                                                                  All Apartment
                                                                                                                   Quarterly Volume & Pricing Trends
•	 With $25.3b of transaction volume, the apartment
                                                                                                                                          cap rate
   sector recorded the highest quarterly volume since
   Q4’07 when the Archstone privatization closed.                                                 7.5%
   Archstone was also responsible for this period’s
   high volume as Lehman completed the buyout of
   its partners in the deal. Adding $9.4b of volume
                                                                                                  6.5%
   to Q3 results, the transaction is significant in that                                                                                                                                   6.2%
   Lehman was able to fend off rival bidders such as
   EQR and symbolizes the dramatic rebound in
   apartment prices that enabled them to do so.  
                                                                                                  5.5%
•	 Exempting this entity-level transaction, sales of                                                                           Moody’s/RCA CPPI
   significant apartment properties totaled $16.5b in                                               200
   Q3, slightly below Q2 results and just above year
   ago levels. For the year through Q3, transaction
   volume totals $47.0b, up 21% yoy (up 44% inclu-
                                                                                                    150
   sive of the Archstone transaction). Price apprecia-
   tion also slowed and a shift in activity to smaller,
   higher yielding markets caused cap rate averages to
   increase.                                                                                        100
                                                                                                            '06         '07        '08         '09         '10         '11         '12
•	 Trends are more dynamic between the garden and
                                                                                                                               transaction volume
   mid/high-rise sectors. Sales of garden properties                                                          billions
   totaled $10.9 in Q3, up 18% yoy compared to a 9%                                                 $40
                                                                                                                                                        Entity
   yoy decline recorded for mid/high-rise properties.
                                                                                                    $30                                                 Portfolio
   Year-to-date, the trend is reinforced with garden
                                                                                                                                                        Individual
   sales up 24% and mid/high-rise volume up only                                                    $20                                                                                    $25.3
   10%, (all exclusive of the Archstone deal).  
                                                                                                    $10
•	 Rapid price appreciation which had been sustained
   throughout 2010 and 2011 has slowed dramati-                                                       $0
                                                                                                            '06         '07         '08        '09         '10         '11         '12
                                                                                                                           year-over-year change
                       Quarter in Review
 •	 Quarter in Review�����������1              •	   Market Table: Distress �����6                                                                                                    64%
                                                                                                  100%
 •	 Market Table: Q3’12                         •	   Top Transactions ��������������7
    Summary����������������������������3       •	   Top Brokers��������������������������8
 •	 Lender Composition����������4              •	   Selected Transactions����������9
 •	 Distress Update �����������������5                                                          -100%
                                                •	   Notes  Methodology�����11
                                                                                                             '06         '07        '08         '09        '10         '11        '12

©2012 Real Capital Analytics, Inc. All rights reserved. Data believed to be accurate but not guaranteed; subject to future revision; based on properties  portfolios $2.5m and greater.
                                                                                                                                                                                              1
®

 third quarter 2012


                                                                                                              Quarterly Volume  Pricing Trends
   cally in 2012. Many REIT and institutional buyers
   are opting to develop rather than buy at premium                                                                          Garden                              Mid/high-rise
   prices. Other investors are being drawn to the rela-                                                                                       cap rate
   tively higher cap rates available in secondary and                                                 7.5%

   tertiary markets. Apartment sales in the six major                                                 7.0%
   metros fell 23% yoy in Q3 while secondary market                                                   6.5%
   activity rose 21% and tertiary sales surged 54%. The                                               6.0%
   trend is apparent across both the garden and mid/                                                  5.5%                   Major Metro Avg. Cap
   high-rise sectors.                                                                                                        Avg. Cap Rate
                                                                                                      5.0%
                                                                                                              '08      '09     '10      '11    '12         '08   '09   '10     '11     '12
•	 With investors opting to build rather than buy                                                                                    price per unit in thousands
   prime properties combined with the significant                                                     $300
   shift in sales to higher-yielding markets, cap rate                                                $250
   averages took a turn upward in Q3, rising roughly                                                  $200
   20 bps to 6.3%.  While there are plenty of deals trans-
                                                                                                      $150
   acted at 4.0% or lower yields, far more transactions
                                                                                                      $100
   are happening in secondary and tertiary markets
                                                                                                       $50
   where cap rates have average 70 to 140 bps higher                                                          '08   '09       '10       '11   '12          '08   '09   '10    '11     '12
   than in major metros. Thus, the uptick in average                                                                                   transaction volume
   cap rates does not indicate a re-pricing throughout                                                  $20 billions
   the apartment sector. In fact, due to recent declines
                                                                                                        $15
   in mortgage interest rates and a more competitive
   environment among lenders (see page 4), cap rates                                                    $10

   remain under downward pressure.                                                                       $5

•	 Student housing properties remain in high demand             $0
                                                                   '08                                                 '09    '10       '11   '12          '08   '09   '10     '11     '12
   by investors and volume for that niche topped $1.8b
                                                                                                                                      year-over-year change
   through Q3, up 23% yoy. Senior housing transac-           300%
   tions, not included in the apartment sector totals,
                                                             100%
   are off significantly this year chiefly due to few large
   entity or portfolio deals. Sales of individual senior    -100%
   housing properties were actually up a robust 43% in             '08                                                 '09     '10      '11    '12         '08   '09   '10     '11    '12

   Q3 and are up 23% year-to-date.  
                                                     Summary Table
                                                 volume YTD Through Q3'12 vs YOY                                         average pricing YTD Through Q3'12 vs YOY
                                                     $ bil yoy        # props   yoy                                            $/unit % chng          cap     bps
     Apartment Total                                 $55.8         44%                  3,525         37%                    $104,418                4%                6.2%          -25
     Garden                                          $35.0         44%                  2,466         33%                     $82,121                12%               6.3%          -29
     Mid/High-rise                                   $20.8         43%                  1,059         48%                    $190,311               -13%               5.8%           -5
     Major Metros                                    $25.1         38%                  1,493         39%                    $195,323               2%                 5.6%          -20
     Secondary Mkts                                  $24.5         49%                  1,455         33%                     $80,623               16%                6.4%          -21
     Tertiary Mkts                                    $5.9         45%                    484         22%                     $68,398               13%                7.1%          -46
     Student Housing                                  $1.8         26%                      92         6%                    $113,531                -3%               7.0%          -40
     Senior Housing*                                  $5.2        -79%                     423        -73%                   $107,140                -3%               8.7%          -86
                                         * not included in apartment volume or pricing statistics


©2012 Real Capital Analytics, Inc. All rights reserved. Data believed to be accurate but not guaranteed; subject to future revision; based on properties  portfolios $2.5m and greater.
                                                                                                                                                                                             2
®

 third quarter 2012


Market table: Q3’12 Apartment Summary
                                                                         Volume                                                                 Pricing
Transactions Reported                                                YOY                         YOY                           PPU                                     Cap Rate
Closed Through Q3’12                                 Vol ($M)                     # Props                        Low                         High           Low                            High
                                                                    Change                      Change                         Avg                                       Avg
                       Baltimore                          $726.7           74%             26       100%          $40,313      $127,535 $253,725                5.4%          6.9%           9.0%
Mid-                   DC                                1,203.9         239%              35       169%           51,790       284,059   453,774
                       DC MD burbs                       1,214.6           19%             24        -17%          62,366       142,899   418,650              4.6%           6.3%           7.2%
Atlantic               DC VA burbs                       2,478.6           22%             38         12%          98,780       199,936   395,928              5.7%           6.4%           7.0%
                       Philadelphia                        304.1         -26%              22       -27%            15,741        89,397  925,625              4.2%           5.9%           7.0%
                       Pittsburgh                            13.3        -72%               2       -60%           48,408         53,414    61,957             6.7%           7.0%           7.3%
                       Richmond/Norfolk                     313.8        -32%              18       -25%           31,776       104,560    154,167             5.2%           6.1%           7.0%
                       Tertiary Mid-Atlantic                437.6          38%             25          -7%         38,580         82,410  140,899              6.0%           7.5%           9.0%
                       Total                           $6,692.6            32%           190            9%        $15,741     $137,121 $925,625                4.0%           6.5%           9.0%
                       Chicago                           1,005.8          -21%             59         -2%          25,417       148,858   497,738              5.8%           7.5%           8.5%
Midwest                Cincinnati                          146.2           -3%             11       -35%           33,333         56,619  162,295
                       Cleveland                           106.6           65%             12         71%          21,739         41,895  122,321               7.8%          8.6%          10.1%
                       Columbus                            136.0             9%            16         78%            8,125        35,126   152,174
                       Detroit                             300.2         126%              23         53%            9,390        57,300   122,137
                       Indianapolis                         110.6        -25%              10       -38%           32,474         51,842    70,330              6.7%          8.1%           9.5%
                       Kansas City                          237.5          44%             13        -19%          11,333         61,204  114,583               5.8%          7.1%           9.0%
                       Minneapolis                         273.2           37%             23         77%          22,404         93,843  358,333
                       St Louis                             120.7          45%             13       160%           24,630         54,014    86,705             4.2%           6.5%           9.0%
                       Tertiary Midwest                    945.3         162%              82         39%           15,152        60,704   153,125             4.7%           7.3%           8.7%
                       Total                           $3,382.1            25%           262          21%          $8,125      $73,236 $497,738                4.2%           7.5%          10.1%
                       Boston                            1,516.6           57%             76       130%            57,157      201,740   800,000              4.5%           5.5%           6.0%
Northeast              Hartford                              52.6        190%              19       280%           23,435         44,570  122,500
                       Long Island                         228.6         277%               7           0%         83,784       230,190    261,111
                       Manhattan                         5,765.8           49%           299          99%          35,762       329,803 2,666,667               3.0%          5.1%           6.9%
                       No NJ                               582.8         -47%              59         -3%          33,333        111,764  325,153               5.0%          6.0%           8.0%
                       NYC Boroughs                      1,394.6           22%            215         39%          49,123       134,893   903,226               4.5%          7.0%           9.9%
                       Stamford                            303.3         237%              10       100%           47,656       164,525 1,058,824               4.0%          5.9%           7.8%
                       Westchester                           90.4          16%              9           0%         64,286       113,053   150,000               7.2%          7.2%           7.3%
                       Tertiary Northeast                   156.7            2%            28         75%           11,416        55,022   180,198              6.2%          7.4%           9.5%
                       Total                          $10,091.5            35%           722          64%         $11,416     $205,268 $2,666,667               3.0%          6.1%           9.9%
                       Atlanta                           2,361.3           51%           132          25%            5,627        66,171  276,483               4.8%          7.6%           9.9%
Southeast              Broward                              667.7          88%             30         88%          22,159         97,338  454,688               4.5%          6.4%           7.5%
                       Charlotte                           486.9             8%            23         15%          14,527         89,838  208,333               5.0%          6.0%           7.8%
                       Jacksonville                        372.8           32%             26         30%          17,630         55,804   150,195
                       Memphis                              271.6          30%             20           0%           6,641        49,083  102,586               6.3%          7.8%           9.2%
                       Miami                                310.9          86%             40         60%          25,000         92,936  436,042               4.1%          5.8%           7.3%
                       Nashville                           503.9           82%             30       150%           12,017         67,874  170,455               7.0%          7.5%           7.9%
                       Orlando                              701.3          54%             35         21%          15,076         71,726  245,833               5.8%          6.5%           7.5%
                       Palm Beach                          445.5         140%              19         46%          18,750         89,067  180,282
                       Raleigh/Durham                       941.3          58%             41         37%          28,175         97,515  346,721              4.6%           6.0%           7.8%
                       Tampa                               790.8             0%            50           4%         14,946         69,411  156,896              3.7%           6.7%           9.5%
                       Tertiary Southeast                2,451.8           12%           187            1%           9,368        59,989  210,301              5.0%           7.1%          10.8%
                       Total                          $10,305.8            37%           633          21%          $5,627       $69,754 $454,688               3.7%           6.7%          10.8%
                       Austin                            1,575.4         287%              64       121%           27,721       108,485   278,075              4.7%           6.1%            7.1%
Southwest              Dallas                             2,119.1          16%           148          22%          11,407         54,991  269,266              6.0%           7.3%           9.1%
                       Denver                            1,569.2           88%             71         27%          30,303       100,951   251,563              5.3%           6.3%           7.6%
                       Houston                           1,642.7           17%            111         17%          11,656         76,361  159,033              5.4%           6.0%           6.6%
                       Phoenix                           2,076.9           57%           109          14%           16,185        74,197  366,667              3.6%           6.3%           8.6%
                       San Antonio                         481.4           16%             37         95%          44,401         75,889   115,702             4.4%           5.7%           7.0%
                       Tertiary Southwest                1,268.6         101%            104          68%           16,129        74,398  143,049              4.7%           7.4%          10.3%
                       Total                          $10,733.4            57%           644          35%         $11,407       $79,470 $366,667               3.6%           6.7%          10.3%
                       East Bay                            786.7           -8%             50         22%          40,476       154,224   277,083              4.8%           5.8%           7.2%
West                   Inland Empire                       572.8             2%            32         -6%          28,527       105,540   243,243              5.0%           5.8%           6.6%
                       Las Vegas                           328.7            -1%            29         32%           12,153        42,207    96,739             6.5%           7.7%           9.3%
                       Los Angeles                       4,286.0           60%           350          48%          31,600       169,469   802,857              3.0%           5.4%           9.5%
                       Orange Co                         1,024.0         170%              43         72%         105,269       242,745    487,106             4.5%           5.5%           6.6%
                       Portland                            489.3           10%             32         39%          38,362        117,123   240,718             4.5%           6.5%           8.9%
                       Sacramento                          424.0         100%              28       100%           24,600         89,792   310,714             5.3%           6.1%           8.5%
                       Salt Lake City                        52.6            5%             7         17%
                       San Diego                          1,147.4        171%              71         78%          65,789        139,795     466,667            4.1%          5.8%           7.7%
                       San Francisco                     1,236.7           10%           122        -22%           86,111        217,957     664,000            3.3%          5.2%           7.1%
                       San Jose                          1,109.7         227%              47       213%          113,571        251,029     553,991            3.7%          5.1%           9.0%
                       Seattle                           1,725.2           63%             93         58%          32,461        151,307     417,550            4.0%          5.2%           6.5%
                       Tertiary West                     1,046.6           92%             77         35%          23,810        133,952     540,323            3.3%          6.0%           9.3%
                       Total                            $14,229.5          58%            981         34%         $12,153       $146,413    $802,857            3.0%          5.6%           9.5%
                       US Other                            350.3           50%             93       675%
                       Total US                         $55,785.1          44%          3,525         37%          $5,627       $104,418 $2,666,667             3.0%          6.2%          10.8%
©2012 Real Capital Analytics, Inc. All rights reserved. Data believed to be accurate but not guaranteed; subject to future revision; based on properties  portfolios $2.5m and greater.
                                                                                                                                                                                                  3
®

 third quarter 2012


 Apartment Lender Composition
•	 With	 interest	 rates	 on	 long	 term,	 fixed	 rate	 deals	 now	
                                            	                                                              Apartment Lender Composition H1’12
   averaging	 below	 4.0%	 and	 better	 rates	 to	 be	 had	 for	
                                                                                                                      CMBS                                    Financial
   shorter	term	and	floaters,	positive	leverage	is	achievable	
                        	                                                                                             Gov't Agency                            Insurance
   for	all	but	the	lowest	cap	rate	deals.		The	agencies	continue	
                                            	                                                                         Int'l Bank                              Nat'l Bank
   to	dominate	originations,	but	their	market	share	is	slowly	                                                        Reg'l/Local Bank                        Pvt/Other
   declining	as	other	lenders	ramp	up	activity.
                                                                                                                           All Apartment Past 5 Years
•	 The	government	agencies	accounted	for	64%	of	all	mul-
     	                                                                                                   H1'12                                 64%                       8%      8%       10%
   tifamily	 mortgage	 originations	 in	 the	 first	 half	 of	 2012,	
                                               	
   down	from	68%	in	2011.	The	agencies	remain	very	aggres-
                               	                                                                          2011                                 68%                         8%             10%
   sive	 and	 are	 increasingly	 packaging	 their	 multifamily	
   loans	into	securitizations.		To	date	this	year,	Freddie	and	                                           2010                                  76%                            4%         9%
   Fannie	have	securitized	$23b	of	multi-family	loans,	well	
   ahead	of	the	$17b	of	issuance	for	all	of	2011.		Freddie	has	                                           2009                                     87%                                      6%

   been	 most	 active	 and	 recently	 completed	 its	 14th	 issue	
   this	year.		                                                                                           2008      8%                       61%                            10%          13%


•	 There	 are	 few	 areas	 where	 the	 agencies	 do	 not	 have	 a	
    	
                                                                                                                             By Apartment Subtypes
   majority	 market	 share	 such	 as	 for	 mid/high-rise	 prop-
   erties,	 where	 insurance	 companies	 and	 banks	 are	 more	                                        Garden                                    76%                             7% 6% 5%
                                            active.	 	 Agen-
       Commercial Mortgage Rates cies	 are	 also	 less	                                              Mid/high-
                                                                                                                     8%                  48%                    13%       8%          17%
                       Commercial                                                                      rise
                       Multifamily          dominant	 in	 the	
                                                                                                      Student
       7.0%                                 Northeast,	 where	                                          Hsg
                                                                                                                    13%                                70%                          5%
       6.5%
                                            regional	and	local	
       6.0%
       5.5%
                                            banks	have	a	27%	                                                     By Major, Secondary and Tertiary Markets
       5.0%                                 share	 of	 multi-
                                                                                                         Major
       4.5%                                 family	lending.		                                            Metro
                                                                                                                    5%                     59%                      8%      9%        16%
        4.0%
       3.5%                                     •	 Private	 label	                                 Secondary                                   71%                             11%
             2009       2010      2011      2012
                                                CMBS	 has	 not	
       Fixed rate loans with 7-10 year terms
    Tixed rate loans with 7-10 year terms       been	very	impact-                                      Tertiary                                      80%
   ful	on	the	multifamily	lending	landscape,	so	far	account-
    3-month average

   ing	 for	 just	 3%	 of	 originations	 this	 year	 and	 last.	 	 The	
                                                                    	                                                                   By Region
   CMBS	 conduits	 have	 a	 greater	 penetration	 in	 lending	
   for	 student	 housing	 properties	 and	 also	 in	 the	 Midwest	                                  Northeast        9%                  47%                 7%     7%           27%

   region.		
                                                                                                  Mid-Atlantic                                    81%                                6%
•	 Many	banks	have	returned	to	commercial	property	lend-
   ing	 again	 and	 their	 share	 of	 multifamily	 originations	                                    Southeast                                    76%                             9%
   increased	to	19%	in	the	first	half	of	2012	compared	to	16%	
                             	
   in	2011.		Much	of	that	activity	has	been	in	the	major	met-                                         Midwest       8%                                70%                        6%
   ros	as	well	as	a	concentration	in	the	Northeast	and	West.	  	
   Banks	are	also	active	in	construction	financing	which	is	
                                             	                                                     Southwest                                     75%                             9% 5%
   not	included	in	this	analysis.		
                                                                                                         West                              67%                           12%        11% 6%
•	 In	 tertiary	 markets,	 the	 agencies	 remain	 the	 primary	
   lender	 and	 account	 for	 80%	 of	 all	 apartment	 property	
   loans.		

©2012 Real Capital Analytics, Inc. All rights reserved. Data believed to be accurate but not guaranteed; subject to future revision; based on properties  portfolios $2.5m and greater.
                                                                                                                                                                                                 4
®

 third quarter 2012


Distress update
•	 Defaults	and	transfers	to	special	servicing	of	loans	                                                           Cumulative DistressDistress
                                                                                                                        Cumulative for Apartment
   for	 apartment	 properties	 totaled	 $660m	 in	 Q3’12,	                                                           for Apartment Properties
                                                                                                                              Properties
   the	lowest	since	2007.	Most	of	the	newly	distressed	                                        $90       billions
   situations	 are	 resulting	 from	 maturity	 defaults	                                       $80                   Troubled
   of	 CMBS	 loans.	 Workout	 activity	 fell	 to	 $2.4b	 in	                                                         REO
                                                                                               $70                   Restructured
   Q3’12,	resulting	in	a	significant	decline	in	outstand-
                               	                                                                                     Resolved
                                                                                               $60
   ing	 distress.	 Year-to-date	 outflows	 have	 exceeded	
                                     	
                                                                                               $50
   inflows	by	$5.2b.
       	
                                                                                               $40
•	 At	the	end	of	Q3’12,	a	total	of	$30.9b	of	mortgages	                                        $30
   on	 apartment	 property	 remained	 distressed	 with	                                        $20
   $20.9b	in	the	workout	process	and	$10.0b	converted	                                         $10
   to	REO.	Throughout	the	cycle,	a	total	of	$81.8b	of	
              	                                                                                  $0
   apartment	 property	 has	 become	 distressed,	 and	                                                 1 2 3 4 1 2 3 4 1 2 3 4 1 2 3 4 1 2 3
   to	date,	63%	of	that	total	has	been	resolved.	Banks	                                               '08      '09     '10     '11     '12

   and	other	lenders	are	much	farther	along	at	work-
   ing	out	distressed	situations	while	just	51%	of	dis-                                                       Quarterly AdditionsAdditions and to
                                                                                                                      Quarterly and Reductions
                                                                                                                      Reductions to Distress
                                                                                                                             Distress
   tressed	CMBS	loans	have	been	resolved.
                                                                                                          billions
                                                                                                 $15
                         Summary by Lender Type                                                                                                                  Newly Troubled
                               Outstanding         % Chg        Worked         RR*                                                                               Worked out
                                                                                                                                                                 Net Change
                              Distress ($M) vs Q1'11            Out (%)         (%)              $10
    CMBS                            $14,820           -14%           51%         74%
    Int'l Bank                       $1,250             2%           75%         72%               $5
    Domestic Bank                    $8,201           -19%           66%         68%
    Insurance                          $382           -33%           81%         83%
                                                                                                   $0
    Gov't Agency                     $1,120           -31%           67%         64%
    Other                            $5,116           -14%           72%         70%
    All Apartments                  $30,888           -16%           63%         70%             -$5
    * recovery rate before costs and fees

                                                                                                -$10
•	 The	recovery	rate	on	liquidations	of	defaulted	apart-
    	                                                                                                      1 2 3 4 1 2 3 4 1 2 3 4 1 2 3 4 1 2 3
   ment	loans	was	70%	as	of	Q3,	yet	greater	recoveries	                                                   '08      '09     '10     '11     '12
   have	 been	 available	 for	 mid/high-rise	 properties	
   (85%),	 especially	 in	 the	 gateway	 cities	 (see	 “Q3’12	                                                 % of Sales Associated with Distress
                                                                                                           % of Sales Associated with Distress
   Recovery	Rates”,	published	October	10).	                                                               billions
                                                                                                   $4                                                                                      35%
                                                                                                                      Distress
•	 Year-to-date,	 outstanding	 distress	 is	 down	 in	                                                                                                                                     30%
                                                                                                                      % of Total
                                                                                                   $3                                                                                      25%
   almost	 every	 US	 market.	 	 Several	 large	 markets	                                                             Sales
   have	worked	out	more	than	80%	of	identified	dis-
                                                 	                                                                                                                                         20%
                                                                                                   $2
   tress	 including	 Washington	 DC,	 DC/VA	 burbs,	                                                                                                                                       15%
   San	 Francisco,	 San	 Jose,	 Broward,	 and	 Nashville.	                                         $1                                                                                      10%
   Markets	resolving	the	most	distress	in	2012	include	                                                                                                                                    5%
   those	that	had	been	among	the	most	illiquid	such	                                               $0                                                                                      0%
   as	Atlanta,	Phoenix,	Las	Vegas,	Baltimore	and	ter-                                                     1 2 3 4 1 2 3 4 1 2 3 4 1 2 3 4 1 2 3
   tiary	markets	in	the	Southeast.                                                                       '08     '09     '10     '11     '12

©2012 Real Capital Analytics, Inc. All rights reserved. Data believed to be accurate but not guaranteed; subject to future revision; based on properties  portfolios $2.5m and greater.
                                                                                                                                                                                                5
®

 third quarter 2012

Market table: Distress and workouts
                                                                   Current Outstanding Distress                                                                          Recent Trends
                                                                                                                                                                       YTD Through Q3’12
Current Known Distress                        Cumulative in Default/                 Total    Worked Out     %                                     Recovery
Through October 24, 2012                        Total    Special Serv Held as REO Outstanding   Total    Worked Out                                  Rate            Inflows        Workouts
                     Baltimore                    1,045.1             169.3             15.8           185.1            859.9             82%              87%            386.1               416.0
Mid-                 DC                              718.2             51.4              4.0            55.4            662.8             92%              83%                -                 8.8
                     DC MD burbs                   1,615.4            339.8                -           339.8         1,275.5              79%              77%             20.3               250.7
Atlantic             DC VA burbs                  1,353.8                 -             32.8            32.8          1,321.0             98%              88%             56.0               226.0
                     Philadelphia                    981.8            498.3             34.0           532.3            449.5             46%              74%                -                21.6
                     Pittsburgh                      156.4             20.2              1.9            22.1            134.4             86%              96%                -                 7.8
                     So NJ                           250.2             84.2                -            84.2            166.0             66%              97%                -                82.9
                     All Others                      689.1            204.3             72.7           277.1            412.0             60%              84%            104.6               162.0
                     Mid-Atlantic                $6,809.9         $1,367.5           $161.2         $1,528.8        $5,281.2              78%              83%           $567.0            $1,175.9
                     Chicago                      2,447.7             734.9           217.3            952.3         1,495.5              61%              68%             56.0               148.5
Midwest              Cincinnati                      248.3             62.8             14.4            77.3            171.1             69%              74%                -                52.5
                     Cleveland                       312.7             56.1              2.6             58.6           254.1             81%              56%              4.1                66.3
                     Columbus                        577.6            222.6           101.8             324.4           253.2             44%              65%             49.4                55.5
                     Detroit                         792.3             97.1           214.2             311.3           481.0             61%              43%              5.3                82.1
                     Indianapolis                    470.7            143.7             83.6            227.3           243.5             52%              65%             14.9                33.3
                     Kansas City                     263.8             78.4             17.3             95.7           168.1             64%              78%             48.3                43.7
                     Milwaukee                       228.7              8.5            121.1            129.6            99.1             43%              68%              5.8                3.5
                     Minneapolis                      91.8             24.2              5.7             29.8            62.0             68%              70%              7.1                2.3
                     St Louis                        255.1            112.4             64.7            177.1            78.0             31%              72%             28.1               18.6
                     All Others                   1,089.6             394.2           100.7            494.9            594.7             55%              63%             53.1              107.6
                     Midwest                     $6,778.6         $1,934.8          $943.5          $2,878.3        $3,900.3              58%              64%           $272.1             $613.7
                     Boston                          604.4             70.4           155.9            226.3            378.0             63%              77%             11.0               31.7
Northeast            Hartford                        174.6             39.8             18.1             57.8           116.8             67%                               6.0                17.4
                     Long Island                      59.1                -                -               -             59.1            100%                              22.5                22.5
                     Manhattan                   10,005.0           5,198.0           284.3          5,482.4         4,522.7              45%              89%            116.6             1,412.6
                     No NJ                           865.9            160.5           343.6            504.1            361.8             42%              90%              3.9                24.4
                     NYC Boroughs                 1,092.5             387.0             82.5           469.5            623.0             57%              93%             14.4               118.3
                     Stamford                        254.2             24.1              9.3             33.3           220.9             87%                               0.4               50.0
                     Westchester                      71.4              5.9                -              5.9            65.5             92%             64%                 -                  -
                     All Others                      303.7            100.3             38.2            138.5           165.2             54%             76%               7.4                12.2
                     Northeast                  $13,430.9         $5,986.1           $931.9         $6,917.9        $6,513.0              48%             89%           $182.2         $1,689.2
                     Atlanta                      4,505.2             589.8           929.7          1,519.6         2,985.6              66%             65%             248.4           615.6
Southeast            Broward                      1,568.9             197.7             73.4           271.1          1,297.8             83%             57%               2.0           199.2
                     Charlotte                    1,206.0             506.0             88.8           594.8            611.2             51%             78%             462.4           322.4
                     Jacksonville                  1,047.7            303.6           138.9             442.5           605.2             58%             55%              47.6               106.2
                     Miami                        3,329.5             550.5           946.3           1,496.8        1,832.7              55%             62%              85.3           218.5
                     Nashville                       547.7             54.3             13.1            67.4            480.3             88%             59%                 -           173.5
                     Orlando                      2,415.0             294.3           366.5            660.8          1,754.1             73%             62%              41.2           122.8
                     Palm Beach                   1,660.4             451.6           177.2            628.7          1,031.7             62%             64%             198.2            79.5
                     SW Florida                    1,414.1            256.3             61.9           318.2         1,095.9              77%             52%              33.6           100.9
                     Tampa                         2,116.9            380.1           217.8            597.8          1,519.1             72%             60%              58.4           155.8
                     All Others                   5,839.6          1,465.4            811.0          2,276.4         3,563.2              61%             73%             551.5           608.0
                     Southeast                  $25,651.1         $5,049.6         $3,824.6         $8,874.1       $16,776.9              65%             65%          $1,728.8        $2,702.6
                     Austin                          967.1            286.7             12.0            298.7           668.3             69%             68%              70.6            95.7
Southwest            Dallas                       2,816.4             688.2           326.0          1,014.3          1,802.1             64%             74%             369.7           362.7
                     Denver                          722.5            235.8             12.8           248.6            473.9             66%             80%                 -            58.8
                     Houston                      3,061.2             813.1           625.0          1,438.1          1,623.1             53%             71%             201.1           354.4
                     Phoenix                      4,820.8           1,081.7           586.2          1,668.0          3,152.8             65%             65%             178.5           477.0
                     San Antonio                     578.6            176.8             15.0           191.8            386.9             67%             94%              38.8            89.5
                     All Others                    1,701.3            508.8           109.9            618.7         1,082.7              64%             69%             173.0           263.1
                     Southwest                  $14,667.9         $3,791.2         $1,686.9         $5,478.0        $9,189.9              63%             68%          $1,031.6        $1,701.2
                     Central CA                      338.2            106.8             36.4           143.2            195.0             58%             65%               6.3            34.6
West                 East Bay                        548.4             52.4           161.0             213.3           335.1             61%             79%                 -                 7.8
                     Hawaii                           57.5                -             29.5             29.5            28.0             49%            100%                 -                   -
                     Inland Empire                   835.0            292.3           115.7            408.0            427.0             51%             78%               7.4                26.5
                     Las Vegas                    3,870.8          1,043.2          1,082.5           2,125.7         1,745.1             45%             59%             133.3               514.6
                     Los Angeles                  2,927.2             431.1           275.1             706.3        2,221.0              76%             85%              82.1               331.1
                     Orange Co                       533.1            108.0                -            108.0           425.2             80%             83%              22.9                 0.8
                     Portland                        296.8             95.6             13.6            109.2           187.6             63%             93%               1.6                43.7
                     Reno                            440.5             46.1           198.9            245.1            195.4             44%             64%              31.2           112.0
                     Sacramento                      726.0            173.5             28.2           201.7            524.3             72%             73%              47.9           119.8
                     San Diego                       571.3             46.9             14.5            61.4            509.9             89%             86%               1.7            11.3
                     San Francisco                2,154.6              98.6             67.3           165.9         1,988.7              92%             87%               4.0           230.2
                     San Jose                        453.0              2.2              2.0             4.2            448.7             99%             78%                 -             3.1
                     Seattle                       1,273.1            150.9           515.7            666.6            606.4             48%             82%               8.3            59.1
                     All Others                      497.8            243.6             26.6           270.2            227.6             46%             76%              27.7            60.9
                     West                       $15,523.4         $2,891.2         $2,567.2         $5,458.4       $10,065.0              65%             77%           $374.2         $1,555.4
©2012 Real Capital Analytics, Inc. All rights reserved. Data believed to be accurate but not guaranteed; subject to future revision; based on properties  portfolios $2.5m and greater.
                                                                                                                                                                                                 6
®

 third quarter 2012


top Apartment transactions of Q3’12
                                                   Top 25 Property Sales by Investment Volume
                        Transaction                              Location          Inv Vol ($M)*      Units          PPU                                     Buyer
   1 Waterfront at Pu'uloa                                 Ewa Beach, HI                 $311.0           1,461      212,868 Carmel Partners
   2 Apthorp (Bulk Condo)                                  New York, NY                   215.1†            110 2,606,773 AREA Property Partners
   3 The Beatrice                                          New York, NY                   280.0             301      930,233 Equity Residential
   4 Savoy Park                                            New York, NY                   216.0           1,802      119,867 LM Development Partners JV Citigroup
   5 Howard Crossing                                       Ellicott City, MD              186.0           1,350      137,778 Home Properties
   6 Oak Grove Village                                     Melrose, MA                    175.0             550      318,182 GID
   7 Mass Court                                            Washington, DC                 168.4             371      453,774 TIAA-CREF
   8 Georgian Towers                                       Silver Spring, MD              168.0             890      188,764 Pantzer Properties
   9 The Block                                             Austin, TX                     165.0             669      246,637 American Campus Communities
 10 Sussex at Kingstowne                                   Alexandria, VA                 125.5             556      225,719 Praedium Group JV Milestone Group
 11 Club Laguna                                            Laguna Beach, CA               120.8             421      286,936 Invesco RE
 12 The Brewster                                           New York, NY                     98.0            144      680,556 Cornerstone RE Advisers JV Adelco
 13 The Electra                                            New York, NY                     95.0            163      582,822 Carmel Partners
 14 Archstone Legacy Place                                 Dedham, MA                       94.3            285      330,702 Archstone
 15 Legacy Apartment Homes                                 San Diego, CA                    91.0            412      220,874 RV Management Corp
 16 Canyon Creek                                           Bothell, WA                      90.7            558      162,616 Greystar RE Partners
 17 Landmark at Ontario Towne Center                       Ontario, CA                      90.5            469      192,964 Camden Property Trust
 18 Hamptons at Town Center                                Germantown, MD                   90.3            768      117,513 AHC
 19 Highpoint Apartments                                   Quincy, MA                       88.0            394      223,350 Berkshire Property Advisors
 20 Avalon Arlington Heights                               Arlington Heights, IL            87.3            409      213,325 John Hancock
 21 Waterford                                              Hayward, CA                      86.5            544      159,007 Kennedy Wilson JV
 22 Mantena                                                New York, NY                     84.0              98     857,143 Equity Residential
 23 Circa Green Lake                                       Seattle, WA                      83.1            199      417,550 TIAA-CREF
 24 88 Lexington Avenue                                    New York, NY                     82.0            180      455,556 Westbrook Partners
 25 Preserve at Travis Creek                               Austin, TX                       79.5            608      130,757 Heitman


                                                                           Top 10 Portfolio Sales
                        Transaction                              Location          Inv Vol ($M)*      Units          PPU                                     Buyer
   1 Archstone                                             Multiple                    $8,765.6†        67,962       242,783 Lehman Brothers Holdings Inc
   2 Campus Acquisitions Merger                            Multiple                       627.0           2,210      283,710 American Campus Communities
   3 Kushner MD APT Portfolio '12                          Multiple, MD                   125.0†          5,517       90,629 Kushner Companies
   4 UDR/DRA Advisors Apt Portfolio 2012                   Multiple                       431.0           4,454      106,870 DRA Advisors JV Milestone Group
   5 Landmark Apt Portfolio 12                             Multiple                          n/a          5,353           n/a Apartment Trust of America
   6 35 Building Pinnacle Note Sale                        New York, NY                   139.2           1,029      140,914 Heritage Realty JV Dune Capital Mgmt
   7 Lynd JV Florida Value Partners CVI Portfolio          Multiple                       141.0           2,990       47,157 Lynd JV Florida Value Partners
   8 State Street Development Apt Portfolio 2012           Multiple, MA                   115.9             849      136,523 Preservation of Affordable Housing
   9 Aires Portfolio                                       New York, NY                     51.0†           328      310,976 Vornado Realty Trust
 10 Laurel Square I  II                                   Laurel, MD                     102.0             982      103,870 Hampshire Properties

 * When prices are not known, estimated prices are used in the ranking but are not shown. In the case of partial interest deals, the pro-rated share of the property was used for the
 transaction price and the PPU/PPSF was based on the full 100% price.
 † Partial Interest


©2012 Real Capital Analytics, Inc. All rights reserved. Data believed to be accurate but not guaranteed; subject to future revision; based on properties  portfolios $2.5m and greater.
                                                                                                                                                                                           7
®

 third quarter 2012


top Apartment Brokers through Q3’12
                                                                                              top 25 By investment volume
       By Region*                                             Garden                                         Mid/high-rise                                               All Apartment
          Mid-Atlantic                                               CBRE     7,176,568,723                                 CBRE        2,055,429,604                                   CBRE     9,231,998,327
                CBRE                           Apartment Realty Advisors      3,083,401,450                                   HFF       1,220,595,193             Apartment Realty Advisors      3,763,506,862
   Apartment Realty Advisors                           Marcus  Millichap     2,941,390,658                       Eastdil Secured       987,086,801                       Marcus  Millichap     3,710,873,661
       First Capital Realty                        Cushman  Wakefield        1,690,450,425                   Marcus  Millichap        769,483,003                                       HFF    2,649,720,198
            Moran  Co                                                HFF     1,429,125,005           Apartment Realty Advisors         680,105,412                   Cushman  Wakefield        2,254,441,767
        Marcus  Millichap
                                                        Hendricks  Ptnrs     1,194,421,846               Cushman  Wakefield           563,991,342                               Moran  Co     1,524,728,841
             Midwest                                           Moran  Co     1,077,826,506                  Jones Lang LaSalle         497,975,000                           Eastdil Secured    1,522,644,801
                CBRE                                  Jones Lang LaSalle      672,705,771                         Massey Knakal         495,161,244                        Hendricks  Ptnrs     1,286,897,343
        Marcus  Millichap                                 Eastdil Secured    535,558,000                             Moran  Co        446,902,335                      Jones Lang LaSalle      1,170,680,771
                 HFF
                                                    Colliers International    387,710,497               Rosewood Realty Group           444,573,500                     Colliers International   584,576,497
            Moran  Co
                                                             Transwestern     348,887,285                 Prince Realty Advisors        280,000,000                           Massey Knakal      519,661,244
        Hendricks  Ptnrs
                                                  Engler Financial Group      289,425,000                    Besen  Associates         222,320,000                  Engler Financial Group      454,275,000
            Northeast                                  First Capital Realty   279,550,500                   Colliers International      196,866,000                 Rosewood Realty Group        449,573,500
          Eastdil Secured
                                                              Grubb  Ellis   183,749,968                  Eastern Consolidated         177,706,876                             Transwestern     348,887,285
                CBRE
                                            Newmark Grubb Knight Frank        177,241,875                Engler Financial Group         164,850,000                       First Capital Realty   341,420,500
          Massey Knakal
                                                        Lee  Associates      121,600,000                Ariel Property Advisors        95,082,545                    Prince Realty Advisors     280,000,000
                 HFF
    Rosewood Realty Group
                                                    Friedman Integrated             #REF!                         Portman Realty        95,000,000                               Grubb  Ellis   227,150,968
                                                                NAI Global    113,448,979                      Hendricks  Ptnrs        92,475,497                       Besen  Associates      222,320,000
            Southeast
                                            Southeast Apartment Partners      101,181,000                Multi Investment Group         79,150,000              Newmark Grubb Knight Frank       194,291,875
                CBRE
                                                            Cassidy Turley    90,383,883                         Arroyo  Coates        75,801,750                     Eastern Consolidated      177,706,876
   Apartment Realty Advisors
     Cushman  Wakefield
                                                          Kidder Mathews      87,145,743                 GFI Capital Resources          70,244,774                                 NAI Global    137,283,979
       Jones Lang LaSalle                     Houston Income Properties       85,170,396                               Alain Pinel      67,838,304                   Rockwood RE Advisors        130,161,688
     Engler Financial Group                                          Kislak   83,520,420                      First Capital Realty      61,870,000                           Kidder Mathews      122,900,743
                                                         Sperry Van Ness      80,708,000                                   Studley      56,000,000                         Lee  Associates      121,600,000
           Southwest
                CBRE                              Rockwood RE Advisors        76,850,000                 Rockwood RE Advisors           53,311,688                     Friedman Integrated             #REF!
   Apartment Realty Advisors                                             $0.0     $4.0         $8.0                             $0.0      $1.0          $2.0                                $0.0      $5.0       $10.0
                 HFF                                                     Billions                                                Billions                                                    Billions
        Marcus  Millichap
            Moran  Co                                                                  top 15 By number of Properties
                West                                          Garden                                        Mid/high-rise                                                All Apartment
        Marcus  Millichap
                CBRE
                                                                  CBRE                350                    Marcus  Millichap                  71                                    CBRE              397
     Cushman  Wakefield                             Marcus  Millichap               260                        Massey Knakal                   65                       Marcus  Millichap             331
            Moran  Co                        Apartment Realty Advisors               129                                   HFF                  59                Apartment Realty Advisors             151
        Hendricks  Ptnrs                            Hendricks  Ptnrs                108                                  CBRE                  47                       Hendricks  Ptnrs              113
                                                 Cushman  Wakefield                   81               Rosewood Realty Group                    47                                       HFF            109
 *ranked by investment volume
                                                                     HFF               50                   Besen  Associates                   28                   Cushman  Wakefield                101
                                                   Colliers International              33             Apartment Realty Advisors                  22                           Massey Knakal               66
        Methodology                                          Moran  Co                33                Cushman  Wakefield                     20                  Rosewood Realty Group                48
  Full credit assigned to sellers’                       Transwestern                 30                        Eastdil Secured                 19                      Jones Lang LaSalle               42
   representative. When two brokers
                                                    Jones Lang LaSalle                 29                  Eastern Consolidated                  19                     Colliers International            40
   represent same seller, both sellers’
   representatives assigned full                              NAI Global               26                   Jones Lang LaSalle                   13                               Moran  Co              40
   credit. For partial-interest, rankings                  Grubb  Ellis               24                                  HPNY                  11                                NAI Global             30
   are based on the pro-rated share         Newmark Grubb Knight Frank                 18                             Alain Pinel                10                            Transwestern               30
   of the total property or portfolio
   value. For more information                           Keller Williams               14                GFI Capital Resources                    9                          Eastdil Secured              29
   on rankings please visit www.                 Brown Realty Advisors                 10                Ariel Property Advisors                  8                      Besen  Associates               28
   rcanalytics.com/Misc/Brokers_
   Ranking_Methodology.pdf                                                0          200       400                                  0           50        100                                    0        250       500

©2012 Real Capital Analytics, Inc. All rights reserved. Data believed to be accurate but not guaranteed; subject to future revision; based on properties  portfolios $2.5m and greater.
                                                                                                                                                                                                                    8
®

 third quarter 2012

                                                    Selected investment Sales transactions
                                                                                                                                              Reported in the Past 45 Days
                                                     Property Name                             Units                 Price                    Owner
                                                     Address                                 Year Built               PPU                     Seller
                                                     Location                                  Notes               Qualifier                   Broker

                                                      Mid-Atlantic

                                                      Mass Court                               371            $168,383,333                    TIAA-CREF from          CBRE Global Investors
                                                      300 Massachusetts Ave Nw                2004                $453,863               by     CBRE
                                                      Washington, DC                       Mid/high-rise       approximate

                                                     Hamptons at Town Center                    768            $90,250,000                    AHC from        Harbor Group Int'l by        CBRE
                                                     19775 Crystal Rock                        1982                $117,513
                                                     Germantown, MD                           Garden             confirmed

                                                     Chase Heritage                             236            $42,500,000                   Continental Realty by Cushman 
                                                     1212 Chase Heritage Cir                   1986               $180,085               Wakefield from      Henderson Global
                                                     Sterling, VA                             Garden           approximate               Investors by Cushman  Wakefield

                                                     Curren Terrace                            318             $29,800,000                  BET Investments from
                                                     1011 New Hope St                         1970                  $93,711              Home Properties by CBRE
                                                     Norristown, PA                        Mid/high-rise       approximate

                                                      Midwest

                                                     1401 South State                          278             $70,500,000                  Marquette Cos JV American Realty
                                                     1401 S State St                          2008                $253,597               Advisors JV Hunt from      Lincoln Property
                                                     Chicago, IL                           Mid/high-rise         confirmed                Co JV Equity Residential by HFF

                                                     The Crossing at Barry Road                 624            $54,775,000                  GoldOller RE Invts from
                                                     7831 Nw Roanridge Rd                      1997                $87,780               Creekstone Partners JV Wafra Investment
                                                     Kansas City, MO                          Garden             confirmed                Advisory Group by CBRE

                                                      Stadium Village Flats                    120             $43,000,000                  Harrison Street Real Estate
                                                      818 Washington Ave Se                   2012                $358,333               Capital from    Opus
                                                      Minneapolis, MN                      Mid/high-rise       approximate

                                                      Northeast

                                                     Mantena                                    98             $84,000,000                  Equity Residential from           Joy
                                                     433-439 W 37th St                         2011               $857,143               Construction Corp by HFF
                                                     New York, NY                          Mid/high-rise         confirmed

                                                     425 Third Avenue                          102             $44,000,000                   Benchmark RE Group JV Western Heritable
                                                     425 3rd Ave                              1967                $431,373               Investment from    Midas Management
                                                     New York, NY                          Mid/high-rise       approximate

                                                      Wellington Place                         137             $40,058,750                  McMorgan  Co by CBRE from
                                                      34 Brainard Ave                         2005                $292,400               Northwestern Mutual by CBRE
                                                      Medford, MA                          Mid/high-rise         confirmed
                                                                                                                                             Eagle Rock Advisors by Institutional
                                                     Wintergreen of Westville                  294             $39,500,000               Property Advisors - Marcus  Millichap Company
                                                     400 Blake St                             2008                $134,354               from      US Bank NA by Institutional Property
                                                     New Haven, CT                         Mid/high-rise         confirmed                Advisors - Marcus  Millichap Company

                                                     The 163 Washington Condominiums 49                        $31,500,000                  ARC NYRR from            AE
                                                     163-171 Washington Ave          2010                         $642,857               Real Estate Holdings
                                                     Brooklyn, NY                 Mid/high-rise                  confirmed

                                                      Southeast

                                                      Windsor at Tryon Village                  393            $54,000,000                   Guardian Life Insurance Co from JP
                                                      2000 Crossroads Manor Ct                 2007               $137,405               Morgan Asset Management by Engler
                                                      Cary, NC                                Garden             confirmed                Financial Group

                                                     The Province                               235            $49,420,750                    EdR from       Edwards Companies
                                                     504 Boxelder Way                          2010               $210,301
                                                     Greenville, NC                           Garden             confirmed

©2012 Real Capital Analytics, Inc. All rights reserved. Data believed to be accurate but not guaranteed; subject to future revision; based on properties  portfolios $2.5m and greater.
                                                                                                                                                                                              9
®

 third quarter 2012

                                                    Selected investment Sales transactions
                                                                                                                                             Reported in the Past 45 Days
                                                     Property Name                             Units                 Price                    Owner
                                                     Address                                 Year Built               PPU                     Seller
                                                     Location                                  Notes               Qualifier                   Broker

                                                     Lost Creek Resort at Lakewood Ranch 272                   $39,250,700                  Inland Real Estate Corp from            PAC Land
                                                     11140 Lost Creek Ter                2011                     $144,304               Development Corp by HFF
                                                     Bradenton, FL                      Garden                   confirmed

                                                     Colonial Grand@Research Park 370                          $38,000,000                   Colonial Properties Trust from
                                                     400 Stone Lion Dr            2002                            $102,703               Tuckerman Group
                                                     Durham, NC                  Garden                        approximate

                                                     Links at Windsor Park                      280            $33,600,000                    Catalyst Dev Ptnrs from         TA Realty by
                                                     13700 Sutton Park Dr N                    1994               $120,000                   CBRE
                                                     Jacksonville, FL                         Garden           approximate

                                                      Stoneridge Farms at the Hunt Club 364                    $28,969,600                  CRES Management from   Flournoy
                                                      2325 Nashville Pike             2002                         $79,587               Companies by Apartment Realty Advisors
                                                      Gallatin, TN                   Garden                    approximate

                                                      Southwest

                                                     District on 5th                           208             $67,000,000                    EdR from       Campus Apartments
                                                     550 N 5th Ave                            2012                $322,115
                                                     Tucson, AZ                            Mid/high-rise       approximate

                                                      Prairie Creek                             464            $52,500,000                  Pure Multi-Family REIT from            MA Real
                                                      3560 Alma Rd                             1996                $113,147              Estate
                                                      Richardson, TX                          Garden             confirmed

                                                      Calvera Point                             276             $37,750,000                 Waterton Associates from    BRE
                                                      9100 Vance St                            1994                $136,775              Properties by Cushman  Wakefield
                                                      Broomfield, CO                           Garden            approximate

                                                     Alexan Star Ranch                           396           $36,630,000                  Lincoln Property Co from Trammell
                                                     150 Klattenhoff Ln                         2009               $92,500               Crow Residential (TCR) by CBRE
                                                     Hutto, TX                                 Garden            confirmed

                                                     Brookstone                                 528            $35,570,000                   Bascom Group from    Variable Annuity
                                                     4424 E Baseline Rd                        1988                $67,367               Life Insurance Co. by Cushman  Wakefield
                                                     Phoenix, AZ                              Garden           approximate

                                                      West

                                                      Waterfront at Pu'uloa                     1,461         $311,000,000                  Carmel Partners from  Cirrus Asset
                                                      5105 Iroquois Ave                         1965              $212,868               Managment Inc OBO Hunt by Eastdil
                                                      Ewa Beach, HI                            Garden            confirmed                Secured

                                                      Club Laguna                                421          $120,800,000                    Invesco RE from        Shea Homes by         HFF
                                                      350 The Club Dr                           1988              $286,936
                                                      Laguna Beach, CA                         Garden          approximate

                                                      Circa Green Lake                         199              $83,013,776                  TIAA-CREF from Prudential RE
                                                      6900 E Green Lake Way N                 2009                 $417,155              Investors (PREI) JV Trammell Crow
                                                      Seattle, WA                          Mid/high-rise          confirmed               by Cushman  Wakefield

                                                     Waterford Place                             360            $58,410,000                 Grosvenor from  Archstone by
                                                     13305 NE 171st St                          1989               $162,250              Cushman  Wakefield
                                                     Woodinville, WA                           Garden             confirmed

                                                      Archstone Venice on Rose                   70            $56,200,000                  Archstone by Institutional Property
                                                      512 Rose Avenue                           2011              $802,857               Advisors - Marcus  Millichap Company from
                                                      Venice, CA                               Garden            confirmed                   Gerding Edlen by Marcus  Millichap

                                                     Granite Point                               384           $45,500,000                 Matteson Cos from      Northwestern
                                                     4500 Truxel Rd                             2003              $118,490               Mutual by Colliers International
                                                     Sacramento, CA                            Garden            confirmed

©2012 Real Capital Analytics, Inc. All rights reserved. Data believed to be accurate but not guaranteed; subject to future revision; based on properties  portfolios $2.5m and greater.
                                                                                                                                                                                             10
RCA 2012 Q3 Multifamily Trend Report

Weitere ähnliche Inhalte

Was ist angesagt?

Financial Analysis - EFG Financial Products Holding AG provides financial ser...
Financial Analysis - EFG Financial Products Holding AG provides financial ser...Financial Analysis - EFG Financial Products Holding AG provides financial ser...
Financial Analysis - EFG Financial Products Holding AG provides financial ser...BCV
 
Dlf ru4 qfy2010-17052010
Dlf  ru4 qfy2010-17052010Dlf  ru4 qfy2010-17052010
Dlf ru4 qfy2010-17052010Angel Broking
 
FirstBank Nigeria - The Core Leader
FirstBank Nigeria - The Core LeaderFirstBank Nigeria - The Core Leader
FirstBank Nigeria - The Core LeaderFirstBank, Nigeria
 
Jpm 28feb12 jes staley
Jpm 28feb12 jes staleyJpm 28feb12 jes staley
Jpm 28feb12 jes staleymontgold
 
North American Office Highlights Q4-12
North American Office Highlights Q4-12North American Office Highlights Q4-12
North American Office Highlights Q4-12Coy Davidson
 

Was ist angesagt? (6)

Financial Analysis - EFG Financial Products Holding AG provides financial ser...
Financial Analysis - EFG Financial Products Holding AG provides financial ser...Financial Analysis - EFG Financial Products Holding AG provides financial ser...
Financial Analysis - EFG Financial Products Holding AG provides financial ser...
 
Dlf ru4 qfy2010-17052010
Dlf  ru4 qfy2010-17052010Dlf  ru4 qfy2010-17052010
Dlf ru4 qfy2010-17052010
 
CCDI Institutional Presentation Jun/2009
CCDI Institutional Presentation Jun/2009CCDI Institutional Presentation Jun/2009
CCDI Institutional Presentation Jun/2009
 
FirstBank Nigeria - The Core Leader
FirstBank Nigeria - The Core LeaderFirstBank Nigeria - The Core Leader
FirstBank Nigeria - The Core Leader
 
Jpm 28feb12 jes staley
Jpm 28feb12 jes staleyJpm 28feb12 jes staley
Jpm 28feb12 jes staley
 
North American Office Highlights Q4-12
North American Office Highlights Q4-12North American Office Highlights Q4-12
North American Office Highlights Q4-12
 

Andere mochten auch

Green Pearl Events Multifamily Investment Summit Jason Bram Presentation
Green Pearl Events Multifamily Investment Summit   Jason Bram PresentationGreen Pearl Events Multifamily Investment Summit   Jason Bram Presentation
Green Pearl Events Multifamily Investment Summit Jason Bram PresentationRyan Slack
 
Brainstorming 2013: Implementing the Latest Trends in Multifamily
Brainstorming 2013: Implementing the Latest Trends in MultifamilyBrainstorming 2013: Implementing the Latest Trends in Multifamily
Brainstorming 2013: Implementing the Latest Trends in MultifamilyAnsley Sudderth
 
Multifamily Trends & Predictions from Axiometrics
Multifamily Trends & Predictions from AxiometricsMultifamily Trends & Predictions from Axiometrics
Multifamily Trends & Predictions from AxiometricsAppFolio
 
Elkus Manfredi Architect Slides
Elkus Manfredi Architect SlidesElkus Manfredi Architect Slides
Elkus Manfredi Architect SlidesRyan Slack
 
Higher Ground Farm Slides
Higher Ground Farm SlidesHigher Ground Farm Slides
Higher Ground Farm SlidesRyan Slack
 
Final Managing Construction Risks - GreenbergTraurig
Final Managing Construction Risks - GreenbergTraurigFinal Managing Construction Risks - GreenbergTraurig
Final Managing Construction Risks - GreenbergTraurigRyan Slack
 

Andere mochten auch (7)

Green Pearl Events Multifamily Investment Summit Jason Bram Presentation
Green Pearl Events Multifamily Investment Summit   Jason Bram PresentationGreen Pearl Events Multifamily Investment Summit   Jason Bram Presentation
Green Pearl Events Multifamily Investment Summit Jason Bram Presentation
 
Brainstorming 2013: Implementing the Latest Trends in Multifamily
Brainstorming 2013: Implementing the Latest Trends in MultifamilyBrainstorming 2013: Implementing the Latest Trends in Multifamily
Brainstorming 2013: Implementing the Latest Trends in Multifamily
 
Multifamily Trends & Predictions from Axiometrics
Multifamily Trends & Predictions from AxiometricsMultifamily Trends & Predictions from Axiometrics
Multifamily Trends & Predictions from Axiometrics
 
CMI Slides
CMI SlidesCMI Slides
CMI Slides
 
Elkus Manfredi Architect Slides
Elkus Manfredi Architect SlidesElkus Manfredi Architect Slides
Elkus Manfredi Architect Slides
 
Higher Ground Farm Slides
Higher Ground Farm SlidesHigher Ground Farm Slides
Higher Ground Farm Slides
 
Final Managing Construction Risks - GreenbergTraurig
Final Managing Construction Risks - GreenbergTraurigFinal Managing Construction Risks - GreenbergTraurig
Final Managing Construction Risks - GreenbergTraurig
 

Ähnlich wie RCA 2012 Q3 Multifamily Trend Report

Say Good Bye To Property Market
Say Good Bye To Property MarketSay Good Bye To Property Market
Say Good Bye To Property MarketBoyboy cute
 
Harlem Investment Opportunity Initial Overview & Analysis June 2012
Harlem  Investment Opportunity Initial Overview & Analysis June 2012Harlem  Investment Opportunity Initial Overview & Analysis June 2012
Harlem Investment Opportunity Initial Overview & Analysis June 2012TomiDeutsch
 
Triple Net Lease Market Report
Triple Net Lease Market ReportTriple Net Lease Market Report
Triple Net Lease Market ReportThe Boulder Group
 
Net Lease Research Report by The Boulder Group
Net Lease Research Report by The Boulder GroupNet Lease Research Report by The Boulder Group
Net Lease Research Report by The Boulder GroupThe Boulder Group
 
Net Lease Research Report q4 2012
Net Lease Research Report q4 2012 Net Lease Research Report q4 2012
Net Lease Research Report q4 2012 The Boulder Group
 
Key Banc Conference Final[1]
Key Banc Conference Final[1]Key Banc Conference Final[1]
Key Banc Conference Final[1]BSTRINGE
 
Mergers & Acquisitions and Capital Market Update
Mergers & Acquisitions and Capital Market UpdateMergers & Acquisitions and Capital Market Update
Mergers & Acquisitions and Capital Market UpdateSSDlaw
 
Puget sound office market Q3 2012
Puget sound office market Q3 2012Puget sound office market Q3 2012
Puget sound office market Q3 2012GilWhiteCRE
 
Residential Sales Report - December 2011
Residential Sales Report - December 2011Residential Sales Report - December 2011
Residential Sales Report - December 2011Team Price Real Estate
 
Net Lease Dollar Store Report
Net Lease Dollar Store ReportNet Lease Dollar Store Report
Net Lease Dollar Store ReportThe Boulder Group
 
State of the Commercial Real Estate Market Chicago April 2012
State of the Commercial Real Estate Market Chicago April 2012State of the Commercial Real Estate Market Chicago April 2012
State of the Commercial Real Estate Market Chicago April 2012EDR
 
SuperReturn 2010: Bumpy road ahead for Private Equity investors
SuperReturn 2010: Bumpy road ahead for Private Equity investorsSuperReturn 2010: Bumpy road ahead for Private Equity investors
SuperReturn 2010: Bumpy road ahead for Private Equity investorsValue Partners
 
Real Estate Finance 301: Raising Capital in Today’s Economy – Strategies and ...
Real Estate Finance 301: Raising Capital in Today’s Economy – Strategies and ...Real Estate Finance 301: Raising Capital in Today’s Economy – Strategies and ...
Real Estate Finance 301: Raising Capital in Today’s Economy – Strategies and ...Virtual ULI
 
Pcg Northeast Ohio Newsletter - February/March 2010
Pcg Northeast Ohio Newsletter - February/March 2010Pcg Northeast Ohio Newsletter - February/March 2010
Pcg Northeast Ohio Newsletter - February/March 2010sjlatkovic
 
1 q09 presentation
1 q09 presentation1 q09 presentation
1 q09 presentationSiteriCR2
 
1Q09 Earnings Presentation
1Q09 Earnings Presentation1Q09 Earnings Presentation
1Q09 Earnings PresentationCR2
 
2012 q4 tampa bay office market report
2012 q4 tampa bay office market report2012 q4 tampa bay office market report
2012 q4 tampa bay office market reportJeff Tolrud
 
CMBS and CRE Briefing
CMBS and CRE BriefingCMBS and CRE Briefing
CMBS and CRE BriefingEDR
 

Ähnlich wie RCA 2012 Q3 Multifamily Trend Report (20)

Say Good Bye To Property Market
Say Good Bye To Property MarketSay Good Bye To Property Market
Say Good Bye To Property Market
 
Harlem Investment Opportunity Initial Overview & Analysis June 2012
Harlem  Investment Opportunity Initial Overview & Analysis June 2012Harlem  Investment Opportunity Initial Overview & Analysis June 2012
Harlem Investment Opportunity Initial Overview & Analysis June 2012
 
Triple Net Lease Market Report
Triple Net Lease Market ReportTriple Net Lease Market Report
Triple Net Lease Market Report
 
Net Lease Research Report by The Boulder Group
Net Lease Research Report by The Boulder GroupNet Lease Research Report by The Boulder Group
Net Lease Research Report by The Boulder Group
 
Net Lease Research Report q4 2012
Net Lease Research Report q4 2012 Net Lease Research Report q4 2012
Net Lease Research Report q4 2012
 
Key Banc Conference Final[1]
Key Banc Conference Final[1]Key Banc Conference Final[1]
Key Banc Conference Final[1]
 
Mergers & Acquisitions and Capital Market Update
Mergers & Acquisitions and Capital Market UpdateMergers & Acquisitions and Capital Market Update
Mergers & Acquisitions and Capital Market Update
 
Puget sound office market Q3 2012
Puget sound office market Q3 2012Puget sound office market Q3 2012
Puget sound office market Q3 2012
 
Residential Sales Report - December 2011
Residential Sales Report - December 2011Residential Sales Report - December 2011
Residential Sales Report - December 2011
 
Net Lease Dollar Store Report
Net Lease Dollar Store ReportNet Lease Dollar Store Report
Net Lease Dollar Store Report
 
State of the Commercial Real Estate Market Chicago April 2012
State of the Commercial Real Estate Market Chicago April 2012State of the Commercial Real Estate Market Chicago April 2012
State of the Commercial Real Estate Market Chicago April 2012
 
SuperReturn 2010: Bumpy road ahead for Private Equity investors
SuperReturn 2010: Bumpy road ahead for Private Equity investorsSuperReturn 2010: Bumpy road ahead for Private Equity investors
SuperReturn 2010: Bumpy road ahead for Private Equity investors
 
Real Estate Finance 301: Raising Capital in Today’s Economy – Strategies and ...
Real Estate Finance 301: Raising Capital in Today’s Economy – Strategies and ...Real Estate Finance 301: Raising Capital in Today’s Economy – Strategies and ...
Real Estate Finance 301: Raising Capital in Today’s Economy – Strategies and ...
 
Merger Tracker Monthly March2009.2
Merger Tracker Monthly March2009.2Merger Tracker Monthly March2009.2
Merger Tracker Monthly March2009.2
 
Pcg Northeast Ohio Newsletter - February/March 2010
Pcg Northeast Ohio Newsletter - February/March 2010Pcg Northeast Ohio Newsletter - February/March 2010
Pcg Northeast Ohio Newsletter - February/March 2010
 
1 q09 presentation
1 q09 presentation1 q09 presentation
1 q09 presentation
 
1Q09 Earnings Presentation
1Q09 Earnings Presentation1Q09 Earnings Presentation
1Q09 Earnings Presentation
 
2012 q4 tampa bay office market report
2012 q4 tampa bay office market report2012 q4 tampa bay office market report
2012 q4 tampa bay office market report
 
CMBS and CRE Briefing
CMBS and CRE BriefingCMBS and CRE Briefing
CMBS and CRE Briefing
 
Net Lease Research Report
Net Lease Research ReportNet Lease Research Report
Net Lease Research Report
 

Mehr von Dylan Simon

Millennials and Their Homes
Millennials and Their HomesMillennials and Their Homes
Millennials and Their HomesDylan Simon
 
2014 Seattle Multifamily Urban Market Study -- Dylan Simon
2014 Seattle Multifamily Urban Market Study -- Dylan Simon2014 Seattle Multifamily Urban Market Study -- Dylan Simon
2014 Seattle Multifamily Urban Market Study -- Dylan SimonDylan Simon
 
Dylan Simon - 5 Predictions for Apartment Investment in 2014
Dylan Simon  -  5 Predictions for Apartment Investment in 2014Dylan Simon  -  5 Predictions for Apartment Investment in 2014
Dylan Simon - 5 Predictions for Apartment Investment in 2014Dylan Simon
 
2014 ULI Emerging Trends in Real Estate
2014 ULI Emerging Trends in Real Estate2014 ULI Emerging Trends in Real Estate
2014 ULI Emerging Trends in Real EstateDylan Simon
 
Colliers multifamily market report (q4 2012)
Colliers multifamily market report (q4 2012)Colliers multifamily market report (q4 2012)
Colliers multifamily market report (q4 2012)Dylan Simon
 
Pere global investor report 2012
Pere global investor report 2012Pere global investor report 2012
Pere global investor report 2012Dylan Simon
 
Tax Rules Set to Change in 2013
Tax Rules Set to Change in 2013Tax Rules Set to Change in 2013
Tax Rules Set to Change in 2013Dylan Simon
 
Colliers 2012 Q1 Multifamily Report
Colliers 2012 Q1 Multifamily ReportColliers 2012 Q1 Multifamily Report
Colliers 2012 Q1 Multifamily ReportDylan Simon
 

Mehr von Dylan Simon (8)

Millennials and Their Homes
Millennials and Their HomesMillennials and Their Homes
Millennials and Their Homes
 
2014 Seattle Multifamily Urban Market Study -- Dylan Simon
2014 Seattle Multifamily Urban Market Study -- Dylan Simon2014 Seattle Multifamily Urban Market Study -- Dylan Simon
2014 Seattle Multifamily Urban Market Study -- Dylan Simon
 
Dylan Simon - 5 Predictions for Apartment Investment in 2014
Dylan Simon  -  5 Predictions for Apartment Investment in 2014Dylan Simon  -  5 Predictions for Apartment Investment in 2014
Dylan Simon - 5 Predictions for Apartment Investment in 2014
 
2014 ULI Emerging Trends in Real Estate
2014 ULI Emerging Trends in Real Estate2014 ULI Emerging Trends in Real Estate
2014 ULI Emerging Trends in Real Estate
 
Colliers multifamily market report (q4 2012)
Colliers multifamily market report (q4 2012)Colliers multifamily market report (q4 2012)
Colliers multifamily market report (q4 2012)
 
Pere global investor report 2012
Pere global investor report 2012Pere global investor report 2012
Pere global investor report 2012
 
Tax Rules Set to Change in 2013
Tax Rules Set to Change in 2013Tax Rules Set to Change in 2013
Tax Rules Set to Change in 2013
 
Colliers 2012 Q1 Multifamily Report
Colliers 2012 Q1 Multifamily ReportColliers 2012 Q1 Multifamily Report
Colliers 2012 Q1 Multifamily Report
 

Kürzlich hochgeladen

What is Affordable Housing? Bristol Civic Society April 2024
What is Affordable Housing? Bristol Civic Society April 2024What is Affordable Housing? Bristol Civic Society April 2024
What is Affordable Housing? Bristol Civic Society April 2024Paul Smith
 
Goyal Orchid Life East Bangalore.pdf.pdf
Goyal Orchid Life East Bangalore.pdf.pdfGoyal Orchid Life East Bangalore.pdf.pdf
Goyal Orchid Life East Bangalore.pdf.pdfkratirudram
 
Mana Dale Kodathi, Sarjapur Road, Bangalore E-Brochure.pdf
Mana Dale Kodathi, Sarjapur Road, Bangalore E-Brochure.pdfMana Dale Kodathi, Sarjapur Road, Bangalore E-Brochure.pdf
Mana Dale Kodathi, Sarjapur Road, Bangalore E-Brochure.pdffaheemali990101
 
Purva BlueBelle Magadi Road Bangalore.pdf.pdf
Purva BlueBelle Magadi Road Bangalore.pdf.pdfPurva BlueBelle Magadi Road Bangalore.pdf.pdf
Purva BlueBelle Magadi Road Bangalore.pdf.pdfkratirudram
 
LCAR Unit 19 - Financing the Real Estate Transaction - 14th Edition Revised
LCAR Unit 19 - Financing the Real Estate Transaction - 14th Edition RevisedLCAR Unit 19 - Financing the Real Estate Transaction - 14th Edition Revised
LCAR Unit 19 - Financing the Real Estate Transaction - 14th Edition RevisedTom Blefko
 
Volition Meetup 2024 03 Mortgages & Interest Rates – Is The Worst Behind Us_ ...
Volition Meetup 2024 03 Mortgages & Interest Rates – Is The Worst Behind Us_ ...Volition Meetup 2024 03 Mortgages & Interest Rates – Is The Worst Behind Us_ ...
Volition Meetup 2024 03 Mortgages & Interest Rates – Is The Worst Behind Us_ ...Volition Properties
 
LCAR RE Practice - The Pearson Vue State Exam
LCAR RE Practice - The Pearson Vue State ExamLCAR RE Practice - The Pearson Vue State Exam
LCAR RE Practice - The Pearson Vue State ExamTom Blefko
 
Honer Richmont Hyderabad E brochure - A Life With A View
Honer Richmont Hyderabad E brochure - A Life With A ViewHoner Richmont Hyderabad E brochure - A Life With A View
Honer Richmont Hyderabad E brochure - A Life With A ViewAhanundefined
 
Sankla East World Hadapsar Pune Brochure.pdf
Sankla East World Hadapsar Pune Brochure.pdfSankla East World Hadapsar Pune Brochure.pdf
Sankla East World Hadapsar Pune Brochure.pdfabbu831446
 
Raymond Ten X Era Viviana Mall Thane Brochure.pdf
Raymond Ten X Era Viviana Mall Thane Brochure.pdfRaymond Ten X Era Viviana Mall Thane Brochure.pdf
Raymond Ten X Era Viviana Mall Thane Brochure.pdfPrachiRudram
 
Seller Seminar Presentation With A Realtor
Seller Seminar  Presentation With A RealtorSeller Seminar  Presentation With A Realtor
Seller Seminar Presentation With A Realtorcarlsbadheather
 
Lancaster Market Expenses and Company Worksheet
Lancaster Market Expenses and Company WorksheetLancaster Market Expenses and Company Worksheet
Lancaster Market Expenses and Company WorksheetTom Blefko
 
Listing Turkey - Viva Perla Maltepe Catalog
Listing Turkey - Viva Perla Maltepe CatalogListing Turkey - Viva Perla Maltepe Catalog
Listing Turkey - Viva Perla Maltepe CatalogListing Turkey
 
Purva Park Hill Kanakapura Road Bangalore.pdf
Purva Park Hill  Kanakapura Road Bangalore.pdfPurva Park Hill  Kanakapura Road Bangalore.pdf
Purva Park Hill Kanakapura Road Bangalore.pdfashiyadav24
 
Prestige Orchards Plots in Shamshabad, Mamidipalli, Hyderabad pdf.pdf
Prestige Orchards Plots in Shamshabad, Mamidipalli, Hyderabad pdf.pdfPrestige Orchards Plots in Shamshabad, Mamidipalli, Hyderabad pdf.pdf
Prestige Orchards Plots in Shamshabad, Mamidipalli, Hyderabad pdf.pdfAhanundefined
 
Prestige Sanctuary Nandi Hills Bangalore.pdf
Prestige Sanctuary Nandi Hills Bangalore.pdfPrestige Sanctuary Nandi Hills Bangalore.pdf
Prestige Sanctuary Nandi Hills Bangalore.pdfashiyadav24
 
Maha Mauka Squarefeet Brochure |Maha Mauka Squarefeet PDF Brochure|
Maha Mauka Squarefeet Brochure |Maha Mauka Squarefeet PDF Brochure|Maha Mauka Squarefeet Brochure |Maha Mauka Squarefeet PDF Brochure|
Maha Mauka Squarefeet Brochure |Maha Mauka Squarefeet PDF Brochure|AkshayJoshi575980
 
Kolte Patil Universe Hinjewadi Pune Brochure.pdf
Kolte Patil Universe Hinjewadi Pune Brochure.pdfKolte Patil Universe Hinjewadi Pune Brochure.pdf
Kolte Patil Universe Hinjewadi Pune Brochure.pdfPrachiRudram
 
Prestige Somerville Whitefield Bangalore E- Brochure.pdf
Prestige Somerville Whitefield Bangalore E- Brochure.pdfPrestige Somerville Whitefield Bangalore E- Brochure.pdf
Prestige Somerville Whitefield Bangalore E- Brochure.pdffaheemali990101
 
LCAR Unit 21 - Closing the Real Estate Transaction - 14th Edition Revised
LCAR Unit 21 - Closing the Real Estate Transaction - 14th Edition RevisedLCAR Unit 21 - Closing the Real Estate Transaction - 14th Edition Revised
LCAR Unit 21 - Closing the Real Estate Transaction - 14th Edition RevisedTom Blefko
 

Kürzlich hochgeladen (20)

What is Affordable Housing? Bristol Civic Society April 2024
What is Affordable Housing? Bristol Civic Society April 2024What is Affordable Housing? Bristol Civic Society April 2024
What is Affordable Housing? Bristol Civic Society April 2024
 
Goyal Orchid Life East Bangalore.pdf.pdf
Goyal Orchid Life East Bangalore.pdf.pdfGoyal Orchid Life East Bangalore.pdf.pdf
Goyal Orchid Life East Bangalore.pdf.pdf
 
Mana Dale Kodathi, Sarjapur Road, Bangalore E-Brochure.pdf
Mana Dale Kodathi, Sarjapur Road, Bangalore E-Brochure.pdfMana Dale Kodathi, Sarjapur Road, Bangalore E-Brochure.pdf
Mana Dale Kodathi, Sarjapur Road, Bangalore E-Brochure.pdf
 
Purva BlueBelle Magadi Road Bangalore.pdf.pdf
Purva BlueBelle Magadi Road Bangalore.pdf.pdfPurva BlueBelle Magadi Road Bangalore.pdf.pdf
Purva BlueBelle Magadi Road Bangalore.pdf.pdf
 
LCAR Unit 19 - Financing the Real Estate Transaction - 14th Edition Revised
LCAR Unit 19 - Financing the Real Estate Transaction - 14th Edition RevisedLCAR Unit 19 - Financing the Real Estate Transaction - 14th Edition Revised
LCAR Unit 19 - Financing the Real Estate Transaction - 14th Edition Revised
 
Volition Meetup 2024 03 Mortgages & Interest Rates – Is The Worst Behind Us_ ...
Volition Meetup 2024 03 Mortgages & Interest Rates – Is The Worst Behind Us_ ...Volition Meetup 2024 03 Mortgages & Interest Rates – Is The Worst Behind Us_ ...
Volition Meetup 2024 03 Mortgages & Interest Rates – Is The Worst Behind Us_ ...
 
LCAR RE Practice - The Pearson Vue State Exam
LCAR RE Practice - The Pearson Vue State ExamLCAR RE Practice - The Pearson Vue State Exam
LCAR RE Practice - The Pearson Vue State Exam
 
Honer Richmont Hyderabad E brochure - A Life With A View
Honer Richmont Hyderabad E brochure - A Life With A ViewHoner Richmont Hyderabad E brochure - A Life With A View
Honer Richmont Hyderabad E brochure - A Life With A View
 
Sankla East World Hadapsar Pune Brochure.pdf
Sankla East World Hadapsar Pune Brochure.pdfSankla East World Hadapsar Pune Brochure.pdf
Sankla East World Hadapsar Pune Brochure.pdf
 
Raymond Ten X Era Viviana Mall Thane Brochure.pdf
Raymond Ten X Era Viviana Mall Thane Brochure.pdfRaymond Ten X Era Viviana Mall Thane Brochure.pdf
Raymond Ten X Era Viviana Mall Thane Brochure.pdf
 
Seller Seminar Presentation With A Realtor
Seller Seminar  Presentation With A RealtorSeller Seminar  Presentation With A Realtor
Seller Seminar Presentation With A Realtor
 
Lancaster Market Expenses and Company Worksheet
Lancaster Market Expenses and Company WorksheetLancaster Market Expenses and Company Worksheet
Lancaster Market Expenses and Company Worksheet
 
Listing Turkey - Viva Perla Maltepe Catalog
Listing Turkey - Viva Perla Maltepe CatalogListing Turkey - Viva Perla Maltepe Catalog
Listing Turkey - Viva Perla Maltepe Catalog
 
Purva Park Hill Kanakapura Road Bangalore.pdf
Purva Park Hill  Kanakapura Road Bangalore.pdfPurva Park Hill  Kanakapura Road Bangalore.pdf
Purva Park Hill Kanakapura Road Bangalore.pdf
 
Prestige Orchards Plots in Shamshabad, Mamidipalli, Hyderabad pdf.pdf
Prestige Orchards Plots in Shamshabad, Mamidipalli, Hyderabad pdf.pdfPrestige Orchards Plots in Shamshabad, Mamidipalli, Hyderabad pdf.pdf
Prestige Orchards Plots in Shamshabad, Mamidipalli, Hyderabad pdf.pdf
 
Prestige Sanctuary Nandi Hills Bangalore.pdf
Prestige Sanctuary Nandi Hills Bangalore.pdfPrestige Sanctuary Nandi Hills Bangalore.pdf
Prestige Sanctuary Nandi Hills Bangalore.pdf
 
Maha Mauka Squarefeet Brochure |Maha Mauka Squarefeet PDF Brochure|
Maha Mauka Squarefeet Brochure |Maha Mauka Squarefeet PDF Brochure|Maha Mauka Squarefeet Brochure |Maha Mauka Squarefeet PDF Brochure|
Maha Mauka Squarefeet Brochure |Maha Mauka Squarefeet PDF Brochure|
 
Kolte Patil Universe Hinjewadi Pune Brochure.pdf
Kolte Patil Universe Hinjewadi Pune Brochure.pdfKolte Patil Universe Hinjewadi Pune Brochure.pdf
Kolte Patil Universe Hinjewadi Pune Brochure.pdf
 
Prestige Somerville Whitefield Bangalore E- Brochure.pdf
Prestige Somerville Whitefield Bangalore E- Brochure.pdfPrestige Somerville Whitefield Bangalore E- Brochure.pdf
Prestige Somerville Whitefield Bangalore E- Brochure.pdf
 
LCAR Unit 21 - Closing the Real Estate Transaction - 14th Edition Revised
LCAR Unit 21 - Closing the Real Estate Transaction - 14th Edition RevisedLCAR Unit 21 - Closing the Real Estate Transaction - 14th Edition Revised
LCAR Unit 21 - Closing the Real Estate Transaction - 14th Edition Revised
 

RCA 2012 Q3 Multifamily Trend Report

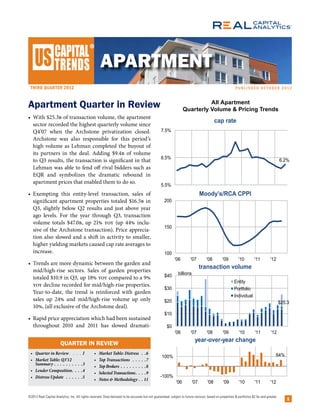
  • 1. ® third quarter 2012 Published oct ober 2012 Apartment Quarter in Review All Apartment Quarterly Volume & Pricing Trends • With $25.3b of transaction volume, the apartment cap rate sector recorded the highest quarterly volume since Q4’07 when the Archstone privatization closed. 7.5% Archstone was also responsible for this period’s high volume as Lehman completed the buyout of its partners in the deal. Adding $9.4b of volume 6.5% to Q3 results, the transaction is significant in that 6.2% Lehman was able to fend off rival bidders such as EQR and symbolizes the dramatic rebound in apartment prices that enabled them to do so. 5.5% • Exempting this entity-level transaction, sales of Moody’s/RCA CPPI significant apartment properties totaled $16.5b in 200 Q3, slightly below Q2 results and just above year ago levels. For the year through Q3, transaction volume totals $47.0b, up 21% yoy (up 44% inclu- 150 sive of the Archstone transaction). Price apprecia- tion also slowed and a shift in activity to smaller, higher yielding markets caused cap rate averages to increase. 100 '06 '07 '08 '09 '10 '11 '12 • Trends are more dynamic between the garden and transaction volume mid/high-rise sectors. Sales of garden properties billions totaled $10.9 in Q3, up 18% yoy compared to a 9% $40 Entity yoy decline recorded for mid/high-rise properties. $30 Portfolio Year-to-date, the trend is reinforced with garden Individual sales up 24% and mid/high-rise volume up only $20 $25.3 10%, (all exclusive of the Archstone deal). $10 • Rapid price appreciation which had been sustained throughout 2010 and 2011 has slowed dramati- $0 '06 '07 '08 '09 '10 '11 '12 year-over-year change Quarter in Review • Quarter in Review�����������1 • Market Table: Distress �����6 64% 100% • Market Table: Q3’12 • Top Transactions ��������������7 Summary����������������������������3 • Top Brokers��������������������������8 • Lender Composition����������4 • Selected Transactions����������9 • Distress Update �����������������5 -100% • Notes Methodology�����11 '06 '07 '08 '09 '10 '11 '12 ©2012 Real Capital Analytics, Inc. All rights reserved. Data believed to be accurate but not guaranteed; subject to future revision; based on properties portfolios $2.5m and greater. 1
  • 2. ® third quarter 2012 Quarterly Volume Pricing Trends cally in 2012. Many REIT and institutional buyers are opting to develop rather than buy at premium Garden Mid/high-rise prices. Other investors are being drawn to the rela- cap rate tively higher cap rates available in secondary and 7.5% tertiary markets. Apartment sales in the six major 7.0% metros fell 23% yoy in Q3 while secondary market 6.5% activity rose 21% and tertiary sales surged 54%. The 6.0% trend is apparent across both the garden and mid/ 5.5% Major Metro Avg. Cap high-rise sectors. Avg. Cap Rate 5.0% '08 '09 '10 '11 '12 '08 '09 '10 '11 '12 • With investors opting to build rather than buy price per unit in thousands prime properties combined with the significant $300 shift in sales to higher-yielding markets, cap rate $250 averages took a turn upward in Q3, rising roughly $200 20 bps to 6.3%. While there are plenty of deals trans- $150 acted at 4.0% or lower yields, far more transactions $100 are happening in secondary and tertiary markets $50 where cap rates have average 70 to 140 bps higher '08 '09 '10 '11 '12 '08 '09 '10 '11 '12 than in major metros. Thus, the uptick in average transaction volume cap rates does not indicate a re-pricing throughout $20 billions the apartment sector. In fact, due to recent declines $15 in mortgage interest rates and a more competitive environment among lenders (see page 4), cap rates $10 remain under downward pressure. $5 • Student housing properties remain in high demand $0 '08 '09 '10 '11 '12 '08 '09 '10 '11 '12 by investors and volume for that niche topped $1.8b year-over-year change through Q3, up 23% yoy. Senior housing transac- 300% tions, not included in the apartment sector totals, 100% are off significantly this year chiefly due to few large entity or portfolio deals. Sales of individual senior -100% housing properties were actually up a robust 43% in '08 '09 '10 '11 '12 '08 '09 '10 '11 '12 Q3 and are up 23% year-to-date. Summary Table volume YTD Through Q3'12 vs YOY average pricing YTD Through Q3'12 vs YOY $ bil yoy # props yoy $/unit % chng cap bps Apartment Total $55.8 44% 3,525 37% $104,418 4% 6.2% -25 Garden $35.0 44% 2,466 33% $82,121 12% 6.3% -29 Mid/High-rise $20.8 43% 1,059 48% $190,311 -13% 5.8% -5 Major Metros $25.1 38% 1,493 39% $195,323 2% 5.6% -20 Secondary Mkts $24.5 49% 1,455 33% $80,623 16% 6.4% -21 Tertiary Mkts $5.9 45% 484 22% $68,398 13% 7.1% -46 Student Housing $1.8 26% 92 6% $113,531 -3% 7.0% -40 Senior Housing* $5.2 -79% 423 -73% $107,140 -3% 8.7% -86 * not included in apartment volume or pricing statistics ©2012 Real Capital Analytics, Inc. All rights reserved. Data believed to be accurate but not guaranteed; subject to future revision; based on properties portfolios $2.5m and greater. 2
  • 3. ® third quarter 2012 Market table: Q3’12 Apartment Summary Volume Pricing Transactions Reported YOY YOY PPU Cap Rate Closed Through Q3’12 Vol ($M) # Props Low High Low High Change Change Avg Avg Baltimore $726.7 74% 26 100% $40,313 $127,535 $253,725 5.4% 6.9% 9.0% Mid- DC 1,203.9 239% 35 169% 51,790 284,059 453,774 DC MD burbs 1,214.6 19% 24 -17% 62,366 142,899 418,650 4.6% 6.3% 7.2% Atlantic DC VA burbs 2,478.6 22% 38 12% 98,780 199,936 395,928 5.7% 6.4% 7.0% Philadelphia 304.1 -26% 22 -27% 15,741 89,397 925,625 4.2% 5.9% 7.0% Pittsburgh 13.3 -72% 2 -60% 48,408 53,414 61,957 6.7% 7.0% 7.3% Richmond/Norfolk 313.8 -32% 18 -25% 31,776 104,560 154,167 5.2% 6.1% 7.0% Tertiary Mid-Atlantic 437.6 38% 25 -7% 38,580 82,410 140,899 6.0% 7.5% 9.0% Total $6,692.6 32% 190 9% $15,741 $137,121 $925,625 4.0% 6.5% 9.0% Chicago 1,005.8 -21% 59 -2% 25,417 148,858 497,738 5.8% 7.5% 8.5% Midwest Cincinnati 146.2 -3% 11 -35% 33,333 56,619 162,295 Cleveland 106.6 65% 12 71% 21,739 41,895 122,321 7.8% 8.6% 10.1% Columbus 136.0 9% 16 78% 8,125 35,126 152,174 Detroit 300.2 126% 23 53% 9,390 57,300 122,137 Indianapolis 110.6 -25% 10 -38% 32,474 51,842 70,330 6.7% 8.1% 9.5% Kansas City 237.5 44% 13 -19% 11,333 61,204 114,583 5.8% 7.1% 9.0% Minneapolis 273.2 37% 23 77% 22,404 93,843 358,333 St Louis 120.7 45% 13 160% 24,630 54,014 86,705 4.2% 6.5% 9.0% Tertiary Midwest 945.3 162% 82 39% 15,152 60,704 153,125 4.7% 7.3% 8.7% Total $3,382.1 25% 262 21% $8,125 $73,236 $497,738 4.2% 7.5% 10.1% Boston 1,516.6 57% 76 130% 57,157 201,740 800,000 4.5% 5.5% 6.0% Northeast Hartford 52.6 190% 19 280% 23,435 44,570 122,500 Long Island 228.6 277% 7 0% 83,784 230,190 261,111 Manhattan 5,765.8 49% 299 99% 35,762 329,803 2,666,667 3.0% 5.1% 6.9% No NJ 582.8 -47% 59 -3% 33,333 111,764 325,153 5.0% 6.0% 8.0% NYC Boroughs 1,394.6 22% 215 39% 49,123 134,893 903,226 4.5% 7.0% 9.9% Stamford 303.3 237% 10 100% 47,656 164,525 1,058,824 4.0% 5.9% 7.8% Westchester 90.4 16% 9 0% 64,286 113,053 150,000 7.2% 7.2% 7.3% Tertiary Northeast 156.7 2% 28 75% 11,416 55,022 180,198 6.2% 7.4% 9.5% Total $10,091.5 35% 722 64% $11,416 $205,268 $2,666,667 3.0% 6.1% 9.9% Atlanta 2,361.3 51% 132 25% 5,627 66,171 276,483 4.8% 7.6% 9.9% Southeast Broward 667.7 88% 30 88% 22,159 97,338 454,688 4.5% 6.4% 7.5% Charlotte 486.9 8% 23 15% 14,527 89,838 208,333 5.0% 6.0% 7.8% Jacksonville 372.8 32% 26 30% 17,630 55,804 150,195 Memphis 271.6 30% 20 0% 6,641 49,083 102,586 6.3% 7.8% 9.2% Miami 310.9 86% 40 60% 25,000 92,936 436,042 4.1% 5.8% 7.3% Nashville 503.9 82% 30 150% 12,017 67,874 170,455 7.0% 7.5% 7.9% Orlando 701.3 54% 35 21% 15,076 71,726 245,833 5.8% 6.5% 7.5% Palm Beach 445.5 140% 19 46% 18,750 89,067 180,282 Raleigh/Durham 941.3 58% 41 37% 28,175 97,515 346,721 4.6% 6.0% 7.8% Tampa 790.8 0% 50 4% 14,946 69,411 156,896 3.7% 6.7% 9.5% Tertiary Southeast 2,451.8 12% 187 1% 9,368 59,989 210,301 5.0% 7.1% 10.8% Total $10,305.8 37% 633 21% $5,627 $69,754 $454,688 3.7% 6.7% 10.8% Austin 1,575.4 287% 64 121% 27,721 108,485 278,075 4.7% 6.1% 7.1% Southwest Dallas 2,119.1 16% 148 22% 11,407 54,991 269,266 6.0% 7.3% 9.1% Denver 1,569.2 88% 71 27% 30,303 100,951 251,563 5.3% 6.3% 7.6% Houston 1,642.7 17% 111 17% 11,656 76,361 159,033 5.4% 6.0% 6.6% Phoenix 2,076.9 57% 109 14% 16,185 74,197 366,667 3.6% 6.3% 8.6% San Antonio 481.4 16% 37 95% 44,401 75,889 115,702 4.4% 5.7% 7.0% Tertiary Southwest 1,268.6 101% 104 68% 16,129 74,398 143,049 4.7% 7.4% 10.3% Total $10,733.4 57% 644 35% $11,407 $79,470 $366,667 3.6% 6.7% 10.3% East Bay 786.7 -8% 50 22% 40,476 154,224 277,083 4.8% 5.8% 7.2% West Inland Empire 572.8 2% 32 -6% 28,527 105,540 243,243 5.0% 5.8% 6.6% Las Vegas 328.7 -1% 29 32% 12,153 42,207 96,739 6.5% 7.7% 9.3% Los Angeles 4,286.0 60% 350 48% 31,600 169,469 802,857 3.0% 5.4% 9.5% Orange Co 1,024.0 170% 43 72% 105,269 242,745 487,106 4.5% 5.5% 6.6% Portland 489.3 10% 32 39% 38,362 117,123 240,718 4.5% 6.5% 8.9% Sacramento 424.0 100% 28 100% 24,600 89,792 310,714 5.3% 6.1% 8.5% Salt Lake City 52.6 5% 7 17% San Diego 1,147.4 171% 71 78% 65,789 139,795 466,667 4.1% 5.8% 7.7% San Francisco 1,236.7 10% 122 -22% 86,111 217,957 664,000 3.3% 5.2% 7.1% San Jose 1,109.7 227% 47 213% 113,571 251,029 553,991 3.7% 5.1% 9.0% Seattle 1,725.2 63% 93 58% 32,461 151,307 417,550 4.0% 5.2% 6.5% Tertiary West 1,046.6 92% 77 35% 23,810 133,952 540,323 3.3% 6.0% 9.3% Total $14,229.5 58% 981 34% $12,153 $146,413 $802,857 3.0% 5.6% 9.5% US Other 350.3 50% 93 675% Total US $55,785.1 44% 3,525 37% $5,627 $104,418 $2,666,667 3.0% 6.2% 10.8% ©2012 Real Capital Analytics, Inc. All rights reserved. Data believed to be accurate but not guaranteed; subject to future revision; based on properties portfolios $2.5m and greater. 3
  • 4. ® third quarter 2012 Apartment Lender Composition • With interest rates on long term, fixed rate deals now Apartment Lender Composition H1’12 averaging below 4.0% and better rates to be had for CMBS Financial shorter term and floaters, positive leverage is achievable Gov't Agency Insurance for all but the lowest cap rate deals. The agencies continue Int'l Bank Nat'l Bank to dominate originations, but their market share is slowly Reg'l/Local Bank Pvt/Other declining as other lenders ramp up activity. All Apartment Past 5 Years • The government agencies accounted for 64% of all mul- H1'12 64% 8% 8% 10% tifamily mortgage originations in the first half of 2012, down from 68% in 2011. The agencies remain very aggres- 2011 68% 8% 10% sive and are increasingly packaging their multifamily loans into securitizations. To date this year, Freddie and 2010 76% 4% 9% Fannie have securitized $23b of multi-family loans, well ahead of the $17b of issuance for all of 2011. Freddie has 2009 87% 6% been most active and recently completed its 14th issue this year. 2008 8% 61% 10% 13% • There are few areas where the agencies do not have a By Apartment Subtypes majority market share such as for mid/high-rise prop- erties, where insurance companies and banks are more Garden 76% 7% 6% 5% active. Agen- Commercial Mortgage Rates cies are also less Mid/high- 8% 48% 13% 8% 17% Commercial rise Multifamily dominant in the Student 7.0% Northeast, where Hsg 13% 70% 5% 6.5% regional and local 6.0% 5.5% banks have a 27% By Major, Secondary and Tertiary Markets 5.0% share of multi- Major 4.5% family lending. Metro 5% 59% 8% 9% 16% 4.0% 3.5% • Private label Secondary 71% 11% 2009 2010 2011 2012 CMBS has not Fixed rate loans with 7-10 year terms Tixed rate loans with 7-10 year terms been very impact- Tertiary 80% ful on the multifamily lending landscape, so far account- 3-month average ing for just 3% of originations this year and last. The By Region CMBS conduits have a greater penetration in lending for student housing properties and also in the Midwest Northeast 9% 47% 7% 7% 27% region. Mid-Atlantic 81% 6% • Many banks have returned to commercial property lend- ing again and their share of multifamily originations Southeast 76% 9% increased to 19% in the first half of 2012 compared to 16% in 2011. Much of that activity has been in the major met- Midwest 8% 70% 6% ros as well as a concentration in the Northeast and West. Banks are also active in construction financing which is Southwest 75% 9% 5% not included in this analysis. West 67% 12% 11% 6% • In tertiary markets, the agencies remain the primary lender and account for 80% of all apartment property loans. ©2012 Real Capital Analytics, Inc. All rights reserved. Data believed to be accurate but not guaranteed; subject to future revision; based on properties portfolios $2.5m and greater. 4
  • 5. ® third quarter 2012 Distress update • Defaults and transfers to special servicing of loans Cumulative DistressDistress Cumulative for Apartment for apartment properties totaled $660m in Q3’12, for Apartment Properties Properties the lowest since 2007. Most of the newly distressed $90 billions situations are resulting from maturity defaults $80 Troubled of CMBS loans. Workout activity fell to $2.4b in REO $70 Restructured Q3’12, resulting in a significant decline in outstand- Resolved $60 ing distress. Year-to-date outflows have exceeded $50 inflows by $5.2b. $40 • At the end of Q3’12, a total of $30.9b of mortgages $30 on apartment property remained distressed with $20 $20.9b in the workout process and $10.0b converted $10 to REO. Throughout the cycle, a total of $81.8b of $0 apartment property has become distressed, and 1 2 3 4 1 2 3 4 1 2 3 4 1 2 3 4 1 2 3 to date, 63% of that total has been resolved. Banks '08 '09 '10 '11 '12 and other lenders are much farther along at work- ing out distressed situations while just 51% of dis- Quarterly AdditionsAdditions and to Quarterly and Reductions Reductions to Distress Distress tressed CMBS loans have been resolved. billions $15 Summary by Lender Type Newly Troubled Outstanding % Chg Worked RR* Worked out Net Change Distress ($M) vs Q1'11 Out (%) (%) $10 CMBS $14,820 -14% 51% 74% Int'l Bank $1,250 2% 75% 72% $5 Domestic Bank $8,201 -19% 66% 68% Insurance $382 -33% 81% 83% $0 Gov't Agency $1,120 -31% 67% 64% Other $5,116 -14% 72% 70% All Apartments $30,888 -16% 63% 70% -$5 * recovery rate before costs and fees -$10 • The recovery rate on liquidations of defaulted apart- 1 2 3 4 1 2 3 4 1 2 3 4 1 2 3 4 1 2 3 ment loans was 70% as of Q3, yet greater recoveries '08 '09 '10 '11 '12 have been available for mid/high-rise properties (85%), especially in the gateway cities (see “Q3’12 % of Sales Associated with Distress % of Sales Associated with Distress Recovery Rates”, published October 10). billions $4 35% Distress • Year-to-date, outstanding distress is down in 30% % of Total $3 25% almost every US market. Several large markets Sales have worked out more than 80% of identified dis- 20% $2 tress including Washington DC, DC/VA burbs, 15% San Francisco, San Jose, Broward, and Nashville. $1 10% Markets resolving the most distress in 2012 include 5% those that had been among the most illiquid such $0 0% as Atlanta, Phoenix, Las Vegas, Baltimore and ter- 1 2 3 4 1 2 3 4 1 2 3 4 1 2 3 4 1 2 3 tiary markets in the Southeast. '08 '09 '10 '11 '12 ©2012 Real Capital Analytics, Inc. All rights reserved. Data believed to be accurate but not guaranteed; subject to future revision; based on properties portfolios $2.5m and greater. 5
  • 6. ® third quarter 2012 Market table: Distress and workouts Current Outstanding Distress Recent Trends YTD Through Q3’12 Current Known Distress Cumulative in Default/ Total Worked Out % Recovery Through October 24, 2012 Total Special Serv Held as REO Outstanding Total Worked Out Rate Inflows Workouts Baltimore 1,045.1 169.3 15.8 185.1 859.9 82% 87% 386.1 416.0 Mid- DC 718.2 51.4 4.0 55.4 662.8 92% 83% - 8.8 DC MD burbs 1,615.4 339.8 - 339.8 1,275.5 79% 77% 20.3 250.7 Atlantic DC VA burbs 1,353.8 - 32.8 32.8 1,321.0 98% 88% 56.0 226.0 Philadelphia 981.8 498.3 34.0 532.3 449.5 46% 74% - 21.6 Pittsburgh 156.4 20.2 1.9 22.1 134.4 86% 96% - 7.8 So NJ 250.2 84.2 - 84.2 166.0 66% 97% - 82.9 All Others 689.1 204.3 72.7 277.1 412.0 60% 84% 104.6 162.0 Mid-Atlantic $6,809.9 $1,367.5 $161.2 $1,528.8 $5,281.2 78% 83% $567.0 $1,175.9 Chicago 2,447.7 734.9 217.3 952.3 1,495.5 61% 68% 56.0 148.5 Midwest Cincinnati 248.3 62.8 14.4 77.3 171.1 69% 74% - 52.5 Cleveland 312.7 56.1 2.6 58.6 254.1 81% 56% 4.1 66.3 Columbus 577.6 222.6 101.8 324.4 253.2 44% 65% 49.4 55.5 Detroit 792.3 97.1 214.2 311.3 481.0 61% 43% 5.3 82.1 Indianapolis 470.7 143.7 83.6 227.3 243.5 52% 65% 14.9 33.3 Kansas City 263.8 78.4 17.3 95.7 168.1 64% 78% 48.3 43.7 Milwaukee 228.7 8.5 121.1 129.6 99.1 43% 68% 5.8 3.5 Minneapolis 91.8 24.2 5.7 29.8 62.0 68% 70% 7.1 2.3 St Louis 255.1 112.4 64.7 177.1 78.0 31% 72% 28.1 18.6 All Others 1,089.6 394.2 100.7 494.9 594.7 55% 63% 53.1 107.6 Midwest $6,778.6 $1,934.8 $943.5 $2,878.3 $3,900.3 58% 64% $272.1 $613.7 Boston 604.4 70.4 155.9 226.3 378.0 63% 77% 11.0 31.7 Northeast Hartford 174.6 39.8 18.1 57.8 116.8 67% 6.0 17.4 Long Island 59.1 - - - 59.1 100% 22.5 22.5 Manhattan 10,005.0 5,198.0 284.3 5,482.4 4,522.7 45% 89% 116.6 1,412.6 No NJ 865.9 160.5 343.6 504.1 361.8 42% 90% 3.9 24.4 NYC Boroughs 1,092.5 387.0 82.5 469.5 623.0 57% 93% 14.4 118.3 Stamford 254.2 24.1 9.3 33.3 220.9 87% 0.4 50.0 Westchester 71.4 5.9 - 5.9 65.5 92% 64% - - All Others 303.7 100.3 38.2 138.5 165.2 54% 76% 7.4 12.2 Northeast $13,430.9 $5,986.1 $931.9 $6,917.9 $6,513.0 48% 89% $182.2 $1,689.2 Atlanta 4,505.2 589.8 929.7 1,519.6 2,985.6 66% 65% 248.4 615.6 Southeast Broward 1,568.9 197.7 73.4 271.1 1,297.8 83% 57% 2.0 199.2 Charlotte 1,206.0 506.0 88.8 594.8 611.2 51% 78% 462.4 322.4 Jacksonville 1,047.7 303.6 138.9 442.5 605.2 58% 55% 47.6 106.2 Miami 3,329.5 550.5 946.3 1,496.8 1,832.7 55% 62% 85.3 218.5 Nashville 547.7 54.3 13.1 67.4 480.3 88% 59% - 173.5 Orlando 2,415.0 294.3 366.5 660.8 1,754.1 73% 62% 41.2 122.8 Palm Beach 1,660.4 451.6 177.2 628.7 1,031.7 62% 64% 198.2 79.5 SW Florida 1,414.1 256.3 61.9 318.2 1,095.9 77% 52% 33.6 100.9 Tampa 2,116.9 380.1 217.8 597.8 1,519.1 72% 60% 58.4 155.8 All Others 5,839.6 1,465.4 811.0 2,276.4 3,563.2 61% 73% 551.5 608.0 Southeast $25,651.1 $5,049.6 $3,824.6 $8,874.1 $16,776.9 65% 65% $1,728.8 $2,702.6 Austin 967.1 286.7 12.0 298.7 668.3 69% 68% 70.6 95.7 Southwest Dallas 2,816.4 688.2 326.0 1,014.3 1,802.1 64% 74% 369.7 362.7 Denver 722.5 235.8 12.8 248.6 473.9 66% 80% - 58.8 Houston 3,061.2 813.1 625.0 1,438.1 1,623.1 53% 71% 201.1 354.4 Phoenix 4,820.8 1,081.7 586.2 1,668.0 3,152.8 65% 65% 178.5 477.0 San Antonio 578.6 176.8 15.0 191.8 386.9 67% 94% 38.8 89.5 All Others 1,701.3 508.8 109.9 618.7 1,082.7 64% 69% 173.0 263.1 Southwest $14,667.9 $3,791.2 $1,686.9 $5,478.0 $9,189.9 63% 68% $1,031.6 $1,701.2 Central CA 338.2 106.8 36.4 143.2 195.0 58% 65% 6.3 34.6 West East Bay 548.4 52.4 161.0 213.3 335.1 61% 79% - 7.8 Hawaii 57.5 - 29.5 29.5 28.0 49% 100% - - Inland Empire 835.0 292.3 115.7 408.0 427.0 51% 78% 7.4 26.5 Las Vegas 3,870.8 1,043.2 1,082.5 2,125.7 1,745.1 45% 59% 133.3 514.6 Los Angeles 2,927.2 431.1 275.1 706.3 2,221.0 76% 85% 82.1 331.1 Orange Co 533.1 108.0 - 108.0 425.2 80% 83% 22.9 0.8 Portland 296.8 95.6 13.6 109.2 187.6 63% 93% 1.6 43.7 Reno 440.5 46.1 198.9 245.1 195.4 44% 64% 31.2 112.0 Sacramento 726.0 173.5 28.2 201.7 524.3 72% 73% 47.9 119.8 San Diego 571.3 46.9 14.5 61.4 509.9 89% 86% 1.7 11.3 San Francisco 2,154.6 98.6 67.3 165.9 1,988.7 92% 87% 4.0 230.2 San Jose 453.0 2.2 2.0 4.2 448.7 99% 78% - 3.1 Seattle 1,273.1 150.9 515.7 666.6 606.4 48% 82% 8.3 59.1 All Others 497.8 243.6 26.6 270.2 227.6 46% 76% 27.7 60.9 West $15,523.4 $2,891.2 $2,567.2 $5,458.4 $10,065.0 65% 77% $374.2 $1,555.4 ©2012 Real Capital Analytics, Inc. All rights reserved. Data believed to be accurate but not guaranteed; subject to future revision; based on properties portfolios $2.5m and greater. 6
  • 7. ® third quarter 2012 top Apartment transactions of Q3’12 Top 25 Property Sales by Investment Volume Transaction Location Inv Vol ($M)* Units PPU Buyer 1 Waterfront at Pu'uloa Ewa Beach, HI $311.0 1,461 212,868 Carmel Partners 2 Apthorp (Bulk Condo) New York, NY 215.1† 110 2,606,773 AREA Property Partners 3 The Beatrice New York, NY 280.0 301 930,233 Equity Residential 4 Savoy Park New York, NY 216.0 1,802 119,867 LM Development Partners JV Citigroup 5 Howard Crossing Ellicott City, MD 186.0 1,350 137,778 Home Properties 6 Oak Grove Village Melrose, MA 175.0 550 318,182 GID 7 Mass Court Washington, DC 168.4 371 453,774 TIAA-CREF 8 Georgian Towers Silver Spring, MD 168.0 890 188,764 Pantzer Properties 9 The Block Austin, TX 165.0 669 246,637 American Campus Communities 10 Sussex at Kingstowne Alexandria, VA 125.5 556 225,719 Praedium Group JV Milestone Group 11 Club Laguna Laguna Beach, CA 120.8 421 286,936 Invesco RE 12 The Brewster New York, NY 98.0 144 680,556 Cornerstone RE Advisers JV Adelco 13 The Electra New York, NY 95.0 163 582,822 Carmel Partners 14 Archstone Legacy Place Dedham, MA 94.3 285 330,702 Archstone 15 Legacy Apartment Homes San Diego, CA 91.0 412 220,874 RV Management Corp 16 Canyon Creek Bothell, WA 90.7 558 162,616 Greystar RE Partners 17 Landmark at Ontario Towne Center Ontario, CA 90.5 469 192,964 Camden Property Trust 18 Hamptons at Town Center Germantown, MD 90.3 768 117,513 AHC 19 Highpoint Apartments Quincy, MA 88.0 394 223,350 Berkshire Property Advisors 20 Avalon Arlington Heights Arlington Heights, IL 87.3 409 213,325 John Hancock 21 Waterford Hayward, CA 86.5 544 159,007 Kennedy Wilson JV 22 Mantena New York, NY 84.0 98 857,143 Equity Residential 23 Circa Green Lake Seattle, WA 83.1 199 417,550 TIAA-CREF 24 88 Lexington Avenue New York, NY 82.0 180 455,556 Westbrook Partners 25 Preserve at Travis Creek Austin, TX 79.5 608 130,757 Heitman Top 10 Portfolio Sales Transaction Location Inv Vol ($M)* Units PPU Buyer 1 Archstone Multiple $8,765.6† 67,962 242,783 Lehman Brothers Holdings Inc 2 Campus Acquisitions Merger Multiple 627.0 2,210 283,710 American Campus Communities 3 Kushner MD APT Portfolio '12 Multiple, MD 125.0† 5,517 90,629 Kushner Companies 4 UDR/DRA Advisors Apt Portfolio 2012 Multiple 431.0 4,454 106,870 DRA Advisors JV Milestone Group 5 Landmark Apt Portfolio 12 Multiple n/a 5,353 n/a Apartment Trust of America 6 35 Building Pinnacle Note Sale New York, NY 139.2 1,029 140,914 Heritage Realty JV Dune Capital Mgmt 7 Lynd JV Florida Value Partners CVI Portfolio Multiple 141.0 2,990 47,157 Lynd JV Florida Value Partners 8 State Street Development Apt Portfolio 2012 Multiple, MA 115.9 849 136,523 Preservation of Affordable Housing 9 Aires Portfolio New York, NY 51.0† 328 310,976 Vornado Realty Trust 10 Laurel Square I II Laurel, MD 102.0 982 103,870 Hampshire Properties * When prices are not known, estimated prices are used in the ranking but are not shown. In the case of partial interest deals, the pro-rated share of the property was used for the transaction price and the PPU/PPSF was based on the full 100% price. † Partial Interest ©2012 Real Capital Analytics, Inc. All rights reserved. Data believed to be accurate but not guaranteed; subject to future revision; based on properties portfolios $2.5m and greater. 7
  • 8. ® third quarter 2012 top Apartment Brokers through Q3’12 top 25 By investment volume By Region* Garden Mid/high-rise All Apartment Mid-Atlantic CBRE 7,176,568,723 CBRE 2,055,429,604 CBRE 9,231,998,327 CBRE Apartment Realty Advisors 3,083,401,450 HFF 1,220,595,193 Apartment Realty Advisors 3,763,506,862 Apartment Realty Advisors Marcus Millichap 2,941,390,658 Eastdil Secured 987,086,801 Marcus Millichap 3,710,873,661 First Capital Realty Cushman Wakefield 1,690,450,425 Marcus Millichap 769,483,003 HFF 2,649,720,198 Moran Co HFF 1,429,125,005 Apartment Realty Advisors 680,105,412 Cushman Wakefield 2,254,441,767 Marcus Millichap Hendricks Ptnrs 1,194,421,846 Cushman Wakefield 563,991,342 Moran Co 1,524,728,841 Midwest Moran Co 1,077,826,506 Jones Lang LaSalle 497,975,000 Eastdil Secured 1,522,644,801 CBRE Jones Lang LaSalle 672,705,771 Massey Knakal 495,161,244 Hendricks Ptnrs 1,286,897,343 Marcus Millichap Eastdil Secured 535,558,000 Moran Co 446,902,335 Jones Lang LaSalle 1,170,680,771 HFF Colliers International 387,710,497 Rosewood Realty Group 444,573,500 Colliers International 584,576,497 Moran Co Transwestern 348,887,285 Prince Realty Advisors 280,000,000 Massey Knakal 519,661,244 Hendricks Ptnrs Engler Financial Group 289,425,000 Besen Associates 222,320,000 Engler Financial Group 454,275,000 Northeast First Capital Realty 279,550,500 Colliers International 196,866,000 Rosewood Realty Group 449,573,500 Eastdil Secured Grubb Ellis 183,749,968 Eastern Consolidated 177,706,876 Transwestern 348,887,285 CBRE Newmark Grubb Knight Frank 177,241,875 Engler Financial Group 164,850,000 First Capital Realty 341,420,500 Massey Knakal Lee Associates 121,600,000 Ariel Property Advisors 95,082,545 Prince Realty Advisors 280,000,000 HFF Rosewood Realty Group Friedman Integrated #REF! Portman Realty 95,000,000 Grubb Ellis 227,150,968 NAI Global 113,448,979 Hendricks Ptnrs 92,475,497 Besen Associates 222,320,000 Southeast Southeast Apartment Partners 101,181,000 Multi Investment Group 79,150,000 Newmark Grubb Knight Frank 194,291,875 CBRE Cassidy Turley 90,383,883 Arroyo Coates 75,801,750 Eastern Consolidated 177,706,876 Apartment Realty Advisors Cushman Wakefield Kidder Mathews 87,145,743 GFI Capital Resources 70,244,774 NAI Global 137,283,979 Jones Lang LaSalle Houston Income Properties 85,170,396 Alain Pinel 67,838,304 Rockwood RE Advisors 130,161,688 Engler Financial Group Kislak 83,520,420 First Capital Realty 61,870,000 Kidder Mathews 122,900,743 Sperry Van Ness 80,708,000 Studley 56,000,000 Lee Associates 121,600,000 Southwest CBRE Rockwood RE Advisors 76,850,000 Rockwood RE Advisors 53,311,688 Friedman Integrated #REF! Apartment Realty Advisors $0.0 $4.0 $8.0 $0.0 $1.0 $2.0 $0.0 $5.0 $10.0 HFF Billions Billions Billions Marcus Millichap Moran Co top 15 By number of Properties West Garden Mid/high-rise All Apartment Marcus Millichap CBRE CBRE 350 Marcus Millichap 71 CBRE 397 Cushman Wakefield Marcus Millichap 260 Massey Knakal 65 Marcus Millichap 331 Moran Co Apartment Realty Advisors 129 HFF 59 Apartment Realty Advisors 151 Hendricks Ptnrs Hendricks Ptnrs 108 CBRE 47 Hendricks Ptnrs 113 Cushman Wakefield 81 Rosewood Realty Group 47 HFF 109 *ranked by investment volume HFF 50 Besen Associates 28 Cushman Wakefield 101 Colliers International 33 Apartment Realty Advisors 22 Massey Knakal 66 Methodology Moran Co 33 Cushman Wakefield 20 Rosewood Realty Group 48  Full credit assigned to sellers’ Transwestern 30 Eastdil Secured 19 Jones Lang LaSalle 42 representative. When two brokers Jones Lang LaSalle 29 Eastern Consolidated 19 Colliers International 40 represent same seller, both sellers’ representatives assigned full NAI Global 26 Jones Lang LaSalle 13 Moran Co 40 credit. For partial-interest, rankings Grubb Ellis 24 HPNY 11 NAI Global 30 are based on the pro-rated share Newmark Grubb Knight Frank 18 Alain Pinel 10 Transwestern 30 of the total property or portfolio value. For more information Keller Williams 14 GFI Capital Resources 9 Eastdil Secured 29 on rankings please visit www. Brown Realty Advisors 10 Ariel Property Advisors 8 Besen Associates 28 rcanalytics.com/Misc/Brokers_ Ranking_Methodology.pdf 0 200 400 0 50 100 0 250 500 ©2012 Real Capital Analytics, Inc. All rights reserved. Data believed to be accurate but not guaranteed; subject to future revision; based on properties portfolios $2.5m and greater. 8
  • 9. ® third quarter 2012 Selected investment Sales transactions Reported in the Past 45 Days Property Name Units Price Owner Address Year Built PPU Seller Location Notes Qualifier Broker Mid-Atlantic Mass Court 371 $168,383,333 TIAA-CREF from CBRE Global Investors 300 Massachusetts Ave Nw 2004 $453,863 by CBRE Washington, DC Mid/high-rise approximate Hamptons at Town Center 768 $90,250,000 AHC from Harbor Group Int'l by CBRE 19775 Crystal Rock 1982 $117,513 Germantown, MD Garden confirmed Chase Heritage 236 $42,500,000 Continental Realty by Cushman 1212 Chase Heritage Cir 1986 $180,085 Wakefield from Henderson Global Sterling, VA Garden approximate Investors by Cushman Wakefield Curren Terrace 318 $29,800,000 BET Investments from 1011 New Hope St 1970 $93,711 Home Properties by CBRE Norristown, PA Mid/high-rise approximate Midwest 1401 South State 278 $70,500,000 Marquette Cos JV American Realty 1401 S State St 2008 $253,597 Advisors JV Hunt from Lincoln Property Chicago, IL Mid/high-rise confirmed Co JV Equity Residential by HFF The Crossing at Barry Road 624 $54,775,000 GoldOller RE Invts from 7831 Nw Roanridge Rd 1997 $87,780 Creekstone Partners JV Wafra Investment Kansas City, MO Garden confirmed Advisory Group by CBRE Stadium Village Flats 120 $43,000,000 Harrison Street Real Estate 818 Washington Ave Se 2012 $358,333 Capital from Opus Minneapolis, MN Mid/high-rise approximate Northeast Mantena 98 $84,000,000 Equity Residential from Joy 433-439 W 37th St 2011 $857,143 Construction Corp by HFF New York, NY Mid/high-rise confirmed 425 Third Avenue 102 $44,000,000 Benchmark RE Group JV Western Heritable 425 3rd Ave 1967 $431,373 Investment from Midas Management New York, NY Mid/high-rise approximate Wellington Place 137 $40,058,750 McMorgan Co by CBRE from 34 Brainard Ave 2005 $292,400 Northwestern Mutual by CBRE Medford, MA Mid/high-rise confirmed Eagle Rock Advisors by Institutional Wintergreen of Westville 294 $39,500,000 Property Advisors - Marcus Millichap Company 400 Blake St 2008 $134,354 from US Bank NA by Institutional Property New Haven, CT Mid/high-rise confirmed Advisors - Marcus Millichap Company The 163 Washington Condominiums 49 $31,500,000 ARC NYRR from AE 163-171 Washington Ave 2010 $642,857 Real Estate Holdings Brooklyn, NY Mid/high-rise confirmed Southeast Windsor at Tryon Village 393 $54,000,000 Guardian Life Insurance Co from JP 2000 Crossroads Manor Ct 2007 $137,405 Morgan Asset Management by Engler Cary, NC Garden confirmed Financial Group The Province 235 $49,420,750 EdR from Edwards Companies 504 Boxelder Way 2010 $210,301 Greenville, NC Garden confirmed ©2012 Real Capital Analytics, Inc. All rights reserved. Data believed to be accurate but not guaranteed; subject to future revision; based on properties portfolios $2.5m and greater. 9
  • 10. ® third quarter 2012 Selected investment Sales transactions Reported in the Past 45 Days Property Name Units Price Owner Address Year Built PPU Seller Location Notes Qualifier Broker Lost Creek Resort at Lakewood Ranch 272 $39,250,700 Inland Real Estate Corp from PAC Land 11140 Lost Creek Ter 2011 $144,304 Development Corp by HFF Bradenton, FL Garden confirmed Colonial Grand@Research Park 370 $38,000,000 Colonial Properties Trust from 400 Stone Lion Dr 2002 $102,703 Tuckerman Group Durham, NC Garden approximate Links at Windsor Park 280 $33,600,000 Catalyst Dev Ptnrs from TA Realty by 13700 Sutton Park Dr N 1994 $120,000 CBRE Jacksonville, FL Garden approximate Stoneridge Farms at the Hunt Club 364 $28,969,600 CRES Management from Flournoy 2325 Nashville Pike 2002 $79,587 Companies by Apartment Realty Advisors Gallatin, TN Garden approximate Southwest District on 5th 208 $67,000,000 EdR from Campus Apartments 550 N 5th Ave 2012 $322,115 Tucson, AZ Mid/high-rise approximate Prairie Creek 464 $52,500,000 Pure Multi-Family REIT from MA Real 3560 Alma Rd 1996 $113,147 Estate Richardson, TX Garden confirmed Calvera Point 276 $37,750,000 Waterton Associates from BRE 9100 Vance St 1994 $136,775 Properties by Cushman Wakefield Broomfield, CO Garden approximate Alexan Star Ranch 396 $36,630,000 Lincoln Property Co from Trammell 150 Klattenhoff Ln 2009 $92,500 Crow Residential (TCR) by CBRE Hutto, TX Garden confirmed Brookstone 528 $35,570,000 Bascom Group from Variable Annuity 4424 E Baseline Rd 1988 $67,367 Life Insurance Co. by Cushman Wakefield Phoenix, AZ Garden approximate West Waterfront at Pu'uloa 1,461 $311,000,000 Carmel Partners from Cirrus Asset 5105 Iroquois Ave 1965 $212,868 Managment Inc OBO Hunt by Eastdil Ewa Beach, HI Garden confirmed Secured Club Laguna 421 $120,800,000 Invesco RE from Shea Homes by HFF 350 The Club Dr 1988 $286,936 Laguna Beach, CA Garden approximate Circa Green Lake 199 $83,013,776 TIAA-CREF from Prudential RE 6900 E Green Lake Way N 2009 $417,155 Investors (PREI) JV Trammell Crow Seattle, WA Mid/high-rise confirmed by Cushman Wakefield Waterford Place 360 $58,410,000 Grosvenor from Archstone by 13305 NE 171st St 1989 $162,250 Cushman Wakefield Woodinville, WA Garden confirmed Archstone Venice on Rose 70 $56,200,000 Archstone by Institutional Property 512 Rose Avenue 2011 $802,857 Advisors - Marcus Millichap Company from Venice, CA Garden confirmed Gerding Edlen by Marcus Millichap Granite Point 384 $45,500,000 Matteson Cos from Northwestern 4500 Truxel Rd 2003 $118,490 Mutual by Colliers International Sacramento, CA Garden confirmed ©2012 Real Capital Analytics, Inc. All rights reserved. Data believed to be accurate but not guaranteed; subject to future revision; based on properties portfolios $2.5m and greater. 10