
Empfohlen
Weitere ähnliche Inhalte
Andere mochten auch
Andere mochten auch (16)
Kürzlich hochgeladen
Kürzlich hochgeladen (20)
Channel Affinity Index Report Sample
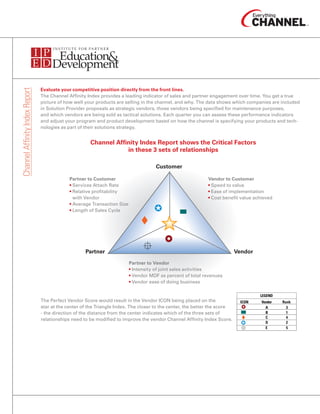
- 1. Evaluate your competitive position directly from the front lines. Channel Affinity Index Report The Channel Affinity Index provides a leading indicator of sales and partner engagement over time. You get a true picture of how well your products are selling in the channel, and why. The data shows which companies are included in Solution Provider proposals as strategic vendors, those vendors being specified for maintenance purposes, and which vendors are being sold as tactical solutions. Each quarter you can assess these performance indicators and adjust your program and product development based on how the channel is specifying your products and tech- nologies as part of their solutions strategy. Customer Channel Affinity Index Report shows the Critical Factors in these 3 sets of relationships Customer Partner to Customer Vendor to Customer • Services Attach Rate • Speed to value • Relative profitability • Ease of implementation with Vendor • Cost benefit value achieved • Average Transaction Size • Length of Sales Cycle Partner Partner Vendor Partner to Vendor • Intensity of joint sales activities • Vendor MDF as percent of total revenues • Vendor ease of doing business LEGEND The Perfect Vendor Score would result in the Vendor ICON being placed on the ICON Vendor Rank star at the center of the Triangle Index. The closer to the center, the better the score A 3 B 1 - the direction of the distance from the center indicates which of the three sets of C 4 relationships need to be modified to improve the vendor Channel Affinity Index Score. D 2 E 5 LEGEND ICON Vendor Rank A 3 B 1 C 4 D 2 E 5
- 2. IPED Annual Research Subscription Includes: IPED Annual Research Subscription Channel Affinity Index Reports – delivered quarterly n The channel affinity index quarterly report provides a blueprint for your field sales team including details that indentify: • Which vendors Solution Providers are working with • Which vendors Solution Providers are emphasizing and de-emphasizing on a quarterly basis. As a result, channel teams develop a keener awareness of how Solution Providers relate to their end customers and how vendors fit into the relationship. You’ll be able to identify the areas where you performed well with insight into specific program components that need to be modified to improve your Channel Affinity Index, such as: • What factors cause a Solution Provider to work with, or not work with, a particular vendor? • How much is actually being done from a frequency or dollar value? • What areas should you be focusing your channel sales efforts? • What is the channel’s perception of the quality of an offering in terms of value to the customer? • What is it about a product that makes a partner select and sell it? • How much impact does a factor affect the Solution Providers choice? Global State of the Channel Market Study n The Global State of the Channel Study provides a macro and micro view of channel trends in emerging markets as well as the dynamics of each market. It also identifies what investments IT vendors need to make and where they should be allocating their resources to secure the highest return on investment. Lastly, the research examines global business models for Solution Providers as well as opportunities and challenges for growth. 2008 IPED Prescriptive Reports n With your IPED Annual Research Subscription you receive one additional report per technology segment to help maximize business performance and profitability through best practices in channel development and business management. • Trends for Success in Managed Services (Global) • 2008 Partner Program Differentiators: Getting Ahead of the Competition • Identifying, Engaging and Recruiting Growth Partners • Characteristics and KPIs of the Most Profitable Solution Providers of 2008 • Incentives that Work: Driving Behavior in Every Aspect of the Sales Cycle • Best Practices in Partner Enablement: Sales, Marketing and Technical training (Global) • Creating Partner Loyalty by Driving Services-Attach Rates • Best of the Best: In Depth Analysis of CRN Channel Champs, the cause and effect • Best of the Best: In Depth Analysis of VARBusiness ARC Winners, the cause and effect • State of Distribution 2008
- 3. Select from the technology categories and subcategories and every quarter you will receive a Channel Affinity Index SMB and Enterprise Categories & Subcategories Report which tracks channel pre- and post-sales activity to SMB and Enterprise customers based on the technology segment(s) you select. Security Systems SMB ENT SMB ENT Security Management Software Servers (x86) (Identity and Access Management (Encryption, Event Management) Intel-based servers Security management software, including identity management, Servers (Unix, midrange) identifies individuals in a system and controls their access to Unix servers & midrange servers resources within that system or network by associating user rights Desktops and restrictions with each identified individual Desktops Internet Security Software (content filtering) Laptops Software that automatically detects and removes viruses, spyware or other malicious code online and/or blocks access to unauthorized Web Laptops, notebooks sites and other online content Mobile devices (handhelds, smart phones) Network security (anti-virus, intrusion Handhelds, smart phones protection, firewall, email security) Software that protects the network from outside and inside attacks Printing and Imaging and vulnerabilities. Software includes firewalls, VPN, IDS/IPS, gateway SMB ENT anti-virus, anti-spam, and other network-based content filtering. Security Appliances Multifunction Devices Hardware device, typically sealed, that performs one or more of these All-in-one devices that combine printing, scanning, copying and faxing functions: Firewall, UTM (Unified Threat Management), VPN, Network functions Access Control (NAC), anti-malware, anti-spyware, anti-spam, anti- Network Color Laser virus, intrusion prevention or detection, content filtering. Network color laser Document management software Storage Software used to track and store electronic documents and/or images SMB ENT of paper documents Storage Area Networks (SAN) Monitors/Displays Centralized SANs connect multiple servers to a centralized pool of Monitors/displays disk storage, treating all of a company’s storage as a single resource. Distributed SANs uses one or more Fibre Channel or SCSI switches to Voice and Data Networking connect nodes within buildings or campuses. Network Attached Storage (NAS) SMB ENT Network-attached storage (NAS) ishard disk storage that is set up with Wireless/Mobility Technologies its own network address rather than being attached to the department (i.e. WANs, WLANs, remote access) computer that is serving applications to a network’s workstation users Wireless networking includes any Wireless LAN Devices Rated For Storage Management Software Uses More Demanding Than A Single Access Point In A Home Storage management software includes data protection, disaster Hardware (switches, routers, hubs) recovery and application availability and/or unbundled SAN or NAS Switches, Routers And Hubs management software or virtualization software Voice over IP Storage Virtualization Hardware and software for delivering voice traffic over IP networks, Software that provides for abstraction at any layer in the storage including IP-PBXes, softswitches, voice-enabled routers, software and hardware stack gateways, & IP Backup and recovery Unified Communications Technology that backs up and restores operations critical to running a Integration of disparate communications systems, media, devices business, including lost data (records, hardware, software, etc.), com- and applications, such as fixed and mobile voice, e-mail, instant munications (incoming, outgoing, toll-free, fax, etc.), workspace, and messaging, desktop and advanced business applications, Internet other business processes after a natural or human-induced disaster Protocol (IP)-PBX, voice over IP (VoIP), presence, voice-mail, fax, audio External Storage (disk drives, tapes) video and web conferencing, unified messaging, unified voicemail, and whiteboarding Software Infrastructure Business Applications SMB ENT SMB ENT Operating Systems (commercial and open source) ERP Software that manages the sharing of the resources of a computer and provides programmers with an interface used to access those Packaged software for manufacturing, order entry, accounts resources receivable and payable, general ledger, purchasing, warehousing, transportation and human resources that integrate data sources and Databases processes of an organization Databases CRM Web Application Servers (middleware) Various software applications such as sales force automation, market- Software engine that can be used to develop and deploy applications ing campaigns and call centers that manage the a business’ customer to client computers or devices, typically through the Internet and using interactions and information the HyperText Transfer Protocol Business intelligence Collaboration (includes messaging) Software for the collection, integration, analysis, and presentation of Software, including messaging, that enables users to collaborate business information to enable better business decisionmaking and online or over the network, often in real time trending Portals/Content Management CAD/CAM CAE (Mechanical Design) Technologies that support the evolutionary life cycle of digital informa- Integration of design, manufacturing and engineering systems during tion and provide single point of entry for users and developers inside product development. and outside an organization Server Virtualization Software that masks server resources, including the number and identity of individual physical servers, processors, and operating systems, from server users and divides one physical server into multiple isolated virtual environments. Systems Management Software Software that manages, diagnoses and troubleshoots the IT network, including operations management, IT help desk, performance monitoring, and event automation for all operating environments.
- 4. The Channel Affinity Index provides information that enables vendors to track their market performance, Market Performance by Vendor both in absolute numbers, and relative to competitors in the selected technology segment. Table 1: Analysis of Proposals Written Actual: 6 Months Ago Current Planned: Next 6 Months Number Proposals % Number Proposals % Number Proposals % Proposals Value: $M Share Proposals Value: Share Proposals Value: $M Share RANK Vendor $M (1) 1 Vendor A 15,120 $876 25.2% 17,388 $1,008 25.0% 21,735 $1,330 26.3% 2 Vendor B 13,425 $766 22.1% 14,096 $957 23.7% 17,620 $1,120 22.1% 3 Vendor C 9,865 $733 21.1% 9,372 $769 19.1% 11,715 $1,092 21.6% 4 Vendor D 10,231 $673 19.4% 12,789 $727 18.0% 15,986 $894 17.7% 5 Vendor E 5,432 $424 12.2% 5,867 $572 14.2% 7,333 $624 12.3% Total 54,073 $3,472 100.0% 59,511 $4,033 100.0% 74,389 $5,060 100.0% % Change 10.1% 16.2% 25.0% 25.5% Table 2: Analysis of Actual Sales Actual: 6 Months Ago Current Planned: Next 6 Months Number Contracts % Number Contracts % Number Contracts % Contracts Value: $M Share Contracts Value: Share Contracts Value: $M Share RANK Vendor $M (1) 1 Vendor A 15,120 $876 25.2% 17,388 $1,008 25.0% 21,735 $1,330 26.3% 2 Vendor B 13,425 $766 22.1% 14,096 $957 23.7% 17,620 $1,120 22.1% 3 Vendor C 9,865 $733 21.1% 9,372 $769 19.1% 11,715 $1,092 21.6% 4 Vendor D 10,231 $673 19.4% 12,789 $727 18.0% 15,986 $894 17.7% 5 Vendor E 5,432 $424 12.2% 5,867 $572 14.2% 7,333 $624 12.3% Total 54,073 $3,472 100.0% 59,511 $4,033 100.0% 74,389 $5,060 100.0% % Change 10.1% 16.2% 25.0% 25.5%
- 5. Detailed data indicate the prioritized ranking of the factors most critical to determining the IPED Channel Affinity Index. Prioritized Channel Affinity Index Factors Table 3: Prioritized Channel Affinity Index Factors Relationship Factor RANK Max Score % of Total Score Partner/Customer Services Attach Rate 1 150 15% Relative profitability with Vendor 2 100 10% Average Transaction Size 3 75 8% Length of Sales Cycle 4 50 5% Subtotal 375 38% Partner/Vendor Intensity of joint sales activity 1 150 15% Vendor MDF as a % of revenues 2 125 13% Vendor ease of doing business 3 100 10% Subtotal 375 38% Vendor/Customer Speed to value 1 150 15% Ease of implementation 2 75 8% Cost of benefit value achieved 3 25 3% Subtotal 250 25% Total 1000 100%
- 6. The IPED Channel Affinity Index that illustrates how each vendor is perceived in Prioritized Channel Affinity Index the Channel based on the three sets of Relationships. Table 4: Channel Affinity Index RANK Vendor 6 Months Ago Current % Change 1 Vendor A 765 815 6.5% 2 Vendor B 795 764 (3.9%) 3 Vendor C 765 725 (5.2%) 4 Vendor D 675 695 3.0% 5 Vendor E 576 435 (24.5%) Average 715 687 (4.0%) Channel Affinity Index Report shows the Critical Factors in these 3 sets of relationships Customer Partner to Customer Vendor to Customer • Services Attach Rate • Speed to value • Relative profitability • Ease of implementation with Vendor • Cost benefit value achieved • Average Transaction Size • Length of Sales Cycle Partner Vendor Partner to Vendor • Intensity of joint sales activities • Vendor MDF as percent of total revenues • Vendor ease of doing business The Perfect Vendor Score would result in the Vendor ICON being placed on the star at the center of the Triangle Index. The closer to the center, the better the score - the direction of the distance from the center indicates which of the three sets of relationships need to be modified to improve the vendor Channel Affinity Index Score. LEGEND ICON Vendor Rank A 3 B 1 C 4 D 2 E 5