SlideShare ist ein Scribd-Unternehmen logo
1 von 4
Downloaden Sie, um offline zu lesen
R – Excel Integration using XLConnect package

         Example of writing R data frames and graphs to Excel templates


Create and save Excel template on Desktop:

          •   Two predefined cell styles called header (Font - Calibry (Body), Font Style - Bold
              Italic, Size - 11, Fill - Blue) and number (Number, Comma 1000 separator, Decimal
              Places - 3).
          •   Sheet2 – Table with formatting range Sheet2!B2:C3 as Number, Comma 1000
              Separator and Decimal Places - 2


          •   Named Region graph - Sheet2!$A$5


R code (requires libraries XLConnect, plyr and ggplot2):

#Import XLConnect library

library(XLConnect)

#Define working directory

setwd("C:UsersPCDesktop")

#Simulate some data frame

set.seed(10)

DF <- data.frame(Gender=sample(c("female", "male"), 100, rep=TRUE),

                    Consumption=runif(100, 1000, 2000), stringsAsFactors=FALSE)

#Load Excel template file named template.xls
wb <- loadWorkbook("C:UsersPCDesktoptemplate.xlsx")

#Import predefined cell styles

header <- getCellStyle(wb, name = "header")

number <- getCellStyle(wb, name="number")

#Write data frame to Sheet1

writeWorksheet(wb, DF, sheet="Sheet1", startRow=1, startCol=1)

#Applied predefined cell styles

setCellStyle(wb, sheet="Sheet1", row=rep(1,ncol(DF)), col=rep(c(1:2), 1),

            cellstyle=header)

setCellStyle(wb, sheet="Sheet1", row=2:(nrow(DF)+1), col=rep(c(1:2),
each=nrow(DF)),

            cellstyle=number)

#Keep predefined cell style from Sheet2

setStyleAction(wb, XLC$"STYLE_ACTION.PREDEFINED")

#Summarize data by gender using plyr package

library(plyr)

DF1 <- ddply(DF, .(Gender), summarise,

                              No_Respondents=length(Gender),

                              Total_Consumption=sum(Consumption))

#Write data frame to Sheet2

writeWorksheet(wb, sheet="Sheet2", DF1[,-1], header=FALSE, startRow=2,
startCol=2)

#Create graph using ggplot2 library and save it as png file

png("graph1.png")

library(ggplot2)

ggplot(DF1, aes(Gender, No_Respondents, fill=Gender)) +

geom_bar(position = "dodge")+ scale_fill_manual(values=c("darkgray",
"lightblue"))

dev.off()

#Add graph (png to) to Excel file

#Named region graph on Sheet2

addImage(wb, filename = "graph1.png", name = "graph",
originalSize = TRUE)

#Deleted png file from working directory

file.remove("graph1.png")

#Save changes

saveWorkbook(wb)

R info session:
> sessionInfo()

R version 2.15.0 (2012-03-30)

Platform: i386-pc-mingw32/i386 (32-bit)


locale:

[1] LC_COLLATE=English_United States.1252       LC_CTYPE=English_United States.1252

[3] LC_MONETARY=English_United States.1252 LC_NUMERIC=C

[5] LC_TIME=English_United States.1252


attached base packages:

[1] stats         graphics   grDevices utils     datasets   methods    base


other attached packages:

[1] ggplot2_0.9.1            plyr_1.7.1          XLConnect_0.1-9
XLConnectJars_0.1-4

[5] rJava_0.9-3


loaded via a namespace (and not attached):

 [1] colorspace_1.1-1        dichromat_1.2-4    digest_0.5.2          grid_2.15.0

 [5] labeling_0.1            MASS_7.3-17        memoise_0.1           munsell_0.3

 [9] proto_0.3-9.2           RColorBrewer_1.0-5 reshape2_1.2.1        scales_0.2.1

[13] stringr_0.6
Results:

Sheet1:


Sheet2:

Weitere ähnliche Inhalte

Was ist angesagt?

Machine Learning Game Changer for IT - Maartens Lourens
Machine Learning Game Changer for IT - Maartens LourensMachine Learning Game Changer for IT - Maartens Lourens
Machine Learning Game Changer for IT - Maartens LourensOpenCredo
 
ggtimeseries-->ggplot2 extensions
ggtimeseries-->ggplot2 extensions ggtimeseries-->ggplot2 extensions
ggtimeseries-->ggplot2 extensions Dr. Volkan OBAN
 
Create a correlation plot from joined tables and lag times
Create a correlation plot from joined tables and lag timesCreate a correlation plot from joined tables and lag times
Create a correlation plot from joined tables and lag timesDougLoqa
 
Excel macro for integration of a function
Excel macro for integration of a functionExcel macro for integration of a function
Excel macro for integration of a functionUpendra Lele
 
SATySFiのこれからの課題たち
SATySFiのこれからの課題たちSATySFiのこれからの課題たち
SATySFiのこれからの課題たちT. Suwa
 
Data Visualization With R: Learn To Modify Font Of Graphical Parameters
Data Visualization With R: Learn To Modify Font Of Graphical ParametersData Visualization With R: Learn To Modify Font Of Graphical Parameters
Data Visualization With R: Learn To Modify Font Of Graphical ParametersRsquared Academy
 
A quick introduction to R
A quick introduction to RA quick introduction to R
A quick introduction to RAngshuman Saha
 
R Data Visualization: Learn To Add Text Annotations To Plots
R Data Visualization: Learn To Add Text Annotations To PlotsR Data Visualization: Learn To Add Text Annotations To Plots
R Data Visualization: Learn To Add Text Annotations To PlotsRsquared Academy
 
Hive function-cheat-sheet
Hive function-cheat-sheetHive function-cheat-sheet
Hive function-cheat-sheetDr. Volkan OBAN
 
random forest regression
random forest regressionrandom forest regression
random forest regressionAkhilesh Joshi
 
Data Visualization With R: Learn To Modify Title, Axis Labels & Range
Data Visualization With R: Learn To Modify Title, Axis Labels & RangeData Visualization With R: Learn To Modify Title, Axis Labels & Range
Data Visualization With R: Learn To Modify Title, Axis Labels & RangeRsquared Academy
 
Mapfilterreducepresentation
MapfilterreducepresentationMapfilterreducepresentation
MapfilterreducepresentationManjuKumara GH
 
CLASS XII COMPUTER SCIENCE MONTHLY TEST PAPER
CLASS XII COMPUTER SCIENCE MONTHLY TEST  PAPERCLASS XII COMPUTER SCIENCE MONTHLY TEST  PAPER
CLASS XII COMPUTER SCIENCE MONTHLY TEST PAPERRc Os
 

Was ist angesagt? (20)

Machine Learning Game Changer for IT - Maartens Lourens
Machine Learning Game Changer for IT - Maartens LourensMachine Learning Game Changer for IT - Maartens Lourens
Machine Learning Game Changer for IT - Maartens Lourens
 
Lrz kurse: r visualisation
Lrz kurse: r visualisationLrz kurse: r visualisation
Lrz kurse: r visualisation
 
Logging in JavaScript - Part-5
Logging in JavaScript - Part-5Logging in JavaScript - Part-5
Logging in JavaScript - Part-5
 
ggtimeseries-->ggplot2 extensions
ggtimeseries-->ggplot2 extensions ggtimeseries-->ggplot2 extensions
ggtimeseries-->ggplot2 extensions
 
Create a correlation plot from joined tables and lag times
Create a correlation plot from joined tables and lag timesCreate a correlation plot from joined tables and lag times
Create a correlation plot from joined tables and lag times
 
C# example (Polymorphesim)
C# example (Polymorphesim)C# example (Polymorphesim)
C# example (Polymorphesim)
 
Excel macro for integration of a function
Excel macro for integration of a functionExcel macro for integration of a function
Excel macro for integration of a function
 
Python Set.pptx
Python Set.pptxPython Set.pptx
Python Set.pptx
 
SATySFiのこれからの課題たち
SATySFiのこれからの課題たちSATySFiのこれからの課題たち
SATySFiのこれからの課題たち
 
R meets Hadoop
R meets HadoopR meets Hadoop
R meets Hadoop
 
Data Visualization With R: Learn To Modify Font Of Graphical Parameters
Data Visualization With R: Learn To Modify Font Of Graphical ParametersData Visualization With R: Learn To Modify Font Of Graphical Parameters
Data Visualization With R: Learn To Modify Font Of Graphical Parameters
 
A quick introduction to R
A quick introduction to RA quick introduction to R
A quick introduction to R
 
R Data Visualization: Learn To Add Text Annotations To Plots
R Data Visualization: Learn To Add Text Annotations To PlotsR Data Visualization: Learn To Add Text Annotations To Plots
R Data Visualization: Learn To Add Text Annotations To Plots
 
Hive function-cheat-sheet
Hive function-cheat-sheetHive function-cheat-sheet
Hive function-cheat-sheet
 
Python programing
Python programingPython programing
Python programing
 
random forest regression
random forest regressionrandom forest regression
random forest regression
 
Data Visualization With R: Learn To Modify Title, Axis Labels & Range
Data Visualization With R: Learn To Modify Title, Axis Labels & RangeData Visualization With R: Learn To Modify Title, Axis Labels & Range
Data Visualization With R: Learn To Modify Title, Axis Labels & Range
 
RHadoop の紹介
RHadoop の紹介RHadoop の紹介
RHadoop の紹介
 
Mapfilterreducepresentation
MapfilterreducepresentationMapfilterreducepresentation
Mapfilterreducepresentation
 
CLASS XII COMPUTER SCIENCE MONTHLY TEST PAPER
CLASS XII COMPUTER SCIENCE MONTHLY TEST  PAPERCLASS XII COMPUTER SCIENCE MONTHLY TEST  PAPER
CLASS XII COMPUTER SCIENCE MONTHLY TEST PAPER
 

Andere mochten auch

Visualization of contingency table in R - vcd package
Visualization of contingency table in R - vcd packageVisualization of contingency table in R - vcd package
Visualization of contingency table in R - vcd packageAndrija Djurovic
 
Debt Collection Report - using R in Finance
Debt Collection Report  - using R in FinanceDebt Collection Report  - using R in Finance
Debt Collection Report - using R in FinanceAndrija Djurovic
 
Roll Rate Model - Using R in Finance
Roll Rate Model - Using R in FinanceRoll Rate Model - Using R in Finance
Roll Rate Model - Using R in FinanceAndrija Djurovic
 
Intro to R for SAS and SPSS User Webinar
Intro to R for SAS and SPSS User WebinarIntro to R for SAS and SPSS User Webinar
Intro to R for SAS and SPSS User WebinarRevolution Analytics
 
Seguimiento del modelo interno de riesgo
Seguimiento del modelo interno de riesgoSeguimiento del modelo interno de riesgo
Seguimiento del modelo interno de riesgoAIS
 
Data Exploration, Validation and Sanitization
Data Exploration, Validation and SanitizationData Exploration, Validation and Sanitization
Data Exploration, Validation and SanitizationVenkata Reddy Konasani
 
Model building in credit card and loan approval
Model building in credit card and loan approval Model building in credit card and loan approval
Model building in credit card and loan approval Venkata Reddy Konasani
 

Andere mochten auch (13)

Visualization of contingency table in R - vcd package
Visualization of contingency table in R - vcd packageVisualization of contingency table in R - vcd package
Visualization of contingency table in R - vcd package
 
Debt Collection Report - using R in Finance
Debt Collection Report  - using R in FinanceDebt Collection Report  - using R in Finance
Debt Collection Report - using R in Finance
 
R and Access 2007
R and Access 2007R and Access 2007
R and Access 2007
 
Data aggregation in R
Data aggregation in RData aggregation in R
Data aggregation in R
 
Polar plots with R
Polar plots with RPolar plots with R
Polar plots with R
 
Roll Rate Model - Using R in Finance
Roll Rate Model - Using R in FinanceRoll Rate Model - Using R in Finance
Roll Rate Model - Using R in Finance
 
Intro to R for SAS and SPSS User Webinar
Intro to R for SAS and SPSS User WebinarIntro to R for SAS and SPSS User Webinar
Intro to R for SAS and SPSS User Webinar
 
Seguimiento del modelo interno de riesgo
Seguimiento del modelo interno de riesgoSeguimiento del modelo interno de riesgo
Seguimiento del modelo interno de riesgo
 
Testing of hypothesis case study
Testing of hypothesis case study Testing of hypothesis case study
Testing of hypothesis case study
 
Data Exploration, Validation and Sanitization
Data Exploration, Validation and SanitizationData Exploration, Validation and Sanitization
Data Exploration, Validation and Sanitization
 
Model building in credit card and loan approval
Model building in credit card and loan approval Model building in credit card and loan approval
Model building in credit card and loan approval
 
Decision tree
Decision treeDecision tree
Decision tree
 
Credit Risk Model Building Steps
Credit Risk Model Building StepsCredit Risk Model Building Steps
Credit Risk Model Building Steps
 

Ähnlich wie R-Excel Integration

Practical data science_public
Practical data science_publicPractical data science_public
Practical data science_publicLong Nguyen
 
Spark SQL Deep Dive @ Melbourne Spark Meetup
Spark SQL Deep Dive @ Melbourne Spark MeetupSpark SQL Deep Dive @ Melbourne Spark Meetup
Spark SQL Deep Dive @ Melbourne Spark MeetupDatabricks
 
fINAL Lesson_5_Data_Manipulation_using_R_v1.pptx
fINAL Lesson_5_Data_Manipulation_using_R_v1.pptxfINAL Lesson_5_Data_Manipulation_using_R_v1.pptx
fINAL Lesson_5_Data_Manipulation_using_R_v1.pptxdataKarthik
 
The Very ^ 2 Basics of R
The Very ^ 2 Basics of RThe Very ^ 2 Basics of R
The Very ^ 2 Basics of RWinston Chen
 
PPT ON MACHINE LEARNING by Ragini Ratre
PPT ON MACHINE LEARNING by Ragini RatrePPT ON MACHINE LEARNING by Ragini Ratre
PPT ON MACHINE LEARNING by Ragini RatreRaginiRatre
 
Beyond SQL: Speeding up Spark with DataFrames
Beyond SQL: Speeding up Spark with DataFramesBeyond SQL: Speeding up Spark with DataFrames
Beyond SQL: Speeding up Spark with DataFramesDatabricks
 
Structuring Spark: DataFrames, Datasets, and Streaming
Structuring Spark: DataFrames, Datasets, and StreamingStructuring Spark: DataFrames, Datasets, and Streaming
Structuring Spark: DataFrames, Datasets, and StreamingDatabricks
 
R tutorial for a windows environment
R tutorial for a windows environmentR tutorial for a windows environment
R tutorial for a windows environmentYogendra Chaubey
 
Interactive big data analytics
Interactive big data analyticsInteractive big data analytics
Interactive big data analyticsViet-Trung TRAN
 
U-SQL Killer Scenarios: Custom Processing, Big Cognition, Image and JSON Proc...
U-SQL Killer Scenarios: Custom Processing, Big Cognition, Image and JSON Proc...U-SQL Killer Scenarios: Custom Processing, Big Cognition, Image and JSON Proc...
U-SQL Killer Scenarios: Custom Processing, Big Cognition, Image and JSON Proc...Michael Rys
 
Pumps, Compressors and Turbine Fault Frequency Analysis
Pumps, Compressors and Turbine Fault Frequency AnalysisPumps, Compressors and Turbine Fault Frequency Analysis
Pumps, Compressors and Turbine Fault Frequency AnalysisUniversity of Illinois,Chicago
 
Data Warehouse and Business Intelligence - Recipe 2
Data Warehouse and Business Intelligence - Recipe 2Data Warehouse and Business Intelligence - Recipe 2
Data Warehouse and Business Intelligence - Recipe 2Massimo Cenci
 
Pumps, Compressors and Turbine Fault Frequency Analysis
Pumps, Compressors and Turbine Fault Frequency AnalysisPumps, Compressors and Turbine Fault Frequency Analysis
Pumps, Compressors and Turbine Fault Frequency AnalysisUniversity of Illinois,Chicago
 
Spark Sql and DataFrame
Spark Sql and DataFrameSpark Sql and DataFrame
Spark Sql and DataFramePrashant Gupta
 
Spark Summit EU 2015: Spark DataFrames: Simple and Fast Analysis of Structure...
Spark Summit EU 2015: Spark DataFrames: Simple and Fast Analysis of Structure...Spark Summit EU 2015: Spark DataFrames: Simple and Fast Analysis of Structure...
Spark Summit EU 2015: Spark DataFrames: Simple and Fast Analysis of Structure...Databricks
 

Ähnlich wie R-Excel Integration (20)

Data import-cheatsheet
Data import-cheatsheetData import-cheatsheet
Data import-cheatsheet
 
R language introduction
R language introductionR language introduction
R language introduction
 
Practical data science_public
Practical data science_publicPractical data science_public
Practical data science_public
 
Spark SQL Deep Dive @ Melbourne Spark Meetup
Spark SQL Deep Dive @ Melbourne Spark MeetupSpark SQL Deep Dive @ Melbourne Spark Meetup
Spark SQL Deep Dive @ Melbourne Spark Meetup
 
fINAL Lesson_5_Data_Manipulation_using_R_v1.pptx
fINAL Lesson_5_Data_Manipulation_using_R_v1.pptxfINAL Lesson_5_Data_Manipulation_using_R_v1.pptx
fINAL Lesson_5_Data_Manipulation_using_R_v1.pptx
 
The Very ^ 2 Basics of R
The Very ^ 2 Basics of RThe Very ^ 2 Basics of R
The Very ^ 2 Basics of R
 
PPT ON MACHINE LEARNING by Ragini Ratre
PPT ON MACHINE LEARNING by Ragini RatrePPT ON MACHINE LEARNING by Ragini Ratre
PPT ON MACHINE LEARNING by Ragini Ratre
 
Beyond SQL: Speeding up Spark with DataFrames
Beyond SQL: Speeding up Spark with DataFramesBeyond SQL: Speeding up Spark with DataFrames
Beyond SQL: Speeding up Spark with DataFrames
 
Structuring Spark: DataFrames, Datasets, and Streaming
Structuring Spark: DataFrames, Datasets, and StreamingStructuring Spark: DataFrames, Datasets, and Streaming
Structuring Spark: DataFrames, Datasets, and Streaming
 
R tutorial for a windows environment
R tutorial for a windows environmentR tutorial for a windows environment
R tutorial for a windows environment
 
Sql
SqlSql
Sql
 
R Introduction
R IntroductionR Introduction
R Introduction
 
Interactive big data analytics
Interactive big data analyticsInteractive big data analytics
Interactive big data analytics
 
R
RR
R
 
U-SQL Killer Scenarios: Custom Processing, Big Cognition, Image and JSON Proc...
U-SQL Killer Scenarios: Custom Processing, Big Cognition, Image and JSON Proc...U-SQL Killer Scenarios: Custom Processing, Big Cognition, Image and JSON Proc...
U-SQL Killer Scenarios: Custom Processing, Big Cognition, Image and JSON Proc...
 
Pumps, Compressors and Turbine Fault Frequency Analysis
Pumps, Compressors and Turbine Fault Frequency AnalysisPumps, Compressors and Turbine Fault Frequency Analysis
Pumps, Compressors and Turbine Fault Frequency Analysis
 
Data Warehouse and Business Intelligence - Recipe 2
Data Warehouse and Business Intelligence - Recipe 2Data Warehouse and Business Intelligence - Recipe 2
Data Warehouse and Business Intelligence - Recipe 2
 
Pumps, Compressors and Turbine Fault Frequency Analysis
Pumps, Compressors and Turbine Fault Frequency AnalysisPumps, Compressors and Turbine Fault Frequency Analysis
Pumps, Compressors and Turbine Fault Frequency Analysis
 
Spark Sql and DataFrame
Spark Sql and DataFrameSpark Sql and DataFrame
Spark Sql and DataFrame
 
Spark Summit EU 2015: Spark DataFrames: Simple and Fast Analysis of Structure...
Spark Summit EU 2015: Spark DataFrames: Simple and Fast Analysis of Structure...Spark Summit EU 2015: Spark DataFrames: Simple and Fast Analysis of Structure...
Spark Summit EU 2015: Spark DataFrames: Simple and Fast Analysis of Structure...
 

R-Excel Integration

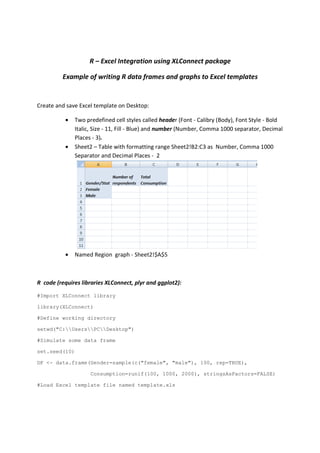
  • 1. R – Excel Integration using XLConnect package Example of writing R data frames and graphs to Excel templates Create and save Excel template on Desktop: • Two predefined cell styles called header (Font - Calibry (Body), Font Style - Bold Italic, Size - 11, Fill - Blue) and number (Number, Comma 1000 separator, Decimal Places - 3). • Sheet2 – Table with formatting range Sheet2!B2:C3 as Number, Comma 1000 Separator and Decimal Places - 2 • Named Region graph - Sheet2!$A$5 R code (requires libraries XLConnect, plyr and ggplot2): #Import XLConnect library library(XLConnect) #Define working directory setwd("C:UsersPCDesktop") #Simulate some data frame set.seed(10) DF <- data.frame(Gender=sample(c("female", "male"), 100, rep=TRUE), Consumption=runif(100, 1000, 2000), stringsAsFactors=FALSE) #Load Excel template file named template.xls
  • 2. wb <- loadWorkbook("C:UsersPCDesktoptemplate.xlsx") #Import predefined cell styles header <- getCellStyle(wb, name = "header") number <- getCellStyle(wb, name="number") #Write data frame to Sheet1 writeWorksheet(wb, DF, sheet="Sheet1", startRow=1, startCol=1) #Applied predefined cell styles setCellStyle(wb, sheet="Sheet1", row=rep(1,ncol(DF)), col=rep(c(1:2), 1), cellstyle=header) setCellStyle(wb, sheet="Sheet1", row=2:(nrow(DF)+1), col=rep(c(1:2), each=nrow(DF)), cellstyle=number) #Keep predefined cell style from Sheet2 setStyleAction(wb, XLC$"STYLE_ACTION.PREDEFINED") #Summarize data by gender using plyr package library(plyr) DF1 <- ddply(DF, .(Gender), summarise, No_Respondents=length(Gender), Total_Consumption=sum(Consumption)) #Write data frame to Sheet2 writeWorksheet(wb, sheet="Sheet2", DF1[,-1], header=FALSE, startRow=2, startCol=2) #Create graph using ggplot2 library and save it as png file png("graph1.png") library(ggplot2) ggplot(DF1, aes(Gender, No_Respondents, fill=Gender)) + geom_bar(position = "dodge")+ scale_fill_manual(values=c("darkgray", "lightblue")) dev.off() #Add graph (png to) to Excel file #Named region graph on Sheet2 addImage(wb, filename = "graph1.png", name = "graph",
  • 3. originalSize = TRUE) #Deleted png file from working directory file.remove("graph1.png") #Save changes saveWorkbook(wb) R info session: > sessionInfo() R version 2.15.0 (2012-03-30) Platform: i386-pc-mingw32/i386 (32-bit) locale: [1] LC_COLLATE=English_United States.1252 LC_CTYPE=English_United States.1252 [3] LC_MONETARY=English_United States.1252 LC_NUMERIC=C [5] LC_TIME=English_United States.1252 attached base packages: [1] stats graphics grDevices utils datasets methods base other attached packages: [1] ggplot2_0.9.1 plyr_1.7.1 XLConnect_0.1-9 XLConnectJars_0.1-4 [5] rJava_0.9-3 loaded via a namespace (and not attached): [1] colorspace_1.1-1 dichromat_1.2-4 digest_0.5.2 grid_2.15.0 [5] labeling_0.1 MASS_7.3-17 memoise_0.1 munsell_0.3 [9] proto_0.3-9.2 RColorBrewer_1.0-5 reshape2_1.2.1 scales_0.2.1 [13] stringr_0.6