Weatherford International plc technical analysis charts
•
0 gefällt mir•79 views

http://www.chartician.com/ Weatherford International plc technical analysis charts

Empfohlen
Weitere ähnliche Inhalte
Andere mochten auch
Andere mochten auch (15)
Kürzlich hochgeladen
Kürzlich hochgeladen (20)
Weatherford International plc technical analysis charts
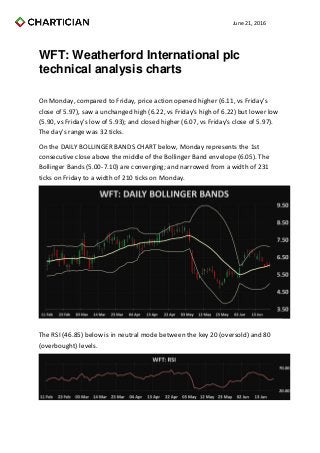
- 1. June 21, 2016 WFT: Weatherford International plc technical analysis charts On Monday, compared to Friday, price action opened higher (6.11, vs Friday's close of 5.97), saw a unchanged high (6.22, vs Friday's high of 6.22) but lower low (5.90, vs Friday's low of 5.93); and closed higher (6.07, vs Friday's close of 5.97). The day's range was 32 ticks. On the DAILY BOLLINGER BANDS CHART below, Monday represents the 1st consecutive close above the middle of the Bollinger Band envelope (6.05). The Bollinger Bands (5.00-7.10) are converging; and narrowed from a width of 231 ticks on Friday to a width of 210 ticks on Monday. The RSI (46.85) below is in neutral mode between the key 20 (oversold) and 80 (overbought) levels.
- 2. June 21, 2016 The MACD 12 day moving average is below the MACD 26 day moving average; both are above zero and rising. The Slow Stochastics, below, are in negative mode, with the K line below the D line. The Commodity Channel Index (1.95), below, is in negative mode below the overbought 200 level. On the 20-DAY MOVING AVERAGE ENVELOPE CHART below, price action rose towards the top of the 20 day moving average envelope (6.05). The parameters of the envelope (5.87-6.23) are pointing higher.
- 3. June 21, 2016 On the 5 AND 20 DAY MOVING AVERAGES CHART below, the 5 day moving average (6.15, moving down) is above the 20 day moving average (6.05, moving up), in positive mode. The 3-50 day strip of moving averages ranges from the 30 day moving average (5.86) at the bottom of the range to the 50 day moving average (6.56) at the top of the range. The Parabolic Stop and Reverse (6.79) below is in the 5th day of sell mode.
- 4. June 21, 2016 On the WEEKLY BOLLINGER BANDS CHART below, last week represents the 5th consecutive close below the middle of the Bollinger Bands envelope (6.66). The Bollinger Bands (4.87-8.45) are pointing lower; expanding from a width of 354 ticks on Friday to a width of 358 ticks on Monday.