Skyworks Solutions technical analysis charts
•
0 gefällt mir•113 views

http://www.chartician.com/ Skyworks Solutions technical analysis charts

Empfohlen
Weitere ähnliche Inhalte
Andere mochten auch
Andere mochten auch (15)
Kürzlich hochgeladen
Kürzlich hochgeladen (20)
Skyworks Solutions technical analysis charts
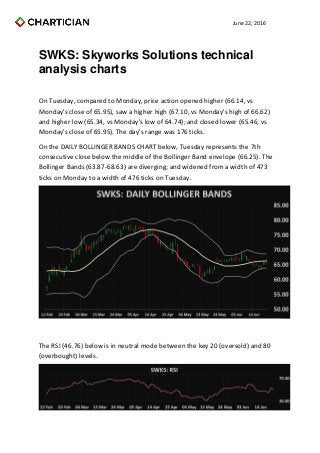
- 1. June 22, 2016 SWKS: Skyworks Solutions technical analysis charts On Tuesday, compared to Monday, price action opened higher (66.14, vs Monday's close of 65.95), saw a higher high (67.10, vs Monday's high of 66.62) and higher low (65.34, vs Monday's low of 64.74); and closed lower (65.46, vs Monday's close of 65.95). The day's range was 176 ticks. On the DAILY BOLLINGER BANDS CHART below, Tuesday represents the 7th consecutive close below the middle of the Bollinger Band envelope (66.25). The Bollinger Bands (63.87-68.63) are diverging; and widened from a width of 473 ticks on Monday to a width of 476 ticks on Tuesday. The RSI (46.76) below is in neutral mode between the key 20 (oversold) and 80 (overbought) levels.
- 2. June 22, 2016 The MACD 12 day moving average is below the MACD 26 day moving average; both are above zero. The Slow Stochastics, below, generated a positive signal, as the K line crossed above the D line. The Commodity Channel Index (-20.01), below, is in positive mode above the oversold -200 level. On the 20-DAY MOVING AVERAGE ENVELOPE CHART below, price action fell away from the bottom of the 20 day moving average envelope (66.25). The parameters of the envelope (64.26-68.23) are pointing lower.
- 3. June 22, 2016 On the 5 AND 20 DAY MOVING AVERAGES CHART below, the 5 day moving average (65.03, moving up) is below the 20 day moving average (66.25, moving down); in negative mode. The 3-50 day strip of moving averages ranges from the 5 day moving average (65.03) at the bottom of the range to the 50 day moving average (67.43) at the top of the range. The Parabolic Stop and Reverse (63.31) below is in the 1st day of sell mode.
- 4. June 22, 2016 On the WEEKLY BOLLINGER BANDS CHART below, last week represents the 9th consecutive close below the middle of the Bollinger Bands envelope (68.60). The Bollinger Bands (56.83-80.37) are converging; contracting from a width of 2,406 ticks on Monday to a width of 2,354 ticks on Tuesday.