Hdfc sec - GS junior BeES - a perspective - dec 28, 2012
•
2 gefällt mir•743 views


Empfohlen
Weitere ähnliche Inhalte
Was ist angesagt?
Was ist angesagt? (18)
Andere mochten auch
Ähnlich wie Hdfc sec - GS junior BeES - a perspective - dec 28, 2012
Ähnlich wie Hdfc sec - GS junior BeES - a perspective - dec 28, 2012 (20)
Mehr von Dhuraivel Gunasekaran
Mehr von Dhuraivel Gunasekaran (20)
Hdfc sec - GS junior BeES - a perspective - dec 28, 2012
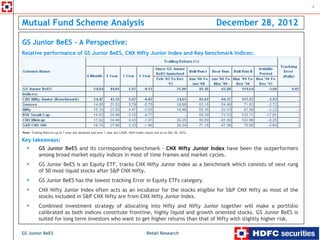
- 1. 1 Mutual Fund Scheme Analysis December 28, 2012 GS Junior BeES - A Perspective: Relative performance of GS Junior BeES, CNX Nifty Junior Index and Key benchmark Indices: Note: Trailing Returns up to 1 year are absolute and over 1 year are CAGR. NAV/index values are as on Dec 26, 2012. Key takeaways: GS Junior BeES and its corresponding benchmark - CNX Nifty Junior Index have been the outperformers among broad market equity indices in most of time frames and market cycles. GS Junior BeES is an Equity ETF, tracks CNX Nifty Junior Index as a benchmark which consists of next rung of 50 most liquid stocks after S&P CNX Nifty. GS Junior BeES has the lowest tracking Error in Equity ETFs category. CNX Nifty Junior Index often acts as an incubator for the stocks eligible for S&P CNX Nifty as most of the stocks included in S&P CNX Nifty are from CNX Nifty Junior Index. Combined investment strategy of allocating into Nifty and Nifty Junior together will make a portfolio calibrated as both indices constitute frontline, highly liquid and growth oriented stocks. GS Junior BeES is suited for long term investors who want to get higher returns than that of Nifty with slightly higher risk. GS Junior BeES Retail Research
- 2. 2 Mutual Fund Scheme Analysis contd… Rationale behind investing in an Index: Investing in an index is considered as efficient investment option as the index includes large actively traded stocks from diversified and performing industries. Index investors take exposure to segments of markets and also entire markets via indexes. Indices are revamped periodically representing the changes in the importance of sectors and growth cycle of stocks. The world changes, so the index should change. Investors benefit out of these changes as they need not take a call on entering or exiting a particular sector or stock. No attempt at forecasts, analysis and timing markets. The objective is to earn the market rate of return. Asset allocation can be logically practiced with indexes as relative to buying individual stocks. Actions of large numbers of active investors set stock prices & index investors benefit from this at a low cost. Rationale behind investing in GS Junior BeES: GS Junior BeES gives a chance to, Participate in the next rung of 50 most liquid, emerging stocks after S&P CNX Nifty large cap stocks which will ride on growth in Indian economy, Incur low cost in terms of expenses of scheme (compared to a diversified fund) or lower transaction costs (in the case of direct equity requiring frequent reshuffling), Go in for SIP and take advantage of volatility in the markets to arrive at a lower entry level, Avoid possibility of underperforming the benchmark, Avoid the need of constantly monitoring and reviewing portfolio. GS Junior BeES Retail Research
- 3. 3 Mutual Fund Scheme Analysis contd… What are ETFs? Exchange-Traded Funds (ETFs) are passively managed funds investing in the securities comprising an index in a proportion which the securities are present in that index. They are listed and traded on stock exchanges, thus they can be bought and sold on the real time basis like equity shares. They are preferred investment options among investors for their uniqueness of getting access to broader market indices, diversified investment approach, low cost structure and transparency. What are passively managed Mutual Funds? Passively managed funds are mutual fund schemes that are designed to match the returns on a particular stock market index. They do simply follow the index, construct the portfolio in proportion to the index constituents and generate the return in line with the index. Index funds and ETFs are the two types of passively managed funds. The other type of mutual funds are called as actively managed mutual funds which are managed actively by the fund managers. Unlike passively managed funds, actively managed funds are mandated to outperform the respective benchmarks by using the skills set of the fund managers. Index funds and ETFs vary from each other mainly in terms of tradability on the exchanges. ETFs are listed on the stock exchanges and traded in the real time basis like equity shares while the Index funds are not listed on any exchanges whose NAVs are calculated and declared once in a day like other normal mutual funds. In domestic front, Indian mutual fund companies offer variety of ETFs that belonging to different asset classes, sectors and regions. Suitability: ETFs are suited for conservative investors who want to follow and are willing to get returns in line with index returns. First time investors who wish to enter into equity market, can consider opting the index ETF route. Investing through staggered investment mode like DIY SIP will further help them to accumulate cost averaging units over periods. However, Investors have to own a demat account and a broker’s account to participate in the investment process of ETF transaction. GS Junior BeES Retail Research
- 4. 4 Mutual Fund Scheme Analysis contd… Goldman Sachs Nifty Junior Exchange Traded Scheme (GS Junior BeES) Prologue: GS Junior BeES is an Equity Exchange Traded Fund tracking CNX Nifty Junior Index as a benchmark which consists of next rung of 50 most liquid stocks after S&P CNX Nifty. The stocks in the CNX Nifty Junior Index are next 50 large, liquid stocks in India which are smaller and riskier than Nifty constituents and having potential to generate higher returns compared to Nifty over long run. Investment objective: The investment objective of GS Junior BeES is to provide returns that, before expenses, closely correspond to the returns of securities as represented by CNX Nifty Junior Index. However, the performance of scheme may differ from that of underlying index due to tracking error. Investment pattern: Basic facts: Tracks the CNX Nifty Junior Index and priced at 1/100th of the CNX Nifty Junior Index. Combination of a share and a mutual fund unit. Listed and traded on the capital market segment of NSE. Minimum lot-size for real-time in-kind creation / redemption with the fund is 16,000 units and in multiples thereof. Minimum lot-size to buy/sell on NSE is 1 unit and in multiples thereof. Options: the scheme offers only growth option. Units of the scheme will be issued/repurchased and traded compulsorily in demat form. GS Junior BeES Retail Research
- 5. 5 Mutual Fund Scheme Analysis contd… . CNX Nifty Junior Index (benchmark of GS Junior BeES): CNX Nifty Junior was introduced on January 1, 1997, with base date and base value being November 03, 1996 and 1000 respectively and a base capital of 0.43 trillion. The next rung of liquid securities after S&P CNX Nifty is the CNX Nifty Junior. S&P CNX Nifty and the CNX Nifty Junior make up the 100 most liquid stocks in India. Only companies having a high degree of liquidity defined in terms Impact Cost are included as Constituents of the Index. The CNX Nifty Junior Index represents about 11.33% of the free float market capitalization of the stocks listed on NSE as on September 28, 2012. The total traded value for the last six months ending September 2012 of all index constituents is approximately 14.81 % of the traded value of all stocks on NSE. Impact cost for CNX Nifty Junior is 0.36%. CNX Nifty Junior is computed using market capitalisation weighted method, wherein the level of the index reflects the total market value of all the stocks in the index relative to a particular base period. The method also takes into account constituent changes in the index and importantly corporate actions such as stock splits, rights, new issue of shares etc without affecting the index value. Rationale behind the Strategy of pooling the S&P CNX Nifty and the CNX Nifty Junior together: CNX Nifty Junior is an index built out of the next 50 large, liquid stocks in India. It is not as liquid as the S&P CNX Nifty, which implies that the information in the S&P CNX Nifty Junior is not as noise-free as that of the S&P CNX Nifty. It may be useful to think of the S&P CNX Nifty and the CNX Nifty Junior as making up the 100 most liquid stocks in India. S&P CNX Nifty is the front line blue-chips, large and highly liquid stocks. The CNX Nifty Junior is the second rung of growth stocks, which are not as established as those in the S&P CNX Nifty. GS Junior BeES Retail Research
- 6. 6 Mutual Fund Scheme Analysis contd… . CNX Nifty Junior can be viewed as an incubator where young growth stocks are found. Most of the stocks included in S&P CNX Nifty are from CNX Nifty Junior but this is not true other way around, means excluded stocks from the S&P CNX Nifty very rarely go into CNX Nifty Junior at the time of change. Almost 80% of the stocks entering the Nifty over a ten year period come from the 50 stocks just below the Nifty at the beginning of the decade. As with the S&P CNX Nifty, stocks in the CNX Nifty Junior are filtered for liquidity, so they are the most liquid of the stocks excluded from the S&P CNX Nifty. Buying and selling the entire CNX Nifty Junior as a portfolio is feasible. The maintenance of the S&P CNX Nifty and the CNX Nifty Junior are synchronised so that the two indices will always be disjoint sets; i.e. a stock will never appear in both indices at the same time. Hence it is always meaningful to pool the S&P CNX Nifty and the CNX Nifty Junior into a composite 100 stock index or portfolio. The below chart shows the above average performance of the ‘Nifty+Nifty Junior’ over years compared to just the Nifty or the Sensex. Comparative performance of Nifty + Nifty Junior over periods : 150.00 Sensex Nifty CNX Midcap CNX Nifty Junior S&P CNX 500 Nifty + CNX Nifty Junior 100.00 50.00 0.00 -50.00 -100.00 2004 2005 2006 2007 2008 2009 2010 2011 GS Junior BeES Retail Research
- 7. 7 Mutual Fund Scheme Analysis contd… . Historical performance of CNX Nifty Junior Index: The performance of CNX Nifty Junior has been notable since its launch. The Index has been the outperformer among broad market equity indices in most of time frames and market cycles. The index has outperformed other broad indices such as Sensex, Nifty, BSE Small-Cap, CNX Midcap and S&P CNX 500 given in the short term as well as long term time frames for the last one, three and five year periods. Outperformance by the index during short term of last one year period is impressive where the benchmark managed to outperform with considerable margin. Meanwhile, the performance of the index during various market cycles was also notable which outperformed most of the broad indices for most of the cycles. While comparing the performance of CNX Nifty Junior index with Nifty index, the former scores higher during all set of market cycles (see the charts below). Outperformance by CNX Nifty Junior and its ETF Vs. other broad indices in various time frames: 1200 GS Junior BeES 1000 Sensex Nifty BSE 100 800 CNX Midcap CNX Nifty Junior S&P CNX 500 600 400 200 0 Feb-03 Feb-04 Feb-05 Feb-06 Feb-07 Feb-08 Feb-09 Feb-10 Feb-11 Feb-12 Aug-03 Aug-04 Aug-05 Aug-06 Aug-07 Aug-08 Aug-09 Aug-10 Aug-11 Aug-12 GS Junior BeES Retail Research
- 8. 8 Mutual Fund Scheme Analysis contd… . Relative performance broad indices during various market cycles: 200 CNX Nifty Junior Sensex Nifty BSE Sm all-Cap CNX Midcap S&P CNX 500 150 126 118 103 86 89 81 100 71 72 76 63 65 68 50 0 -4 -3 -2 -6 -4 -18 -50 -54 -53 -58 -66 -62 -100 -73 June '06 to Jan '08 Jan '08 to Mar '09 Mar '09 to Nov '10 Nov '10 to till date (Bull Run I) (Bear Run ) (Bull Run II) (Volatile Period) Outperformance by CNX Nifty Junior Vs. other broad indices in various time frames: CNX Nifty Junior Sensex Nifty BSE Sm all-Cap CNX Midcap S&P CNX 500 50 43 40 35 30 28 30 24 24 22 18 17 20 15 15 15 10 6 4 4 4 3 0 -1 0 -1 -1 -2 -3 -10 -10 -20 6 Month 1 Year 3 Year 5 Year GS Junior BeES Retail Research
- 9. 9 Mutual Fund Scheme Analysis contd… . The below charts portray the outperformance of the CNX Nifty Junior index over Nifty during various cycles. Growth of investments in indices over a decade: Performance in last one year period: 600 Nifty CNX Nifty Junior 160 Nifty CNX Nifty Junior 500 150 400 140 300 130 200 120 100 110 0 100 Dec-11 Jan-12 Feb-12 Mar-12 May-12 Jun-12 Jul-12 Oct-12 Nov-12 Dec-12 Sep-12 Aug-00 Aug-02 Aug-04 Aug-06 Aug-08 Aug-10 Aug-12 Apr-12 Aug-12 Growth of investments done during market peak: Growth of investments done during market bottom: 120 Nifty CNX Nifty Junior 400 Nifty CNX Nifty Junior 350 100 300 80 250 60 200 150 40 100 20 50 0 0 Jan-08 May-08 Jan-09 May-09 Jan-10 May-10 Jan-11 May-11 Jan-12 May-12 Mar-09 Jul-09 Nov-09 Mar-10 Jul-10 Nov-10 Mar-11 Jul-11 Nov-11 Mar-12 Jul-12 Nov-12 Sep-08 Sep-09 Sep-10 Sep-11 Sep-12 GS Junior BeES Retail Research
- 10. 10 Mutual Fund Scheme Analysis contd… . Constituents of CNX Nifty Junior index: Data as of Dec 27, 2012. Sector Break-up: M edia & Entert Transpo rt So ftware Industrial P ro ducts Teleco mmunicatio n Serv P o wer & Others Healthcare Services Ferro us M etal Services Chemicals & Others Co nsumer Durables Trading Gas & Others P etro leum P ro ducts A uto A ncillary Industrial Capital Go o ds P esticides A uto mo biles Ho tel Co nstructio n P ro jects Cash & Others P harma B anks Finance Data as of Nov 2012. Co nsumer No n Durables GS Junior BeES Retail Research
- 11. 11 Mutual Fund Scheme Analysis contd… . Features of GS Junior BeES: First Large + Mid cap oriented Exchange Traded Fund (ETF) in India. Combination of a share and a mutual fund unit. Real-time Trading on NSE. Real-time Indicative NAV. Available across NSE terminals. Tracks the CNX Nifty Junior Index. Priced at 1/100th of the CNX Nifty Junior Index. The maximum total expense ratio is 1.02% per annum. Structured as a Mutual Fund under the SEBI 1996 regulations. Advantages of GS Junior BeES: Simple – Can be bought/ sold on NSE like a share…real-time. Economical – No load scheme. Annual expense is one of the lowest for any mutual fund scheme in India. Diversification – It’s a cost efficient way to invest in a basket of securities. Equitable Structure – Long term investors insulated from short term trading activity. Transparent – Investors have access to information on the portfolio constituents represented on a daily basis. Having lowest tracking error among the equity ETFs means that the GS Junior BeES tracks its benchmark very closely compared to that of other ETFs. GS Junior BeES Retail Research
- 12. 12 Mutual Fund Scheme Analysis contd… . GS Junior BeES – Scheme Details: NSE Symbol :JUNIORBEES. BSE Code :590104. ISIN :INF732E01045. Reuters :JBES.NS. Bloomberg :JBEES:IN. Fund Manager :Payal Kaipunjal. Allotment date :February 21, 2003. Minimum investment :16,000 units (Directly with fund) 1 unit on exchanges. Closing Price :121.71 (Rs as on Dec 27, 2012) NAV :122.78(Rs as on Dec 27, 2012) Average AUM :87.66 Crs (as on Nov ’12). Expense Ratio :1.02% (as on Nov ’12) Tracking Error :0.02%* Issued Cap :79,87,190(shares) as on 28-Dec-2012. Market Cap :97.80(Cr) as on 28-Dec-2012. Dividend yield :1.35% Impact cost :0.36 (as on Dec ’12) Entry / Exit Load :Nil. Note: *- Tracking Error is calculated based on daily Rolling Returns for last 12 months (Source: NAVIndia). GS Junior BeES Retail Research
- 13. 13 Mutual Fund Scheme Analysis contd… . Discount (+) / Premium (-) of Spot Price to NAV of GS Junior BeES over the last eight months: 4.00% 3.00% 2.00% 1.00% 0.00% -1.00% -2.00% -3.00% May-12 May-12 May-12 Jun-12 Jun-12 Jul-12 Jul-12 Oct-12 Oct-12 Oct-12 Nov-12 Nov-12 Dec-12 Sep-12 Sep-12 Aug-12 Aug-12 Daily traded volume in GS Junior BeES on NSE (Rs in Lac): 2500 GS Junior ETF 2000 1500 1000 500 0 Jul-09 Nov-09 Jan-10 Mar-10 May-10 Jul-10 Nov-10 Jan-11 Mar-11 May-11 Jul-11 Nov-11 Jan-12 Mar-12 May-12 Jul-12 Nov-12 Sep-09 Sep-10 Sep-11 Sep-12 The daily average volume in GS Junior BeES on NSE in last three months was at 24,209 units or Rs. 27.61 lacs. Further the ETF was mostly quoted at discount of 1% to 2% in the given period. Hence GS Junior BeES is suited for investors who wish to accumulate over time and hold for a reasonably long period of time. GS Junior BeES Retail Research
- 14. 14 Mutual Fund Scheme Analysis contd… . Advantages of ETFs: Lower expense ratio: ETFs are less expensive in comparison to actively and other passively managed schemes. The expense ratio of ETFs is the lowest among mutual fund schemes which ranging from 0.25% to 1%. Index Funds charge between 0.75% to 1.5% while actively managed funds charge up to 2.5% of the net assets. The low expense ratio of ETFs is mainly attributable to passive investment nature hence there is no need of requiring the service of fund managers and analysts. Moreover, there is less marketing cost and commissions. The average expense ratios for ETF category as on Sep 2012 was at 0.87% (including gold ETFs). Diversification: The investment through ETFs are widely diversified as indices are constructed to represent performance of the stock market as a whole. It reduces the overall risk of one’s portfolio. Apart from major indices such as Sensex and Nifty, fund houses have bestowed investors an opportunity to diversify their portfolios through market capitalization (ICICI Nifty Junior, IDBI Nifty Junior and Junior BeES providing investment opportunities in mid cap space), focusing on industry (Bank BeES & Infra BeES), asset class (liquid and Gold) and explore in global arena (Hang Seng BeES). Transparency: Investors can access the portfolio composition of index any day at any point of time. On the other hand, portfolios of other mutual funds schemes are declared by AMCs once in a month. No fund manager Risk: As the objective of such schemes is to mimic the performance of index which they track, they construct the portfolios same as the tracking indexes. So these funds stay away from the risk of subjective performances and biases of fund managers. Liquidity: ETFs are listed and traded on stock exchanges like equity shares. They can be bought and sold on real time basis at currently available prices at any time during trading hours. However, AMCs arrange to absorb any excess supply of units that an investor would like to sell or create fresh units when the demand for units is large enough. On the other hand, other funds including index funds that are available only at day-end NAV. Simplicity: There is no separate form filling and can be traded by just a phone call. Investors have the ability to put limit orders. Others: There is an arbitrage opportunity available between Futures and Cash Market. Above all, passive funds provide better downside protection than actively managed schemes during downturns. GS Junior BeES Retail Research
- 15. 15 Mutual Fund Scheme Analysis contd… . Disadvantages of ETFs: On the downside, there are some drawbacks associated with ETFs. Demat account: Demat account and broker’s accounts are mandatory for an investor to participate in the ETF trading as they are traded in stock exchanges. No demat and broker accounts are necessary in case of index and other mutual funds transactions. Brokerage Charges: Brokerage and other transaction charges need to be paid when trading in ETFs. It can be minimized by trading less but the very charm of ETFs is affected because it is meant for being traded more often than an index fund. Premiums and Discounts: An ETF might trade at a discount to the underlying shares. This means that although the index might be doing very well on the bourses, yet the ETF might be traded at less than the market value of the index. SIP in ETF is not convenient as you have to place a fresh order every month and also SIP may prove expensive as compared to a no-load, low-expense index funds as you have to pay brokerage every time you buy & sell. True Replication: The index and ETFs may not replicate the returns of underlying index due to management expenses, cash holding and so on which result in higher tracking error. Inbuilt Cost: Impact cost is higher than its constituents. Transaction costs like brokerage charges need to be paid anyway when trading in ETFs. Comparison of ETFs, Stocks and Mutual Funds: *= Including Index funds and non Index funds GS Junior BeES Retail Research
- 16. 16 Mutual Fund Scheme Analysis contd… . How do ETFs Function? ETFs vary from normal mutual funds in terms of the functionality, the manner in which they are created, bought and sold. In normal mutual funds, investors pay cash to the fund house, which in turn buys the securities and constitutes the fund. In case of ETFs, the fund house appoints market makers in the stock market to execute all the transactions on behalf of the fund house. The market-makers, also called as arbitrageurs or Authorized Participants (APs) involve into the following four distinct transactions; 1. The Authorized Participants purchase a basket of shares, as specified by the fund house, for cash. 2. This basket of securities is then exchanged with the fund house for a set number of ETF units (creation). 3. The Authorized Participants then satisfy market demand by doing buy/sell orders (and sell/redeem these units to investors just like a distributor does). 4. The Authorized Participants are performing an arbitrage between the ETF and index to keep the market price of the ETF close to its NAV. The Authorized Participants are empowered to create or redeem ETF units. They buy the basket of securities (such as all the scrips of the market index as specified by fund house) and hand it over to the fund house, in exchange of a certain number of units (which are usually 50,000 or a multiple thereof). This process is called unit creation, whereby ETF units are “created” in exchange of a basket of securities. The Authorized Participants then break up these units and sells them separately on the stock exchange. Investors can then buy and sell these units through the stock exchange. The Authorized Participants also redeem the ETF units by delivering them to the fund house in return for the securities represented by those units. Note that the exchange of ETF shares and the securities they represent between the Authorized Participants and the fund house is an in-kind exchange—there is no exchange of cash. This also lowers taxes for the ETF sponsor, thereby lowering the fund’s fees. GS Junior BeES Retail Research
- 17. 17 Mutual Fund Scheme Analysis contd… . How ETFs work? Primary market Secondary market Seller Cash ETF Units Authorized Buy / sell Participants / Stock Exchange Market making / FI Arbitrage Creation Redemption Cash in-kind in-kind ETF Units Fund Buyer GS Junior BeES Retail Research
- 18. 18 Mutual Fund Scheme Analysis No Tracking Error: Investors in an ETF buy or sell a security representing shares in the underlying index fund. They do expect the price of the ETF to closely track the value of the underlying Index. They also want a sense of how closely the ETF returns correlate with those of the index. Tracking error helps out the investors to measure as to how closely the ETF tracks the underling index. Tracking error is a statistical term commonly used to describe the volatility of returns of a ETF relative to the returns of its benchmark index. It is typically expressed in terms of the standard deviation of the differences between ETF and index returns over a specific horizon. It can be interpreted as the range around the index return in which ETF returns are expected to be. For example, a tracking error of 1% implies that if the index return is 10%, the ETF return should be 9%-11% about 68% of the time. Tracking Error tells how much an ETF's returns deviate from the benchmark index's returns over any given period of time. An ETF fund manager needs to calculate his tracking error on a daily basis especially if it is open-ended fund. Lower the tracking error, closer are the returns of the fund to that of the target Index. For investors’ point of view, the lower the tracking error, the better is the ETF. Analyst: Dhuraivel Gunasekaran. (Database sources: AMC Sites, NAVIndia & Ace MF) HDFC Securities Limited, I Think Techno Campus, Bulding –B, ”Alpha”, Office Floor 8, Near Kanjurmarg Station, Opp. Crompton Greaves, Kanjurmarg (East), Mumbai 400 042 Phone (022) 30753400 Fax: (022) 30753435 Disclaimer: Mutual Fund investments are subject to risk. Past performance is no guarantee for future performance. This document has been prepared by HDFC Securities Limited and is meant for sole use by the recipient and not for circulation. This document is not to be reported or copied or made available to others. It should not be considered to be taken as an offer to sell or a solicitation to buy any security. The information contained herein is from sources believed reliable. We do not represent that it is accurate or complete and it should not be relied upon as such. We may have from time to time positions or options on, and buy and sell securities referred to herein. We may from time to time solicit from, or perform investment banking, or other services for, any company mentioned in this document. This report is intended for non- Institutional Clients. GS Junior BeES Retail Research