Beginners Guide to TikTok for Search - Rachel Pearson - We are Tilt __ Bright...
Housing Market Outlook GTAF all 2010
1. H o u s i n g M a r k e t I n f o r m a t i o n
HOUSING MARKET OUTLOOK
SUBSCRIBE NOW!
Access CMHC’s Market Analysis
Centre publications quickly and
conveniently on the Order Desk at
www.cmhc.ca/housingmarketinformation.
View, print, download or subscribe to
get market information e-mailed to
you on the day it is released. CMHC’s
electronic suite of national standardized
products is available for free.
Date Released:
Housing market intelligence you can count on
C a n a d a M o r t g a g e a n d H o u s i n g C o r p o r a t i o n
Table of Contents
Greater Toronto Area
Fall 2010
Market at a Glance
MLS®
sales and selling prices in the GTA will stabilize and gradually increase
over the course of next year. In comparison to 2010, the totals for 2011 will
be slightly lower due to very strong activity in the first part of this year. MLS
sales will reach 81,500, while the average selling price for the year will be
approximately $428,000.
New homes sales will total 26,500 units in 2011, with high rise projects
accounting for the majority share of transactions (55 per cent).Total housing
starts will remain at virtually the same level as 2010 (approximately 30,000) as
strong apartment starts offset a decline in single detached construction.
The unemployment rate inToronto will edge lower but remain elevated next
year.As a result, incomes will continue to grow below the rate of inflation.
1 Market at a Glance
2 Resale Market
3 New Home Market
4 Local Economy
5 Forecast Summary
1
The forecasts included in this document are based on information available as of October 8, 2010.
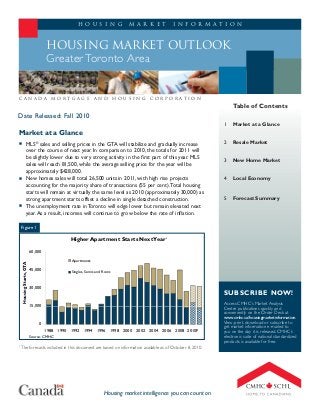
Figure 1
15 000
30,000
45,000
60,000
HousingStarts,GTA
Higher Apartment Starts NextYear
Apartments
Singles, Semis and Rows
1
0
15,000
1988 1990 1992 1994 1996 1998 2000 2002 2004 2006 2008 2010F
Source: CMHC
2. 2Canada Mortgage and Housing Corporation
Housing Market Outlook - GreaterToronto Area - Date Released: Fall 2010
Resale Market
Less excitement in store for
2011
The Greater Toronto Area’s resale
market is expected to normalize in
2011.After an unprecedented level of
volatility experienced over the past
couple of years, sales will settle into
a range reminiscent of the 2003-2006
period — decent volumes without
dramatic movements. One change
on the horizon is an absence of the
seller’s market conditions the GTA
has been accustomed to for much
of the past decade. Buyers can sigh
in relief as prices will see very little
movement from today’s levels.While
developments in the housing market
will likely attract fewer headlines in the
coming year, take that as a sign that
we have transitioned towards a more
sustainable level of activity reflective of
the current economic environment.
In fact, the market already appears
to be settling into its comfort zone.
Sales are currently in the low end of
the 75,000 to 85,000 annualized range
expected for the rest of this year
and throughout 2011, which largely
reflects a rebalancing from record
levels set in the early part of 2010.
Homeownership demand is expected
to gain momentum in the second half
of next year as the GTA economy
is now starting to bring full-time
employment beyond the pre-recession
peak (see Local Economy section).
Continued low interest rates will keep
households interested in buying, but
won’t lead sales to new highs. Prices
in the resale market are no longer at
stimulative levels after growing faster
than incomes over the past couple
years.This will impact sales coming
from first-time buyers, who typically
have below-average incomes and
savings.
While overall sales levels and
price growth will be lower than
in the preceding couple of years,
opportunities for growth will continue
to present themselves in 2011. Next
year, the share of the population in
their prime income earning years
(45-54) will peak — meaning the
reduction in first-time buyers should
be at least partially offset by greater
sales from move-up buyers.As a result,
above-average priced areas of the GTA
should continue to attract interest in
2011.The empty-nester and retiree
population is also expanding quickly,
as is the trend towards downsizing.
Results from CMHC’s Renovation
and Home Purchase Report indicate
that 40 per cent of home purchasers
aged 65 plus bought a condo.A large
number of newly completed units
hitting the market will present buyers
with ample choice and more flexible
prices. Research conducted by CMHC
reveals that one-third of the 20,000
Figure 2
,280
58,283
58,841
55,360
58,957
58,349
67,612
74,759
79,366
84,854
85,672
84,842
95,164
76,387
89,255
86,000
81,500
50,000
75,000
100,000
MLS®Sales,GTA
MLS® SalesWill Remain Stable1
48,
25,000
1995 1997 1999 2001 2003 2005 2007 2009 2011F
Source: CREA, CMHC Forecast
Figure 3
$250
$300
$350
$400
$450
gMLS®SellingPrice,GTA
asonallyAdjusted,$000s)
MLS® Average PricesWill Flatten1
$200
$250
2000 2001 2002 2003 2004 2005 2006 2007 2008 2009 2010F 2011F
Avg
(Sea
Source: CREA, CMHC Forecast
3. 3Canada Mortgage and Housing Corporation
Housing Market Outlook - GreaterToronto Area - Date Released: Fall 2010
units registered in 2009 and the
first half of 2010 were listed for sale
during the period. Prices for these
recently finished suites are comparable
to prices at pre-construction sales
centres, allowing buyers with more
options to buy “new” without the long
construction wait.While first-time
buyers will likely look more towards
the condo market next year, they also
tend to broaden their geographic
scope when ownership becomes less
affordable. Sales in areas close to the
city yet offering prices 10-20% below
the GTA average, such as Pickering,
Ajax,Whitby, northern Mississauga and
Brampton, are expected to perform
relatively better next year.
New Home Market
More challenges await next
year
A relatively weaker outlook for new
homes sales is expected in 2011.
The new home market typically
experiences more pronounced
declines than the resale market when
conditions soften. Resale volumes
can derive some stability from the
turnover of a large and growing stock,
whereas the new home market has to
rely on its more limited offerings to
attract buyers.A decade low number
of transactions for low rise homes
will be recorded (12,000), while high
rise sales will range between levels
reached in the 2002-2004 period,
totalling 14,500 in 2011. One area of
growth in the new home market next
year will be the construction of high
rise units, which will see starts rise by
nearly 30 per cent thanks to strong
condo sales in late 2009-early 2010.
The elevated level of high rise starts
next year will be matched by an
equivalent number of completions. In
a way, the high level of completions
will help builders by freeing up
resources to begin construction on
new projects. In another sense, more
finished units will mean more resale
listings, which will compete with
builders’ unsold inventory of units.
New condo sales are expected to
give up share to the resale market,
as buyers take advantage of the
increased selection and improved
negotiation power for existing units.
While developers of new condos have
less flexibility in adjusting prices due
to construction costs and agreements
with lenders, this doesn’t presume
that prices will continue to grow at
5-10 per cent annual rates. In fact,
the growing gap between prices for
new unsold product and selling prices
in the resale market should require
an adjustment in inventory. Builders
will need to focus on keeping first-
time buyers and long-term investors
interested by launching smaller-
sized and more affordable units, as
well as opening more sales sites in
less expensive areas outside of the
downtown core.Tempering growth
in new condo prices will ensure the
market remains competitive with
resale listings. Furthermore, limiting
the number of new launches to reflect
a slower sales environment will
prevent an over supply situation and
prolonged project absorption periods.
Developers of low rise homes will
face the same challenge as their high
rise counterparts in attempting to
effectively compete with the resale
market and keep a lid on price growth.
However, the main obstacle faced in
the low rise market is on the supply
side — the number of units currently
available to build is half the level in the
high rise market. Reduced supply that
is largely located in the higher priced
York Region will lead to further gains
in new home prices next year, even
with lower sales levels.Two-thirds
of the low rise units for sale in the
GTA are single detached homes with
average prices approaching $600,000.
However, by shifting focus to more
affordable areas with greater land
supply as well as smaller and less
expensive homes, price pressures
should be contained to around the
rate of inflation. Single detached starts
will decline markedly next year, but
Figure 4
29,935
30,824
38,397
30,775
27,177
24,215
21,518
21,235
2,264
18,313
14,500
2,000
207
,757
15,263
,549
13,235
17,392
17,043
22,422
14,583
15,637
16,500
14,500
10,000
20,000
30,000
40,000
GTANewHomeSales
New Home SalesWill Favour High Rise
Low-Rise High-Rise
1
12
12
10,2
10,
11
1
0
2000 2001 2002 2003 2004 2005 2006 2007 2008 2009 2010F 2011F
G
Source: RealNet Canada Inc. (www.realnet.ca); CMHC Forecast
4. 4Canada Mortgage and Housing Corporation
Housing Market Outlook - GreaterToronto Area - Date Released: Fall 2010
expect activity to move more into the
Durham Region — currently offering
about one-third of the GTA’s inventory
of singles ready to build. Builders will
also turn their attention more towards
the construction of row homes, which
will represent one-third of low rise
housing starts in 2011.
Local Economy
Slow road ahead
The relatively quick turnaround for
employment will be a stabilizing factor
for housing sales and construction
in 2011. However, digging beneath
the headline job recovery reveals a
Toronto labour market not yet ready
to bring housing activity back near
peak levels. Since developments in the
labour market typically impact the
housing market six-to-nine months
down the road, it is important to
understand current developments
and the near-term outlook for
the employment situation to set
expectations for the market in 2011.
Although employment has now
returned to its pre-recession level
(Q3 2008), the number of people
looking for work has shown unabated
growth over the past two years.As
a result, unemployment remains high
and only a slight decline in the jobless
rate is expected next year — which
will stay well above the average for
the past decade.The labour force will
continue to expand as immigrants
flow into the area and net migration
rises, while the sectors that have
provided pillars of strength for job
creation are expected to scale back
hiring next year.A slower housing
market will reduce hiring in the real
estate services and construction
industry, and a downgraded outlook
for global demand will keep corporate
profits below peak levels, limiting job
openings in the manufacturing and
financial sectors. Furthermore, the
reduced share of full-time jobs should
show little improvement next year as
employers continue to exhibit caution
by hiring more part-time workers
and adding hours back to existing
full-time positions.As a result, wage
growth will remain below the rate of
inflation.All told, job creation over the
next six months will bring the level
of employment above previous highs.
However, growth will be tepid and
considerable slack will remain in the
labour market, translating into modest
growth in housing sales in the second
half of next year.
Mortgage rate outlook
According to CMHC’s base case
scenario, posted mortgage rates will re-
main flat in the second half of 2010 and
in 2011. For 2010, the one-year posted
mortgage rate is assumed to be in the
3.0 to 3.7 per cent range, while three
and five-year posted mortgage rates
are forecast to be in the 3.2 to 6.1
per cent range. For 2011, the one-year
posted mortgage rate is assumed be
in the 2.7 to 3.7 per cent range, while
three and five-year posted mortgage
rates are forecast to be in the 3.5 to
6.0 per cent range.
Figure 5
4
6
8
10
12
TorontoUnemploymentRate
(PerCent)
Toronto Unemployment RateWill Edge Lower1
0
2
1987 1989 1991 1993 1995 1997 1999 2001 2003 2005 2007 2009 2011F
T
Source: Statistics Canada, CMHC
5. 5Canada Mortgage and Housing Corporation
Housing Market Outlook - GreaterToronto Area - Date Released: Fall 2010
Forecast Summary
Toronto CMA
Fall 2010
2007 2008 2009 2010f % chg 2011f % chg
Resale Market
MLS® Sales 95,164 76,387 89,255 86,000 -3.6 81,500 -5.2
MLS® New Listings 155,093 163,169 136,096 156,000 14.6 146,000 -6.4
MLS® Average Price ($) 377,029 379,943 396,154 429,300 8.4 427,700 -0.4
New Home Market
Starts:
Single-Detached 14,769 11,308 8,130 9,850 21.2 6,500 -34.0
Multiples 18,524 30,904 17,819 19,900 11.7 23,100 16.1
Semi-Detached 2,864 2,362 2,032 1,700 -16.3 1,600 -5.9
Row/Townhouse 5,280 4,612 2,918 4,700 61.1 4,200 -10.6
Apartments 10,380 23,930 12,869 13,500 4.9 17,300 28.1
Starts - Total 33,293 42,212 25,949 29,750 14.6 29,600 -0.5
Average Price ($):
Single-Detached 515,325 540,560 582,123 605,500 4.0 617,600 2.0
Median Price ($):
Single-Detached 446,990 480,900 496,945 519,300 4.5 532,300 2.5g , , , , ,
New Housing Price Index (1997=100) (Toronto-Oshawa) 2.7 3.5 -0.1 2.9 2.0
Rental Market
October Vacancy Rate (%) 3.2 2.0 3.1 3.2 0.1 2.9 -0.3
Two-bedroom Average Rent (October) ($) 1,061 1,095 1,096 1,104 - 1,117 -
Economic Overview
Mortgage Rate (1 year) (%) 6.90 6.70 4.02 3.47 - 3.20 -
Mortgage Rate (5 year) (%) 7.07 7.06 5.63 5.59 - 5.20 -
Annual Employment Level 2,865,500 2,922,800 2,890,500 2,964,000 2.5 3,041,000 2.6
Employment Growth (%) 2.3 2.0 -1.1 2.5 - 2.6 -
Unemployment rate (%) 6.8 6.9 9.4 9.3 - 9.0 -
Net Migration 61,058 63,102 58,419 63,500 8.7 69,000 8.7
MLS® is a registered trademark of the Canadian Real Estate Association (CREA).
Source: CMHC (Starts and Completions Survey, Market Absorption Survey), adapted from Statistics Canada (CANSIM), CREA, Statistics Canada (CANSIM)
NOTE: Rental universe = Privately initiated rental apartment structures of three units and over
6. 6Canada Mortgage and Housing Corporation
Housing Market Outlook - GreaterToronto Area - Date Released: Fall 2010
Forecast Summary
Oshawa CMA
Fall 2010
2007 2008 2009 2010f % chg 2011f % chg
Resale Market
MLS® Sales 10,217 8,797 9,328 9,200 -1.4 8,650 -6.0
MLS® New Listings 17,153 18,574 13,485 17,000 26.1 16,800 -1.2
MLS® Average Price ($) 265,620 272,429 278,505 299,500 7.5 297,500 -0.7
New Home Market
Starts:
Single-Detached 1,747 1,500 836 1,440 72.2 1,040 -27.8
Multiples 642 487 144 310 115.3 406 31.0
Starts - Total 2,389 1,987 980 1,750 78.6 1,446 -17.4
Rental Market
October Vacancy Rate (%) 3.7 4.2 4.2 4.1 -0.1 3.8 -0.3
Two-bedroom Average Rent (October) ($) 877 889 900 917 - 935 -
Economic Overview
Mortgage Rate (1 year) (%) 6.90 6.70 4.02 3.47 - 3.20 -
Mortgage Rate (5 year) (%) 7.07 7.06 5.63 5.59 - 5.20 -
Annual Employment Level 181,500 186,100 179,500 188,200 4.8 189,700 0.8
Employment Growth (%) 2.4 2.5 -3.5 4.8 - 0.8 -
Unemployment rate (%) 6.2 7.1 9.0 10.3 - 9.9 -
MLS® is a registered trademark of the Canadian Real Estate Association (CREA).
NOTE: Rental universe = Privately initiated rental apartment structures of three units and over
Source: CMHC (Starts and Completions Survey, Market Absorption Survey), adapted from Statistics Canada (CANSIM), Toronto Real Estate Board,
Statistics Canada (CANSIM)
8. FREE REPORTS AVAILABLE ON-LINE
n Canadian Housing Statistics
n Housing Information Monthly
n Housing Market Outlook, Canada
n Housing Market Outlook, Highlight Reports – Canada and Regional
n Housing Market Outlook, Major Centres
n Housing MarketTables: Selected South Central Ontario Centres
n Housing Now, Canada
n Housing Now, Major Centres
n Housing Now, Regional
n Monthly Housing Statistics
n Northern Housing Outlook Report
n Preliminary Housing Start Data
n Renovation and Home Purchase Report
n Rental Market Provincial Highlight Reports Now semi-annual!
n Rental Market Reports, Major Centres
n Rental Market Statistics Now semi-annual!
n Residential Construction Digest, Prairie Centres
n Seniors’ Housing Reports
n Seniors’ Housing Reports - SupplementaryTables, Regional
Get the market intelligence you need today!
Click www.cmhc.ca/housingmarketinformation
to view, download or subscribe.
Housing market
intelligence
you can count on
CMHC’s Market Analysis
Centre e-reports provide
a wealth of detailed local,
provincial, regional and national
market information.
Forecasts and Analysis –
Future-oriented information
about local, regional and
national housing trends.
Statistics and Data –
Information on current
housing market activities —
starts, rents, vacancy rates
and much more.
2010 CANADIAN HOUSING OBSERVER,with a feature on Housing and the Economy
National in scope, comprehensive in content and analytically insightful, the Canadian Housing Observer
lays out a complete picture of housing trends and issues in Canada today. Access additional online data
resources and download your FREE copy today!
64319_2010_B02