Cara Menggugurkan Kandungan Dengan Cepat Selesai Dalam 24 Jam Secara Alami Bu...
Bipolar esquizofrenia neuropsicologia
1. Copyright ª Blackwell Munksgaard 2007
Bipolar Disorders 2007: 9: 71–92 BIPOLAR DISORDERS
Original Article
Neuropsychological symptom dimensions in
bipolar disorder and schizophrenia
Czobor P, Jaeger J, Berns SM, Gonzalez C, Loftus S. Pa Czobora,b, Judith Jaegerc,d,
´l
Neuropsychological symptom dimensions in bipolar disorder and Stefanie M Bernsc, Cristina
schizophrenia. Gonzalezc and Shay Loftusc
Bipolar Disord 2007: 9: 71–92. ª Blackwell Munksgaard, 2007 a
DOV Pharmaceutical Inc., Hackensack, NJ,
b
Nathan Kline Institute for Psychiatric Research,
Background: While neurocognitive (NC) impairments have been well
Orangeburg, cThe Center for Neuropsychiatric
documented in schizophrenia (SZ), there is limited data as to whether
Outcome and Rehabilitation Research, The Zucker
similar impairments are present in other persistent mental illnesses.
Hillside Hospital, North Shore Long Island Jewish
Recent data indicate that NC impairments may be manifested in bipolar
Health System, Glen Oaks, dDepartment of
disorder (BPD) and that they persist across disease states, including
Psychiatry and Behavioral Sciences, Albert Einstein
euthymia. An important question is whether a comparable structure of
College of Medicine, Bronx, NY, USA
NC impairments is present in the 2 diagnostic groups.
Objective: In a previous factor analytic study, we identified 6 factors to
describe the basic underlying structure of neuropsychological (NP)
functioning in SZ: Attention, Working Memory, Learning, Verbal
Knowledge, Non-Verbal Functions, Ideational Fluency. The goal of this
study was to investigate whether this factor structure is generalizable for
BPD.
Methods: The BPD sample included patients (n ¼ 155) from an
ongoing longitudinal study evaluating BPD at the time of hospitalization
for relapse and at multiple time points over the following 2 years. The SZ
sample included patients (n ¼ 250) from a 3-year study. For the current
examination the baseline NP evaluations were selected for both samples.
Results: Exploratory and confirmatory factor analyses in the BPD
sample yielded factors similar to those identified in the SZ sample. The
Key words: bipolar disorder – commonality in
coefficients of congruence ranged between 0.66–0.90 for the individual
factor structure – neuropsychological symptom
factors, indicating a good overall correspondence between the factor
dimensions – schizophrenia
structures in the 2 diagnostic groups. Analysis of covariance (ANCOVA)
analysis with education level, full scale-IQ, gender and ethnicity as
Received 1 July 2005, revised and accepted for
covariates indicated that SZ patients had markedly worse performance
publication 17 August 2006
on the Attention and Non-Verbal Functioning factors compared to the
BPD patients. Corresponding author: Judith Jaeger, PhD, MPA,
AstraZeneca Pharmaceutical Company, FOC
Conclusions: Together, these data suggest that while the same W2-651, 1800 Concovel Plaza, Wilmington, DE
underlying factor structure describes NP functioning in both groups, the 19803, USA. Fax: +1 302 886 4803.
profile of impairments appears to vary with the diagnosis. e-mail: jaeger.ju@gmail.com
Controversy exists over whether bipolar disorder than a century ago (2); it considers differences
(BPD) and schizophrenia (SZ) are best character- between psychotic symptoms across diagnoses as
ized as separate disorders or along a continuum qualitatively different. Current diagnostic systems
(1). The classical position assumes a categorical such as DSM (3) and ICD-10 (4) operationalized
view based on Kraepelin’s proposition from more this view, and try to separate bipolar illness
(excluding recurrent major depression, which
Kraepelin had grouped with manic depression)
The authors of this paper do not have any commercial associations and SZ in a categorical fashion by requiring the
that might pose a conflict of interest in connection with this manu- presence or absence of certain symptoms for the
script. purpose of diagnosis. However, since symptoms
71
2. Czobor et al.
may overlap, sometimes for extended periods, the specific additive genetic variance (19% for mania
differential diagnosis of BPD and SZ frequently and 33% for SZ) (15). Similar to studies examining
poses a problem in clinical practice. In response to pathophysiology, studies of genetic susceptibility
this, an alternative, dimensional view is often for the most part suffer from design challenges that
invoked in contrast to the prevailing categorical bias against findings that would distinguish the
approach, which posits that BPD and SZ do not groups as Kraepelin had proposed (e.g., the
represent a discrete illness entity. For example, difficulty of blinding the co-twin’s diagnosis during
Crow proposed that psychosis might vary along a the diagnostic process, the practice of including
continuum, extending from unipolar affective dis- cases with overlapping features which increases the
order through bipolar affective disorder and schiz- chance of diagnostic error and the exclusion of
oaffective disorder to typical SZ (1, 5). recurrent major depression from the bipolar
Recently, the dimensional view has gained favor group).
in a rapidly growing literature emphasizing shared To address the question of disease boundaries,
abnormalities that cut across the current diagnostic there is growing interest in identifying more
divide. For example, shared morphometric find- precisely defined quantitative traits, which would
ings, such as enlarged ventricles (6), and white represent more direct ÔdownstreamÕ biological
matter volume reductions in the left frontal and consequences of genes than the symptoms. Such
temporoparietal regions were found in both disor- traits, or endophenotypes could serve as an alter-
ders (7). Furthermore, common cellular and native (or complement) to the categorical disease
molecular patterns were observed, including a phenotypes, and potentially underlie a more accu-
decrease in cell density in the GABAergic inter- rate diagnostic classification. Based on their herit-
neurons in SZ as well as in BPD (8). At the ability and the fact that they can be measured
intracellular level, both diagnostic groups showed objectively and reliably, certain domains of neuro-
abnormalities in intracellular molecules (e.g., cognitive (NC) performance have been considered
PSD95) that provide a physical link between as candidate endophenotypes in major mental
multiple neurotransmitter systems (including the disorders including BPD and SZ.
glutamatergic and dopaminergic systems) which In the case of SZ, general NC deficits and deficits
are potentially involved in the neurobiology of SZ in various specific tasks indexing broader cognitive
and affective disorders (9). Since these studies do domains have been demonstrated, particularly in
not systematically exclude cases that are diagnos- tasks of Attention, Long-Term Memory, Working
tically challenging (e.g., share substantial features Memory, and Executive Functioning (16). With
of both disorders) findings of shared pathophysi- regard to BPD, in the earlier literature, a common
ology may be confounded by the incorrect classi- misconception was that, in contrast to SZ, bipolar
fication of cases. affective disorder is not associated with general
Recent studies have also reported apparent cognitive impairment independent of illness
overlap in the genetic susceptibility between BPD episodes, or in the premorbid state (6). However,
and SZ. For example, family studies show a newer literature challenged this view, and con-
substantial degree of familial co-aggregation verging evidence suggests that persons with BPD
between bipolar illness and SZ (10). Moreover, exhibit persistent cognitive impairment across a
systematic whole genome linkage studies raised the range of tasks of Attention, Memory and Execu-
possibility of some common chromosomal regions tive Function during remission (17–21). Further-
shared by BPD and SZ, although various meta- more, cognitive dysfunctions seem to be present in
analyses yielded inconsistent results with regard to BPD patients not only during acute symptom
the strength of the evidence for each of the exacerbation but both in prodromic and residual
potential candidate regions (11–13). Additionally, phases (14).
in candidate gene studies, specific genes have been Some of the authors concluded that particularly
identified in which variation appears to confer the poor performance on tests of Verbal Memory was
risk to both BPD and SZ (with the strongest consistently found as a characteristic of BPD (17,
evidence shown for G72/G30, in the 13q candidate 22). Glahn et al. (23) recently suggested that
region, but common susceptibility was raised for Verbal Learning and Memory and Executive
example for BDNF, COMT, DISC1, neuregulin 1, Function/Working Memory may represent the
and dysbindin) (11, 14). In addition, results from most salient endophenotypic components of
the first diagnostically unrestricted twin study neurocognition in BPD because these domains
indicate that the common shared additive genetic appear heritable, co-segregated within families,
variance is substantially higher for mania and SZ associated with the disease, and impaired during
(49% and 68%, respectively) than the diagnosis- periods of symptom remission.
72
3. Neuropsychological symptom dimensions
An important theoretical question regarding NC tioning did not reach significance (effect size ¼
functions as potential candidate endophenotypes is 0.33). However, it is difficult to evaluate the
their diagnostic specificity. A recently conducted validity of these results since it is conceivable that
meta-analysis of all comparative studies indicated the group differences were confounded by the
that patients with BPD generally perform better extent to which the NC domains represented
than patients with SZ, but the distribution of effect different underlying constructs (factors) across
sizes revealed a large degree of heterogeneity (24). diagnoses.
In particular, this investigation compared NC In general, the above literature that compared
performance in patients with BPD and SZ in 11 NC in patients with BPD and SZ had certain
NC domains. The 11 domains comprised: Verbal limitations. The majority of studies used only a
Fluency, Verbal Working Memory, Executive relatively small set of tasks, and the composition of
Control, Visual Memory Delayed, Mental Speed, tasks was vastly different across studies. This
Verbal Memory Immediate, IQ, Verbal Memory makes the comparisons difficult, and limits the
Delayed, Concept Formation, Visual Memory interpretability of the findings since the various
Immediate, and Fine Motor Skills. The meta- components of the NC profiles across diagnoses
analysis (24) showed significantly worse perfor- were assembled from data derived from different
mance in the patients with SZ in 9 out of 11 studies. A potential research strategy to overcome
cognitive domains. The only areas in which this problem and to compare patterns of NC
performance of the 2 patient groups were not deficits in BPD and SZ is to administer a compre-
statistically significant were delayed Visual Mem- hensive neuropsychological (NP) battery consisting
ory and Fine Motor Skills. of several measures tapping into each of several
Another recently published meta-analytic review putative NC domains. However, those studies that
of the literature (16), defined only 4 major NC investigated multiple areas simultaneously, focused
domains, which included IQ, Attention (Sustained, on a different number of domains, and applied
Selective), Memory, and Executive Functions different definitions. Since component measures
(Cognitive Flexibility, Working Memory, Verbal were arbitrarily selected, the domainsÕ (construct)
Fluency). This review concluded that BPD patients validity may not generalize to different samples, or
exhibit extensive cognitive abnormalities with a within the same sample over time. The 2 large
pattern of deficits that is not unique to this disease. recent meta-analyses published only a few months
The study by Seidman et al. (22) focused specif- apart from each other (16, 24; see above), consid-
ically on a comparison of profiles of NC abnor- ered 11 and 4 domains, respectively, whereas the
malities between BP and SZ in 8 domains, study by Seidman et al. (22) defined 8 domains for
including Verbal Ability, Visuo-Spatial Ability, the comparison of respective NP profiles.
Abstraction/Executive, Verbal/Declarative Mem- To our knowledge, no empirical evidence has
ory, Perceptual-Motor Functions, Mental Control, been shown to demonstrate that the various
and Sustained Attention/Vigilance. Similar to the definitions of the underlying NC domains were
above 2 meta-analyses, this study concluded that valid in a particular diagnostic group, and gener-
while the level of impairments was higher in alizable across diagnoses. Obtaining such evidence
patients with SZ, the profile shape did not differ is a logical prerequisite of further group compar-
between BPD and SZ. Overall, Abstraction, Mem- isons, and as stated by Horn and McArdle (26,
ory, Perceptual-Motor Functions, and Vigilance p. 117) without such evidence, Ôthe basis for
showed the largest impairments in both groups, drawing scientific inference is severely lackingÕ.
with a higher level of impairment in patients with Factor analysis provides 1 way to obtain this
SZ in this study (22). evidence based on the analysis of interrelationships
Using a standardized test battery (Repeatable among various NC measures. Surprisingly, despite
Battery for the Assessment of Neuropsychological the fact that a substantial research effort has been
Status; RBANS), Hobart et al. (25) showed that spent to demonstrate that BPD and SZ share
patients with SZ were more impaired than patients specific domains of psychopathology in terms of
with BPD in terms of general functioning [medium factor analytic structure, as far as we know, no
effect size (0.55) for the total score], and that previous studies compared the NC factor structure
among 5 NC domains including Visuospatial/ derived from the same instrument in both bipolar
Constructional, Language, Attention, Delayed and schizophrenic patients. In our previous factor
Memory and the Immediate Memory only the analysis of patients with SZ, on the basis of the
latter (Immediate Memory, effect size ¼ 0.65) analysis of a comprehensive NC test battery, we
obtained a significant difference between the derived 6 clearly identifiable factors that had good
groups. The difference in terms of attention func- psychometric properties with excellent construct,
73
4. Czobor et al.
divergent and predictive validity, and stability over received a comprehensive NC test battery and
time in a longitudinal study (factors included Positive and Negative Symptom Scale (PANSS)
Attention, Working Memory, Learning, Verbal (29) ratings at baseline (used for the present report)
Knowledge, Non-Verbal Functions, and Ideational and again after 6, 18 and 36 months (not included
Fluency). The principal objective of the current in this report). Staff administering NC tests were
study was to extend this research further, by previously trained and observed in test battery
investigating whether the same underlying factor administration to assure uniformity. The PANSS
structure of NC functions that characterized patients raters had demonstrated interrater reliability com-
with SZ would generalize to patients with BPD. pared to an expert (ICC ‡ 0.80).
For the present analyses, the final dataset from
this study was used; subjects were included in the
Methods
analyses if they had completed the baseline NC
The data for the research reported here were assessment. Baseline NC testing was conducted
collected in 2 longitudinal clinical studies inves- whenever possible when patients were optimally
tigating predictive and concurrent associations stabilized after hospitalization for the index
between neurocognitive performance and disability episode. A total of 250 patients, with the diagnosis
in life (psychosocial) functioning (LF) in individ- of SZ (n ¼ 185; 74%) or schizoaffective disorder
uals with serious mental illnesses [see companion (n ¼ 65; 26%) were enrolled in the study.
paper (27) in this issue for further details of this
research]. The 2 studies represented subsequent Study 2: Bipolar sample. The subjects for the
phases of the research project. The goal of the first analyses that we report here are consenting patients
(Study 1: ÔSchizophrenia StudyÕ) was to test the from an ongoing 24-month study investigating
longitudinal relationship between NC deficits and predictive and concurrent associations between
life functioning (disability) in patients with SZ NC deficits and disability in life functioning in
or schizoaffective disorder; the aim of the second individuals with BPD. The objective of this natu-
(Study 2: ÔBipolar StudyÕ) was to investigate the ralistic longitudinal study is to evaluate approxi-
above relationship in patients with BPD. mately 200 individuals aged 18 to 54 years with
Both studies collected a large number of NC BPD [diagnosed using SCID (3)] at the time of
variables and aimed to conduct factor analyses for hospitalization for relapse and at multiple time
the purpose of data (dimensionality) reduction. points over the following 24 months. For the
This aim was previously accomplished in the first present analyses, an interim dataset from this
study in a subset comprised of the first 156 patients ongoing study was cleaned and frozen (i.e., no
enrolled (see below for further details). The core further changes were made in the database); subjects
results, including details concerning the NC factors from this database were included in the analyses, if
that were identified, have been published (28). they had completed the baseline NC assessment.
Since the principal purpose of Study 2 was similar Baseline NC data from a total of 155 subjects were
to that of Study 1, and dimensionality reduction used for the purpose of the current investigation.
was an important tool to achieve a reduction in Using cut-off scores for the Clinician-Adminis-
Type I error arising from multiple repeated testing tered Rating Scale for Mania (CARS-M; 15 items)
of individual variables, an essential question was (30) of 0–7 for questionable and 8–15 for mild
whether the same factor structure that we found in mania and, for the Hamilton Depression Rating
the SZ sample is applicable to the bipolar sample. Scale (HAM-D; 17 items) (31), 0–6 for not
Hence, the question of generalizability of the NC depressed and 7–17 mildly depressed, we found
factors across diagnoses served as a principal that the majority (approximately 54%) of the
practical motivating problem for the current sample had no or mild symptoms on both scales.
investigation. Approximately 30% had moderate to high mania
with no or low depressive symptoms, and, con-
versely, approximately 11% of the sample had
Subjects
moderate to high depression with no or mild mania
Study 1: Schizophrenia sample. Subjects were con- at the time of neurocognitive testing. Approxi-
senting patients in a 3-year study of SZ and mately 5% of the sample had active mixed symp-
schizoaffective disorder [diagnosed using the Struc- tomatology at the time of testing (e.g., moderate or
tured Clinical Interview for DSM-IV (SCID)] greater symptoms on both mania and depression
which involved repeated neurocognitive testing. rating scales).
Subjects were enrolled within 6 months of symp- Altogether, 11% (n ¼ 17) of the subjects in the
tom exacerbation requiring hospitalization, and primary dataset (n ¼ 155) evidenced symptoms on
74
5. Neuropsychological symptom dimensions
Delusions involving ÔReplacement of WillÕ (Delu- demographic prevalence data, the proportion of
sions of Control, Thought Insertion, Thought female patients was higher in the bipolar as
Deletion, Thought Broadcasting) and Hallucina- compared to SZ group. In addition, the bipolar
tions, reflecting the overlapping boundaries of sample demonstrated a significantly higher full
BPD with the SZ spectrum in terms of symptom scale-IQ and more years of education, although the
presentation. In secondary analyses, we investi- former difference was quite modest (3.7 points in
gated whether the inclusion of these subjects in the full scale-IQ). The 2 groups evidenced mild levels
sample had an impact on the principal results. of symptom severity as shown by the respective
psychometric ratings in each group, CARS-M (30)
and the HAM-D scale (31) for the bipolar patients;
Comparison of the 2 samples
the PANSS positive and negative symptom sub-
The demographic characteristics of the bipolar scale for the schizophrenics (Table 1).
(n ¼ 155) and SZ (n ¼ 250) samples are shown in In the bipolar sample, at the time of the current
Table 1. analyses, medication data were available for a total
As Table 1 shows, the 2 groups were essentially of 142 patients (91.6% of 155). The distribution
identical in terms of age, onset of illness, and age at (%) of the most common treatments was the
which they received the first psychiatric treatment. following: lithium (69.0%), anticonvulsants
The groups, however, were significantly different (67.3%), neuroleptics (typical and atypical neuro-
(p < 0.05) in their ethnicity and gender distribu- leptics combined: 65.5%), valproic acid (60.6%),
tions. In particular, a significantly higher propor- antidepressants (38.0%), benzodiazepines (22.4%),
tion of patients from the white ethnic group were and anxiolytics (18.3%).
present in the bipolar as compared to the SZ Overall, the analysis of the medication data
sample. Furthermore, as expected on the basis of indicated that all patients received polypharmacy
in the bipolar sample. In the SZ sample, while
Table 1. Descriptive and demographic characteristics in the bipolar and the
polypharmacy was common, the overwhelming
schizophrenia (reference) sample
majority of the patients (93% of the sample) were
Bipolar Schizophrenia taking at least 1 neuroleptic medication at baseline.
sample sample The distribution of atypical and typical agents in
Characteristics (n ¼ 155a) (n ¼ 250a,b)
the sample was 68% and 32%, respectively. In
Mean (SD) Mean (SD) addition to the neuroleptics, in the SZ sample,
Age 35.4 (10.9) 36.3 (9.1) many patients were taking another class of
Onset of illness 19.1 (8.4) 19.1 (6.5) psychotropic medication as well including mood
Age first treated 21.2 (8.8) 20.6 (6.8)
stabilizers, anxiolytics, and antidepressants.
Education 14.1c (2.4) 12.0c (2.5)
Full scale-IQ 86.4c (11.9) 82.7c (10.3)
CARS-Md/PANSS POSe 13.0 (8.9) 18.9 (5.5)
Measures
HAM-Dd/PANSS NEGe 10.6 (6.4) 20.1 (5.8)
Gender, n (%) Psychopathology. Psychometric assessments of
Male 67 (43.2f) 156 (62.4f)
symptom severity in each study were conducted
Female 88 (56.8) 94 (37.6)
Race, n (%) at baseline and each of the follow-up visits includ-
White 113 (72.9f) 99 (39.6f) ing neuropsychological testing. The rating instru-
Black 29 (18.7) 106 (42.4) ments in each study were specific to the population
Hispanic 7 (4.5) 28 (11.2) targeted in that study. In Study 1, which focused
Other 6 (3.9) 17 (6.8)
on patients with SZ and schizoaffective disorder,
a
Sample size may vary due to missing data. the principal measures of psychopathology were
b
Diagnostic distribution: schizophrenia ¼ 74% (n ¼ 185) versus the PANSS and the Brief Psychiatric Rating Scale
schizoaffective disorder 26% (n ¼ 65). (BPRS) (32). In Study 2, which focused on patients
c
Significant mean difference (p < 0.05) between the two sam- with BPD, the principal measures of psychopa-
ples (ANOVA).
d thology were the CARS-M (30) and the HAM-D
In the bipolar sample, symptom severity was indexed by the
total score on the Clinician-Administered Rating Scale for Mania
(31). The raters for each of these rating instruments
(CARS-M) and the Hamilton Rating Scale for Depression (HAM- in our study had demonstrated interrater reliability
D; 17-item version), respectively. compared to an expert (ICC > 0.80).
e
In the schizophrenia sample, symptom severity was indexed by
the total score on the positive (POS) and negative symptom Neurocognitive performance. The NC battery was
(NEG) subscale of the Positive and Negative Symptom Scale
(PANSS), respectively. designed to examine functional domains previously
f
Significant difference in proportions (p < 0.05) between the two considered important by virtue of their demon-
samples (chi-square test). strated impairment in people with major mental
75
6. Czobor et al.
Table 2. Neuropsychological tests used in the present study research is dimensionality reduction – to find a
Neuropsychological tests
suitable representation of such multivariate data
(i.e., to identify, based on the pattern of relation-
Wechsler Adult Intelligence Scale-Revised (WAIS-R) (57) ships among the observed variables, a relatively
Wechsler Memory Scale Revised (WMS-R) (58) low number of basic underlying dimensions that
Letter Number Span (46)
Complex Ideational Material (47)
provide the most efficient description of the vari-
Concentration Endurance Test (D2) (48) ation in the data). This goal, in general, can be
Stroop Test (49) achieved by various multivariate techniques,
Wisconsin Card Sorting Test (128-card manual version) (50) including factor and principal component analyses
Trail Making Test (A&B) (51) (PCA), which view the observed variables as
Controlled Oral Word Association Test (COWAT) (52)
Animal Naming Test (51)
manifestations of some underlying, latent set of
Ruff Figural Fluency Test (53) factors (dimensions).
Grooved Pegboard Test (54) However, when applied to NC data, traditional
Finger Tapping Test (55) multivariate methods, including PCA run into
Edinburgh Handedness Inventory (56) serious difficulties because of the extremely high
number of variables in the data relative to the
disorder and their relations to functional outcomes. number of observations. Even if the geometric
It includes 14 tests focused on measures of General properties of PCA remain valid, and numerical
Ability, Attention, Working Memory, Verbal techniques yield stable results, the covariance
Knowledge, Learning, Non-Verbal Functions, Ide- matrix on which the analysis is carried out is
ational Fluency, Executive Functions, and Motor sometimes a poor estimate of the real population
Skills (Table 2). The specific tests used have been covariance. Thus, the analysis under these condi-
previously described by us and others; thus, we tions fails to provide a robust, generalizable
provide only a brief description in the Appendix. solution.
Staff administering NP tests were previously To deal with this problem, in our previous study
trained and observed in test battery administration to identify the basic NC dimensions in patients
to assure uniformity. As mentioned above, the with SZ, a 2-stage procedure was designed to
same neuropsychological test battery was admin- implement the PCA in a stratified way. Briefly, in
istered in both studies; however, we note that 3 of Stage 1, the neuropsychological variables were
the variables were not obtained in the bipolar study divided into blocks based on a priori knowledge
due to the fact that our preliminary analyses about their observed associations. The 10 a priori
indicated that they displayed a high degree of blocks comprised Sustained Vigilance, Short-Term
overlap with variables in their respective factors, Memory Capacity/Span, Working Memory, Set
and that the omission of these variables had Shifting/Cognitive Flexibility, Ideational Fluency,
essentially no impact on the internal consistency Verbal Learning, Non-Verbal Learning, Verbal
of these factors (change in Cronbach alpha was Knowledge, Non-Verbal Reasoning/Problem
<0.05 for these factors). These variables were the Solving, and Motor Functioning. In Stage 2, the
Visual Memory Span Forward [Wechsler Memory variables in each block were subjected to factor
Scale-Revised (WMS-R); included in the Attention (principal component) analysis to identify the basic
factor based on Study 1]; Wechsler Adult Intelli- underlying NC constructs (factors) that explained
gence Scale-Revised (WAIS-R) Information (in- most of the variation within such a block of
cluded in the ÔVerbal KnowledgeÕ factor); and the variables.
WAIS-R Object Assembly variables (included in The factor analysis was based on the principal
the ÔNon-Verbal FunctionsÕ factor). component method, and the PROMAX rotation
At the time of the previous publication, Study 1 (33) was applied in order to obtain a conceptually
was ongoing and data were available only from a interpretable simple structure. The PROMAX
subset of 156 subjects. By the time of the current rotation is an oblique rotation technique which
analyses, the data were available from the entire SZ allows for correlation between factors. Since there
sample; thus, we used all available data for the are conceptual as well as clinical reasons to
current study of the replicability of the NC factor presume a substantial correlation between the NC
structure across the 2 diagnostic samples. factors, this technique provides a more realistic
representation of the data than the orthogonal
solution which assumes independence. Further
Conceptual framework of the statistical analyses
details of our procedures are described elsewhere.
NC test batteries typically yield a large number of We note here, however, that a technique called
variables, hence a fundamental goal in NC Ôblock principal component analysisÕ (BPCA) has
76
7. Neuropsychological symptom dimensions
been described recently in the literature (34), which Test Perseverative Errors, Stroop Interference,
analogous to the 2-stage procedure employed in Trails B-Trails A/Trails A, Grooved Pegboard
our study, relies on variable stratification. Using Preferred plus Non-Preferred Hand, Finger Tap-
multivariate statistical theory, it has been demon- ping Preferred plus Non-Preferred Hand.
strated that BPCA is as efficient as ordinary
principal component analysis for dimensionality
Statistical analyses
reduction (34).
Based on the above approach, in our previous For the purpose of the current investigation,
study (28), 6 factors were extracted as having good generalizability was considered as factorial invar-
construct, divergent and predictive validity, and iance, i.e., constancy in the structure of the
stability over time over an 18-month period of underlying NC constructs across diagnoses (BPD
observation. The 6 factors were Attention, Work- versus SZ). The concept of factorial invariance was
ing Memory, Learning, Verbal knowledge, Non- based on Thurstone’s notion of simple structure
Verbal functions, and Ideational Fluency (Table 3). (35), which states that the pattern of salient (non-
An additional 5 NC measures, which have been zero) and non-salient (zero or near-zero) loadings
widely studied in SZ, could not be reliably com- defines the structure of a psychometric construct.
bined with any of these factors or with each In terms of factorial invariance, the principle of
another, indicating the need to examine them simple structure entails configurational invariance;
separately. These include: Wisconsin Card Sorting items comprising the same construct are expected
to exhibit the same configuration of salient and
Table 3. Six neurocognitive factors derived from the schizophrenia sample
non-salient factor loadings across the 2 diagnostic
Neurocognitive Neurocognitive measure included groups.
factor in factor The analyses were conducted in multiple steps.
Attention D2 – letters minus errors First, the homogeneity of the correlation matrices
Stroop - words only across the 2 diagnostic samples was tested. Second,
Stroop - color only the empirical data from the bipolar sample were
Trails A subjected to unrestricted exploratory factor analy-
WMS-R Visual Memory Span Forwarda
sis (EFA) to examine whether model modifications
WAIS-R Digit symbol
Working memory D2 fluctuation were necessary in terms of the number of the factors
WAIS-R Digit span forward and item composition of the underlying constructs
LNS, number correct derived in the SZ sample. Third, confirmatory
LNS, longest factor analyses (CFA) (33) were conducted to
WAIS-R Arithmetic
statistically test the configurational invariance of
WAIS-R Digit Span Backward
WMS-R Log Mem Immed the hypothesized factor structure, i.e., to examine
Learning WMS-R – Verbal Pair I whether the items have the same relationship to the
WMS-R – Verbal Pair II same underlying factor as posited on the basis of
WMS-R – Visual Pair I the earlier analyses in the SZ sample. Fourth, since
WMS-R – Visual Pair II
the CFA addresses the configurational invariance
Verbal knowledge WAIS-R – Vocabulary
WAIS-R – Informationa of factors across samples but does not directly
WAIS-R – Comprehension investigate the extent of similarity, a factor
WAIS-R – Similarities analysis with confirmatory Procrustes rotation
Non-verbal functions WAIS-R – Block Design was performed to examine the extent of similarity
WAIS-R – Object Assemblya
between the BPD and SZ samples with regard to
WAIS-R – Picture Completion
WAIS-R – Picture Arrangement each of the individual factors. Finally, in Step 5, the
Ideational fluency WCST Number of Perseverative Errors psychometric properties (reliability and construct
Ruff Figural Fluency Unique Designs validity) of the NC factors derived in the bipolar
COWAT sample were examined.
Animal Naming
D2 ¼ Concentration Endurance Test; Stroop ¼ Stroop Color- Step 1: Homogeneity of correlation matrices. In
Word Interference Test; Trails ¼ Trailmaking Test; LNS ¼ Letter Step 1, we tested the null-hypothesis of no-differ-
Number Span Test; Log Mem Immed ¼ Logical Memory ence in the correlation matrices between the BPD
(immediate recall); WCST ¼ Wisconsin Card Sorting Test; and the SZ sample. The analysis was based on the
COWAT ¼ Controlled Oral Word Association Test.
a likelihood ratio approach, using nested hierarchi-
Variables not available in the bipolar sample included:
Wechsler Memory Scale Revised (WMS-R) Visual Memory Span cal models of the data as implemented by the SAS
Forward; Wechsler Adult Intelligence Scale-Revised (WAIS-R) PROC MIXED procedure (36). In particular,
Information; and the WAIS-R Object Assembly. using the maximum likelihood estimation, first we
77
8. Czobor et al.
derived a null-model likelihood by positing an other. In model 1, the basic assumption was that
unstructured homogeneous correlation matrix for the 6 NC factors represent 6 distinct constructs
the empirical data across the 2 diagnostic groups. with no relationship (correlation) between them. In
Second, we relaxed the homogeneity condition model 2, all factors were considered interrelated
(posited a heterogeneous correlation matrix by constructs and a correlation was therefore allowed
diagnostic group) and examined whether the between any of the 6 factors. In the CFA, estimates
resulting improvement in the likelihood reached of loadings of the individual neuropsychological
statistical significance. Test of improvement in items were obtained for their hypothesized factors.
model fit was based on chi-square statistics. Values of t-statistics were used to test whether the
individual items were significantly related to their
Step 2: Exploratory factor analyses. A failure to specific factors.
reject the null-hypothesis with regard to the The Root Mean Square Error of Approximation
homogeneity of the correlation matrices across (RMSEA) and the Goodness of Fit Index (GFI)
the 2 diagnostic groups may be a reflection of low were used to assess model fit for the entire CFA
statistical power. Thus, in view of the fact that we model. The RMSEA indicates the fit of the model
had a relatively small sample size, it is possible that to the covariance matrix (or correlation matrix, as
the 2 groups have certain systematic differences in our study). It represents the square root of the
which would not result in the rejection of the average amount that the sample covariances differ
null-hypothesis in our study. For example, it is from their estimates derived on the basis of the
conceivable that the number of interpretable posited factor model. As a guideline, RMSEA
factors is different in the 2 samples, or that most values below 0.1 are generally considered to
but not all of the factors are replicable (i.e., partial indicate an adequate fit, whereas values of <0.05
versus full factorial invariance). Therefore, before represent a close fit. For GFI, values above 0.90
we proceeded with the CFA, we performed EFA to are considered as an indication of an adequate
investigate whether the theoretically-postulated model fit.
factor structure derived from the SZ sample
represents an adequate representation of the Step 4: Generalizability across samples. As de-
pattern of observed associations among a group scribed above, following Thurstone (35), the most
of variables in the BPD sample. More specifically, basic conceptualization of a construct is the
in these preliminary analyses, we investigated pattern of non-zero and zero loadings, not the
whether model improvements were necessary in particular magnitude of the non-zero loadings. In
terms of the number of factors that need to be this theoretical framework, in order to establish
retained for further analyses, and in terms of the whether a construct can be conceptualized in the
factor structure of the individual factors based on same way across diagnoses, the requirement is that
the distribution of salient and non-salient loadings. the same pattern of (zero and non-zero) factor
Similar to our previous study, we used the principal loadings is found in the individual groups. For this
component method for factor extraction. The reason, in a multi-group CFA no cross-sample
PROMAX rotation was applied in order to derive constraints are imposed on the magnitude of the
a simple structure to facilitate the interpretation. In salient factor loadings; the non-salient loadings
order to examine the dimensionality in an EFA, we are (implicitly) specified to be equal (i.e., zero).
used the Kaiser–Guttman eigenvalue >1 criterion Therefore, whereas the CFA addresses the
(37) and Cattell’s Scree plot (38). Items were configurational invariance of factors across
allocated to factors according to their highest samples, it does not indicate the extent of similarity
loading; the threshold loading of 0.5 was chosen to (generalizability), since it does not take the
indicate saliency. particular magnitude of the loadings into account.
For the current study, confirmatory Procrustes
Step 3: Confirmatory factor analyses. The relation- rotation (39) was applied to investigate the extent
ship between the observed variables and the of similarity (generalizability) between the SZ and
hypothesized underlying constructs can be investi- the BPD samples (maximum congruence). This
gated by CFA. The CFA techniques used in this confirmatory procedure rotates empirically ex-
investigation set a priori definitions of the factor tracted principal components to a theoretically
structure (measurement model) based on the find- specified target matrix of factor loadings to max-
ings from the SZ sample and based on our imize their similarity. The theoretical factor-load-
preliminary EFA findings in the BPD sample. In ing matrix specifies the number of components to
the structural part of the CFA models, 2 theoret- be fitted and the factor-loading pattern of the test
ically possible alternatives were tested against each items. Unlike the CFA method, the Procrustes
78
9. Neuropsychological symptom dimensions
approach estimates loadings for all items (includ- Table 4. Comparison of the 2 groups on the
ing items that are considered non-salient). The individual measures indicated a significantly better
model fit was evaluated by the coefficient of performance in the BPD as compared to the SZ
congruence (CC) (38), normed between +1 and sample for 15 of 30 measures (corrected for
)1. Values of CC of 0.80 and above are considered multiple testing using the Hochberg procedure),
to indicate sufficient similarity between the em- although the magnitude of the difference was
pirically Procrustes-rotated and theoretically pos- generally modest.
tulated factors. The sampling variation of the CC
was estimated using the bootstrap/resampling
Homogeneity of correlation matrices
approach (40). In order to do this, we first
randomly selected 1,000 samples with replacement The null-hypothesis of no-difference between the
from the original database; then, each of these correlation matrices from the BPD and the SZ
samples, whose size was identical to the size of sample was tested by the likelihood ratio test. In
original dataset, was subjected to factor analysis particular, first we derived the null-model likeli-
with Procrustes rotation. hood by positing an unstructured, homogeneous
correlation matrix across the 2 diagnostic groups.
Step 5: Reliability, construct validity. Scale (fac- Second, the homogeneity condition was relaxed
torial) reliability was examined through the inter- (i.e., a heterogeneous correlation matrix was
nal consistency reliability. Internal consistency for posited across the 2 groups), and we examined
each of the 6 NC factors was determined by the use whether the resulting improvement in the model-
of Cronbach alpha (41). External (criterion-re- likelihood over the null-model likelihood reached
lated) validity of the NC factors derived in the statistical significance. The null-model likelihood
bipolar sample was investigated through the con- indicated chi-square ¼ 5130.5 (df ¼ 350, p ¼
vergent, discriminant and concurrent validity. In 0.0001), whereas the heterogeneous correlation
particular, in order to establish convergent validity, model resulted in chi-square ¼ 5330.5 (df ¼ 701,
we examined the degree to which the NC factors p ¼ 0.0001). The likelihood ratio chi-square
yielded convergent information with other, exter- statistic for the improvement in model fit did
nal measures that they would theoretically be not reach statistical significance (p > 0.1), indi-
expected to be similar to. For the purpose of the cating that the homogeneous correlation structure
analyses reported here, 2 of the items of the CARS- provides adequate fit to the data across the 2
M, including ÔDistractibilityÕ (Item 6, which diagnostic groups.
excludes distractibility due to intrusions of visual
and/or auditory hallucinations or delusions and
Exploratory factor analysis
rates whether Ôattention is too easily drawn to
unimportant or irrelevant external stimuliÕ) and Overall, similar to our published findings in the SZ
ÔDisordered ThinkingÕ (Item 11) were investigated. sample, results of the exploratory factor analysis
Since, apart from such selected items, NC func- (principal component method with PROMAX
tioning and psychopathology may represent sepa- rotation) in the bipolar sample indicated 6
rate dimensions, for discriminant validity, we factors based on both the Kaiser–Guttman
examined the degree to which the 6 NC factors eigenvalue criterion (i.e., eigenvalue > 1 for
overlapped with psychometric ratings of clinical factors retained for further analyses) and on
symptoms. In particular, discriminant validity was Cattell’s scree-plot criterion based on the break-
examined via bivariate correlations between the point of the curve. Together, the 6 factors
components of the NC factors and the overall explained approximately 68.0% of the total
severity score of clinical symptoms, indexing mania variance in the neuropsychological dataset in
and depression, respectively. To examine concur- the bipolar sample. The distribution of the
rent validity we assessed the ability of the 6 NC amount of variance explained across the 6 factors
factors to distinguish between the 2 diagnostic was: Working Memory (12.6%), Attention
groups. (12.5%), Verbal Knowledge (12.0%), Non-Verbal
Functions (11.6%), Ideational Fluency (11.1%),
and Learning (9.2%).
Results These results in the bipolar sample were similar
to what we found in the expanded sample of
Demographic and basic descriptive data at baseline
schizophrenic patients that we used for the purpose
Descriptive neuropsychological data on all indi- of the current analyses [n ¼ 250, including the
vidual NC variables of interest are shown in subsample of patients used for our previous
79
10. Czobor et al.
Table 4. Descriptive statistics for individual neurocognitive measures
Bipolar sample (n ¼ 155a) Schizophrenia sample (n ¼ 250a)
Neurocognitive measure Mean (SD) Q1–Q3b Mean (SD) Q1–Q3b
D2 – letters minus errors 358.5c (98.5) 297–429 321.2c (96.7) 251–395
Stroop–words only 89.6c (17.5) 76.5–102.0 79.1c (18.5) 68.0–91.0
Stroop–colors only 59.7c (13.8) 49.0–69.0 53.7c (14.7) 43.0–64.0
Trail Making A Time 43.7c (19.3) 31.0–52.0 51.0c (22.9) 34.0–61.0
WAIS-R Digit Symbol Raw 44.3c (13.6) 34.5–55.0 38.8c (12.6) 30.0–46.0
D2 Fluctuations 16.2 (7.0) 12.0–20.0 15.7 (7.2) 10.0–19.0
WMS-R Digit Span Forward 7.3 (2.1) 6.0–9.0 7.1 (2.0) 6.0–8.0
LNS Total Correct 12.0c (4.1) 10.0–15.0 10.5c (4.1) 8.0–13.0
LNS Longest Item Passed 4.7 (1.1) 4.0–5.0 4.4 (1.3) 3.0–5.0
WAIS-R Arithmetic Raw 8.9c (3.4) 6.0–11.0 7.8c (3.4) 5.0–10.0
WMS-R Digit Span Backward 5.8 (2.4) 4.0–7.0 5.2 (2.0) 4.0–6.0
WMS-R Log Mem Immed 19.9c (8.0) 13.0–25.0 16.1c (7.1) 11.0–21.0
Ruff Figural Fluency Unique Designs 66.8 (24.9) 46.5–82.0 60.2 (21.0) 45.0–73.0
COWAT Total Correct 33.7 (12.4) 24.0–43.0 31.7 (11.4) 24.0–39.0
Animal Naming Total Correct 18.9c (6.8) 15.0–22.0 16.5c (5.8) 13.0–20.0
WAIS-R Vocabulary Raw 40.2c (12.7) 30.0–49.0 34.1c (14.9) 21.0–45.0
WAIS-R Comprehension Raw 15.9c (5.6) 11.0–20.0 13.9c (5.7) 9.0–18.0
WAIS-R Similarities Raw 16.1 (4.7) 13.0–19.0 15.3 (5.4) 12.0–19.5
WAIS-R Block Design Raw 22.6 (10.5) 15.0–29.0 19.7 (9.7) 12.0–25.0
WAIS-R Picture Completion Raw 11.7 (3.9) 9.0–15.0 11.3 (4.1) 9.0–14.0
WAIS-R Picture Arrangement Raw 8.6 (4.5) 5.0–12.0 7.4 (4.4) 4.0–10.0
WMS-R Verbal Paired Association I 16.2 (5.0) 13.0–20.0 15.5 (4.7) 13.0–19.0
WMS-R Verbal Paired Association II 6.6 (1.6) 6.0–8.0 6.5 (1.6) 6.0–8.0
WMS-R Visual Paired Association I 12.0c (5.0) 8.0–17.0 10.1c (4.6) 7.0–14.0
WMS-R Visual Paired Association II 4.8 (1.7) 4.0–6.0 4.5 (1.7) 3.0–6.0
WCST Number of Perseverative Errors 21.0c (16.9) 7.0–33.0 31.2c (22.8) 16.0–38.0
Finger Tapping Preferred 47.5c (9.8) 41.0–53.6 42.6c (9.9) 36.0–50.3
Finger Tapping Non-Preferred 43.6c (8.9) 38.1–49.5 39.4c (9.4) 33.3–46.0
Grooved Pegboard Preferred 99.0 (37.1) 73.5–114.5 111.1 (62.4) 77.0–119.0
Grooved Pegboard Non-Preferred 116.7 (53.2) 80.0–136.0 125.4 (69.0) 90.0–133.0
D2 ¼ Concentration Endurance Test; Stroop ¼ Stroop Color-Word Interference Test; LNS ¼ Letter Number Span Test; Log Mem
Immed ¼ Logical Memory (immediate recall); WAIS-R ¼ Wechsler Adult Intelligence Scale-Revised; WMS-R ¼ Wechsler Memory
Scale-Revised; COWAT ¼ Controlled Oral Word Association Test.
a
Sample size may vary due to missing data.
b
Q1–Q3 ¼ Interquartile range.
c
Significant mean difference (p < 0.05, with Hochberg’s adjustment for multiple testing) between the 2 samples (ANOVA).
analyses (n ¼ 156)]. In particular, the 6-factor (Table 4, last 4 rows) to the set of NC variables
solution in the SZ sample explained 67.8% of the that we used above, and repeated the exploratory
variance. Furthermore, the individual factors factor analysis that we performed for the more
explained a similar amount of variance in the SZ limited set of measures that did not include the
as in the BPD sample, with the exception of the motor variables. Similar to our previous analyses,
ideational fluency factor which was associated with the results indicated that the motor variables did
a smaller amount of explained variance in the SZ not load on any of the 6 basic NC factors described
sample. The distribution of explained variance above. In addition, a single motor factor could not
across the 6 factors in the SZ sample was: be derived. Instead, based on the 4 variables that
Attention (15.0%), Working Memory (12.5%), we used for the analysis 2 independent small
Verbal Knowledge (11.7%), Non-Verbal Func- factors (containing 2 related variables only)
tions (11.5%), Learning (10.7%) and Ideational emerged, 1 for motor speed (Finger Tapping
Fluency (3.4%). Preferred and Non-Preferred hand, respectively)
In addition to the above EFA analyses that and 1 for dexterity (Grooved Pegboard Preferred
focused on the same set of variables that we and Non-Preferred hand, respectively).
included in our previous analyses in the SZ sample,
similar to our published study, we explored
Confirmatory factor analysis
whether a separate motor factor can be derived
in the BPD sample. For the purpose of this As mentioned in the methods, the CFA analysis set
investigation, we added the 4 motor measures a priori definitions of the factor structure based on
80
11. Neuropsychological symptom dimensions
our earlier findings from the SZ sample. In analysis conducted in the BPD and in the SZ
particular, the CFA assumed a Ôsimple structureÕ: samples, respectively. As Table 5 shows, the results
observed NC variables were allowed to assume a were similar in both samples, suggesting configura-
non-zero estimate only for 1 of the 6 underlying tional invariance across the 2 samples. In partic-
constructs, for which they were considered as ular, the estimated loading coefficients reached
indicators. In other words, estimates of loadings statistical significance for each of the indicators
of the individual NC variables were obtained for (observed NC variables) for each of the hypothe-
their hypothesized factors only; loadings outside sized factors in both samples. We note, however,
the underlying construct were not estimated that for 2 of the variables [Concentration Endur-
(restricted to be 0). ance Test (D2) Fluctuations and Logical memory –
Results of the CFA analysis indicated that the immediate recall (LMI)] the coefficients were low
correlated factor model (Model 2) which allowed (loading estimate <0.45) in both samples.
correlations between the 6 underlying factors Since these findings suggested low indicator
provided a significantly better fit to the data than reliability for these variables with respect to their
the independent factor model (Model 1) (BPD underlying construct (Working Memory, for both
sample: chi-square ¼ 164.4, df ¼ 15, p < 0.0001; D2 Fluctuations and LMI), the above 2 variables
SZ sample: chi-square ¼ 663.3, df ¼ 15, were omitted from our final CFA model. The CFA
p < 0.0001). Indices of overall model fit showed results based on this model indicated an improve-
that GFI did not reach the recommended level in ment in the model fit indices. In the BPD sample,
either of the 2 samples (BPD sample GFI ¼ 0.69; the GFI and the RMSA were 0.72 and 0.086
SZ sample GFI ¼ 0.82); the RMSA values were respectively; in the SZ sample, the analogous
0.094 and 0.074 in the BPD and the SZ samples, values were 0.84 (GFI) and 0.064 (RMSA),
respectively. respectively. Although the GFI indices failed to
Table 5 displays the estimated factor loadings for reach the recommended threshold, our final factor
Model 2 (correlated factors) based on the CFA model was based on the restricted set of variables
Table 5. Confirmatory factor analysis estimates of factor loadings
Bipolar sample Schizophrenia sample
Factor Neurocognitive measure Loading (SE) t-statistic* Loading (SE) t-statistic*
Attention D2 – letters minus errors 0.69 (0.11) 6.19 0.75 (0.06) 12.18
Stroop-words only 0.58 (0.12) 4.98 0.78 (0.06) 12.88
Stroop-colors only 0.70 (0.11) 5.95 0.81 (0.06) 13.69
Trail Making A Time 0.69 (0.11) 6.24 0.65 (0.06) 10.21
WAIS-R Digit Symbol Raw 0.79 (0.11) 7.41 0.75 (0.06) 12.31
Working memory D2 Fluctuations 0.34 (0.12) 2.83 0.23 (0.07) 3.26
WMS-R Digit Span Forward 0.63 (0.11) 5.74 0.59 (0.06) 9.16
LNS Total Correct 0.95 (0.09) 10.58 0.95 (0.05) 18.48
LNS Longest Item Passed 0.87 (0.10) 9.00 0.93 (0.05) 17.85
WAIS-R Arithmetic Raw 0.52 (0.12) 4.53 0.95 (0.06) 10.36
WMS-R Digit Span Backward 0.65 (0.11) 5.86 0.63 (0.06) 10.03
LMI 0.40 (0.12) 3.37 0.41 (0.07) 6.14
Ideational fluency Ruff Figural Fluency Unique Designs 0.80 (0.11) 7.32 0.75 (0.07) 10.02
COWAT Total Correct 0.56 (0.12) 4.70 0.76 (0.07) 9.74
Animal Naming Total Correct 0.66 (0.11) 5.78 0.84 (0.05) 7.96
Verbal knowledge WAIS-R Vocabulary Raw 0.86 (0.11) 7.74 0.85 (0.06) 14.43
WAIS-R Comprehension Raw 0.68 (0.12) 5.78 0.81 (0.06) 13.58
WAIS-R Similarities Raw 0.65 (0.12) 5.52 0.80 (0.06) 13.31
Non-verbal functions WAIS-R Block Design Raw 0.70 (0.11) 6.18 0.79 (0.06) 12.62
WAIS-R Picture Completion Raw 0.64 (0.12) 5.51 0.72 (0.06) 11.24
WAIS-R Picture Arrangement Raw 0.73 (0.11) 6.43 0.74 (0.06) 11.64
Learning WMS-R Verbal Paired Association I 0.61 (0.12) 5.19 0.75 (0.06) 11.87
WMS-R Verbal Paired Association II 0.76 (0.11) 6.97 0.74 (0.06) 11.58
WMS-R Visual Paired Association I 0.78 (0.11) 7.18 0.74 (0.06) 11.63
WMS-R Visual Paired Association II 0.68 (0.11) 5.95 0.72 (0.06) 11.15
D2 ¼ Concentration Endurance Test; Stroop ¼ Stroop Color-Word Interference Test; LNS ¼ Letter Number Span Test; LMI ¼ Logical
Memory (immediate recall); WAIS-R ¼ Wechsler Adult Intelligence Scale-Revised; WMS-R ¼ Wechsler Memory Scale Revised;
COWAT ¼ Controlled Oral Word Association Test.
*p < 0.05 for all values in the column.
81
12. Czobor et al.
(i.e., not including D2 Fluctuations and LMI) since loadings derived in the BPD and the SZ samples,
this set provided a closer fit to the empirical data. respectively, for all factors except for Ideational
Fluency. An inspection of Fig. 3 indicates that this
relative lack of congruence for this factor is due to
Procrustes matching
the fact that, in the BPD sample, only 2 of the
As described in the Methods, confirmatory Pro- constituting items whereas in the SZ sample all 3 of
crustes rotation was applied to investigate the the items reached saliency (in particular, in the
extent of congruence between the factor structures bipolar sample, the loading for the Ruff Figural
derived in the bipolar and the SZ sample. This Fluency Unique Designs was close to zero).
method is suitable for maximizing the similarity As mentioned before, approximately 26% of the
between a matrix of factor loadings and an sample in the ÔSchizophrenia StudyÕ was diagnosed
assumed underlying structure by means of the- with schizoaffective disorder, and 11% in the
ory-based expectations as targets. Unlike the CFA, ÔBipolar StudyÕ evidenced some symptoms of
the Procrustes approach estimates for each factor Delusions or Hallucinations. Inclusion of these
the loadings for all variables used in the analysis subjects in the analyses increased diagnostic het-
(including items that are considered non-salient for erogeneity and phenomenological overlap across
a particular factor). For the purpose of the current diagnoses, which may have served as a major
study, the Procrustes analysis used the theoretically contributing factor to the similarity of the factor
postulated target structure based on the factor structures across diagnoses. To investigate this
structure derived in the final factor model from the possibility further, in additional secondary analy-
CFA analyses. Similar to our previous analysis, the ses, we excluded the aforementioned subjects, and
factor analysis was based on the principal compo- recomputed the coefficient of congruence for the
nent method, and the PROMAX approach was factor structure across diagnoses. Results indicated
used to allow for correlation among the 6 NC that the 6 NC factors were replicable with the more
factors. homogeneous samples; the values of CC remained
Table 6 displays the estimated coefficients of almost unchanged between the 2 diagnostic sam-
congruence between the corresponding factor pairs ples (Attention ¼ 0.863, Working Memory ¼
from the BPD and the SZ samples, respectively. As 0.805, Ideational Fluency ¼ 0.601, Verbal Knowl-
shown in Table 6, for 5 of the 6 factors including edge ¼ 0.797, Non-Verbal Functions ¼ 0.821 and
Attention, Working Memory, Verbal Knowledge, Learning ¼ 0.890).
Non-Verbal Functions, and Learning, there was a
high level of similarity between the set of loadings
Reliability, validity
derived in the BPD and the SZ samples, respec-
tively. For 1 of the factors (Ideational Fluency), the Construct reliability. Table 7 displays the Cronbach
congruence was moderate. alpha estimate (measuring internal consistency) for
The factor loading estimates yielded by the each factor in each of the 2 samples. As Table 7
Procrustes analysis are depicted in Figs 1–6 for shows, the internal consistency for the individual
each of the 6 NC factors, respectively. Consistent factors was generally good, with the exception of
with coefficient of congruence estimates, Figs 1–6 the Ideational Fluency factor for which the
indicate a good correspondence between the set of internal consistency estimate in each sample was
Table 6. Coefficient of congruence (CC) between factors derived in the
only of moderate magnitude. Overall, no meaningful
bipolar and the schizophrenia samplea differences were observed between the 2 samples in
terms of construct reliability of the 6 NC factors.
95% Confidence
limitsb
Observed Convergent validity. For convergent validity, we
Factor CC value Lower Upper examined the degree to which the NC factors
provided convergent information with measures
Attention 0.883 0.787 0.979
that they would theoretically be expected to be
Working memory 0.878 0.794 0.962
Ideational fluency 0.658 0.467 0.850 overlapping. The analyses focused on 2 items of the
Verbal knowledge 0.818 0.704 0.932 CARS-M, including ÔDistractibilityÕ (Item 6) and
Non-verbal functions 0.837 0.675 0.999 ÔDisordered ThinkingÕ (Item 11). In particular,
Learning 0.903 0.813 0.993 association between the above 2 items (i.e., Dis-
a tractibility, Disordered Thinking) and the 6 NC
Factor analysis was based on the PROMAX method using
Procrustes rotation. factors, respectively, was examined by logistic
b
Bootstrap/resampling estimates, based on 1,000 samples regression analysis. Results of the logistic regres-
drawn randomly from the original observed dataset. sions analyses are shown in Table 8.
82
13. Neuropsychological symptom dimensions
Attention factor
1.00
Factor loadings
0.50
0.00
D2 Lett.-Error
Stroop, Words
Stroop, Colors
Trails A, Time
Digit Symbol
Digit Sp. Forw.
LNS, Correct
LNS, Longest
Arithmetic
Digit Sp. Back.
Ruff Uniq.Des.
COWAT Total
Anim. Naming
WAIS Vocab.
WAIS Compr.
WAIS Similar.
WAIS Block D.
WAIS Pict.Cp.
WAIS Pict.Arr.
Verb. Paired I
Verb. Paired II
Visual Paired I
Visual Paired lI
Bipolar
SCH/SCA
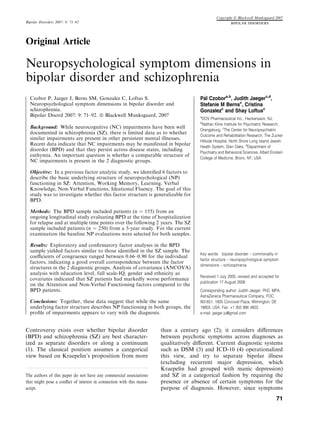
Fig. 1. Attention: comparison of factor loadings obtained in the bipolar and schizophrenia samples. The factor analysis was based on
the principal component method applying Procrustes rotation. Factors from the 2 samples were matched (paired) on the basis of their
congruence. On the horizontal axis, individual neuropsychological variables entering the factor analysis were grouped according to
the 6 factors identified on the basis of previous study (28).
D2 ¼ Concentration Endurance Test; Stroop ¼ Stroop Color-Word Interference Test; LNS ¼ Letter Number Span Test;
COWAT ¼ Controlled Oral Word Association Test; WAIS ¼ Wechsler Adult Intelligence Scale.
Working memory factor
1.00
0.50
Factor loadings
0.00
D2 Lett.-Error
Stroop, Words
Stroop, Colors
Trails A, Time
Digit Symbol
Digit Sp. Forw.
LNS, Correct
LNS, Longest
Arithmetic
Digit Sp. Back.
Ruff Uniq.Des.
COWAT Total
Anim. Naming
WAIS Vocab.
WAIS Compr.
WAIS Similar.
WAIS Block D.
WAIS Pict.Cp.
WAIS Pict.Arr.
Verb. Paired I
Verb. Paired II
Visual Paired I
Visual Paired lI
Bipolar
SCH/SCA
Fig. 2. Working memory: comparison of factor loadings obtained in the bipolar and schizophrenia samples. See Fig. 1 for complete
description and abbreviations.
As Table 8 indicates, the clinical rating of tions. The association did not reach significance for
Distractibility was associated with poorer func- Learning.
tioning on the Attention and Non-Verbal Func-
tions factors (and to a lesser extent on Learning). Discriminant validity. For discriminant validity,
As expected, the largest effect size was observed for we investigated the degree to which the 6 NC
the association with the Attention factor. Disor- factors overlapped with psychometric ratings. In
dered Thinking had a more general relationship particular, discriminant validity was examined via
with NC functioning, as indexed by the NC bivariate correlations between the neurocognitive
factors. In particular, a statistically significant factors and the overall severity score of clinical
association was observed for 5 of the 6 factors symptoms, indexing mania (total score on the
including Attention, Working Memory, Ideational CARS-M scale) and depression (total score on
Fluency, Verbal Knowledge, Non-Verbal Func- HAM-D scale, 17-item version), respectively.
83