#migrantsfiles international
•
0 gefällt mir•939 views

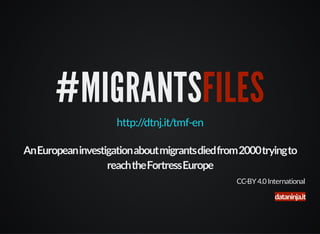
#MigrantsFiles: the European investigation on 23,000 migrants died from 2000 to 2013 trying to reach Europe.

Empfohlen
Empfohlen
Weitere ähnliche Inhalte
Ähnlich wie #migrantsfiles international
Ähnlich wie #migrantsfiles international (20)
Mehr von Dataninja
Mehr von Dataninja (20)
Kürzlich hochgeladen
Kürzlich hochgeladen (20)
#migrantsfiles international
- 1. #MIGRANTSFILES http://dtnj.it/tmf-en CC-BY 4.0 International
- 2. DATANINJA.IT / ABOUT US Dataninja is a data journalism network founded in 2012 Our aim is to tell stories from data analysis, the so-called We deal with journalism and teaching together with the main Italian editorial groups and the more advanced public administrations on Open Data topics.
- 3. THE CONTEXT: INFORMATIONS ON THE WEB From the dawn of civilization until 2003, humankind generated five exabytes of data. Now we produce five exabytes every two days… and the pace is accelerating! Eric Schmidt , Google’s executive chairman | http://goo.gl/pgle3G
- 4. WHY DATA VISUALIZATION? As it had never happened in our lives, today we have access to tons of free information and for free. With the right tools we can begin to make sense of these data to see patterns and trends that otherwise would be invisible to us. Transforming numbers in graphic form allows readers to learn about the stories that those numbers hiding. Alberto Cairo, "The functional Art" | Source: http://goo.gl/KHm3hT
- 5. THE INVESTIGATION OF L'ESPRESSO simultaneously on 9 newspapers in six European countries in March 31, 2014
- 6. THE NEWS FROM 2000 TO 2013 MORE THAN 23 THOUSANDS OF MIGRANTS HAVE DIED TRYING TO REACH EUROPE
- 7. ROUTES EIGHT ROUTES OF ENTRY
- 8. ROUTES MORTALITY It was possible to estimate a mortality rate of each route: calculation shows that the most critical one starts from the Maghreb towards Sicily
- 9. 1. DATA
- 10. INVESTIGATION BASIS official monitoring for victims (neither by Italy, nor by European Union) Two EU agencies monitor frontiers (Frontex, Eurosur) datasets based on articles and posts from media, observatories and blogs built by NGOs (Fortress Europe, United for Intercultural Action, PULS dell'università di Helsinki) studies and analysis regarding specific territories (Sicilia, Canarie) or time intervals (a single year, a season)
- 11. FORTRESS EUROPE scraped data from the Fortress Europe website.
- 12. UNITED FOR INTERCULTURAL ACTION / PULS scraped and collected data from United for Intercultural Action e PULS websites
- 13. SCRAPING / MERGING / DEDUPLICATION These are all activities necessary to extract data from their original rigid containers (web pages and PDFs), to structure them as tables and so to make them machine readable Original different structures are adapted to have a single useful one (date / location / description / source / ... ) We have finally aggregated all data in a single table and cleaned it deleting double events thanks to a semi automatic deduplication process
- 14. NEW DATABASE It contains 2700+ events (during which 23000+ migrants died from 2000 to 2013) and it is browsable http://themigrantsfiles.com
- 15. ENTITY EXTRACTION Single events (ie. shipwrecks) are put in relations by extracting entities (ie. events' typologies, locations, victims' types) Link: http://goo.gl/xy0h0Q
- 16. 2. TEAM
- 17. TEAM PLAY The investigation was performed by 10 people among journalists, data scientists, developers and more, thanks to an on-line shared platform.
- 18. ROLES AND METHODOLOGY A coordinated the whole process and checked progress searched for data and contextual informations and fact checked them, also with a sample testing strategy (fact-checking ) tried to provide an error estimation of the data manipulation process (about )
- 19. METHODOLOGY ON L'ESPRESSO Below the article published on L'Espresso there is also a methodological note with contacts | Link: http://goo.gl/9gpvlA
- 20. FACT-CHECKING AT THE UNIVERSITY Some students in digital journalism at the University of Bologna helped us to check single events (thanks to prof. Carlo Gubitosa)
- 21. 3. RESULTS
- 22. MARCH 31, 2014: THE PUBLICATION DAY The investigation was published simultaneously on 9 newspapers from 6 different European countries, creating a widespread distribution in each country
- 23. IMPACT During 24h, 2000+ tweets in 11 different languages are sent Mainly English, French, Italian, German, Spanish and Greek | http://goo.gl/cTZyqq
- 24. AWARDS: BRUSSELS AND BARCELONA The investigation was presented at the DataHarvest+ Conference in Brussels and won the Data Journalism Awards in Barcelona (June 2014)