2. at xϭ0, the wave function may have a noncontinuous deriva-
tive. By integrating the Schro¨dinger equation in a neighbor-
hood of the origin, the derivative difference is6
ប2
2m
͓⌽2Ј͑0͒Ϫ⌽1Ј͑0͔͒ϩ␣⌽͑0͒ϭ0, ͑1͒
where, as shown in Fig. 4, ␣ represents the strength of the ␦
function at the origin, and is, for a thin layer, the product of
the potential well and its spatial extension.
We are interested in charge accumulation at the interface.
Then, we look for electron bound eigenstates. These eigen-
states ͑in this particular problem there is only one͒ must have
negative total energy E. If they did not, they would be delo-
calized states. As in the case of transmission and reflection
through a potential step, if 0ϽEϽV0 then the electron is
delocalized for xϽ0 and confined within a small region for
xϾ0. If, on the other hand, V0ϽE, then the electron state is
delocalized for all x. In the case of a potential step ͑that is,
our problem with ␣ϭ0͒, there cannot be states completely
confined around xϭ0, since for EϽ0 the only solution to the
Schro¨dinger equation would be ⌽ϵ0. However, nontrivial
solutions can exist when ␣ 0. Thus we search for exponen-
tial solutions decaying away from the origin and with
EϽ0:
⌽1͑x͒ϭAex
, ͑2͒
⌽2͑x͒ϭAeϪx
, ͑3͒
EϭϪ
ប2
2
2m
, ͑4͒
EϭVϪ
ប2
2
2m
, ͑5͒
where and are real constants.
We next define a new parameter, , to simplify the nota-
tion:
ϭͱ2mV
ប2 sinh , ͑6͒
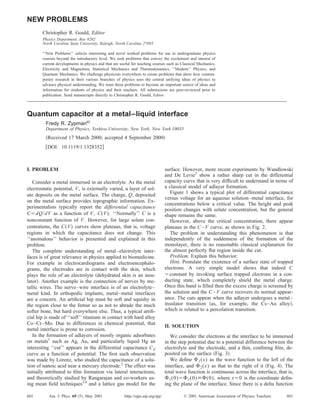
Fig. 1. Typical differential interfacial capacitance of mercury in contact
with aqueous solution of guanidinium nitrate for concentrations below
0.3 M.
Fig. 2. Typical differential interfacial capacitance of mercury in contact
with aqueous solution of guanidinium nitrate for concentrations above
0.3 M.
Fig. 3. Diagram of the system show-
ing the metal, the electrolyte, the thin
layer, and the electron wave function.
602 602Am. J. Phys., Vol. 69, No. 5, May 2001 New Problems
3. ϭͱ2mV
ប2 cosh . ͑7͒
From these definitions and Eqs. ͑4͒ and ͑5͒, one obtains the
state given by
ϭ
1
2
log
2m␣2
ប2
V
. ͑8͒
Let Q1 and Q2 be the net charges to the left and to the
right of the interface, respectively.
Then
Q1ϭe ͵Ϫϱ
0
͉⌽1͑x͉͒2
dxϭ
eA2
2
, ͑9͒
where the normalization constant A is obtained by requiring
that
͵Ϫϱ
0
͉⌽1͑x͉͒2
dxϩ ͵0
ϩϱ
͉⌽2͑x͉͒2
dxϭ1:
A2
ϭ2
V
␣
cosh  sinh . ͑10͒
In the previous expression, we have made use of the fact
that Eq. ͑1͒ is equivalent to ϩϭ2ma/ប2
.
Then
Q1ϭ
e
ϩ
. ͑11͒
And, similarly
Q2ϭ
e
ϩ
. ͑12͒
The charge at the interface capacitor can now be evaluated
QcϭQ1ϪQ2ϭe
Ϫ
ϩ
ϭe
ប2
V
2m␣2 . ͑13͒
The capacitance, CϭdQc /dV, is
Cϭ
eប2
2m␣2 , ͑14͒
which is a constant that depends only on the properties of the
layer through the parameter ␣.
Thus by simply adding a small confining layer at the in-
terface, it is possible to explain the flat characteristics of the
total capacitance. As the external voltage in the electrolytic
cell changes, the thin layer may appear or disappear, thus
creating ‘‘normal’’ C–V regions, and flat ones.
ACKNOWLEDGMENTS
I would like to thank Dr. Steven J. Eppell and Dr. Lesser
Blum for useful comments. The National Cancer Institute
through Grant No. CA77796-01 has financially supported
this work.
a͒
Electronic mail: zypman@ymail.yu.edu
1
E. Budevski, G. Staikov, and W. J. Lorenz, Electrochemical Phase For-
mation and Growth ͑Wiley, New York, 1996͒, pp. 200–210.
2
Wolfgang Lorenz, ‘‘The rate of absorption and of two-dimensional asso-
ciation of fatty acids at the mercury-electrolyte interface,’’ Z. Elektro-
chem. 62 ͑1͒, 192–199 ͑1958͒.
3
M. V. Sangaranarayanan and S. K. Rangarajan, ‘‘Adsorption-isotherms for
neutral organic-compounds—A hierarchy in modeling,’’ J. Electroanal.
Chem. Interfacial Electrochem. 176 ͑1-2͒, 45–64 ͑1984͒.
4
M. V. Sangaranarayanan and S. K. Rangarajan, ‘‘Adsorption-isotherms—
microscopic modeling,’’ J. Electroanal. Chem. Interfacial Electrochem.
176 ͑1-2͒, 119–137 ͑1984͒.
5
T. Wandlowski, G. Jameson, and R. De Levie, ‘‘Two-Dimensional Con-
densation of Guadinidium Nitrate at the Mercury-Water Interface,’’ J.
Phys. Chem. 97 ͑39͒, 10119–10126 ͑1993͒.
6
C. Cohen-Tannoudji, Bernard Diu, and Frank Laloe¨, Quantum Mechanics
͑Wiley, New York, Paris, 1977͒, Vol. 1, p. 87.
Fig. 4. Potential function representing
the metal, the interface, and the elec-
trolyte.
603 603Am. J. Phys., Vol. 69, No. 5, May 2001 New Problems
5. eliminating the absorption at the resonance frequency and
therefore creating electromagnetically induced transparency,
as shown in the problems given here.
II. PROBLEMS
A. Coherent population trapping
The key to keeping the group velocity at the vicinity of a
resonance frequency meaningful lies in the properties of the
laser-dressed atomic cloud. Without such an effect, absorp-
tion would be too strong to have any transmitted light.
Consider that each atom in the medium has three levels.
The presence of a coupling ͑dressing͒ laser (cӍ2Ϫ1)
and a probe laser (Ӎ2Ϫ0) causes a mixing of the three
levels, ͉0͘, ͉1͘, and ͉2͘.
The Hamiltonian of such a system is
HϭH0ϩH1 . ͑11͒
Here the unperturbed Hamiltonian H0 is given by
͗l͉H0͉lЈ͘ϭបl␦llЈ , ͑12͒
with l, lЈϭ0,1, 2. The perturbation H1 is restricted to be
͗l͉H1͉lЈ͘ϭ͗lЈ͉H1͉l͘*ϭប⍀llЈeϪillЈt
, ͑13͒
with llЈϭlϪlЈ and ⍀llϭ⍀01ϭ⍀10ϭ0. Note that 2
Ͼ1Ͼ0ϭ0 and l0ϭl . This is a so-called ‘‘⌳’’ system
with the highest level coupled to two lower levels.
For the Hamiltonian given, find the time-dependent wave
function
͉͑t͒͘ϭ͚lϭ0
2
cl͑t͉͒l͘, ͑14͒
if ͉(0)͘ϭc0(0)͉0͘ϩc1(0)͉1͘ with ͉c0(0)͉2
ϩ͉c1(0)͉2
ϭ1.
Discuss the condition for c2(t)ϵ0 and its implication.
B. Electromagnetically induced transparency
If we define a density matrix
͑t͒ϭ͉͑t͒͗͑͘t͉͒, ͑15͒
whose diagonal elements are the probabilities of occupying
specific states and off-diagonal elements represent the tran-
sition rates between two given states, we have
iប
ץ
ץt
ϭ͓H,͔, ͑16͒
from the Schro¨dinger equation. The interactions between at-
oms in the cloud can cause a finite linewidth and decay of
each level, which can be accounted for by a relaxation ma-
trix:
͗l͉⌫͉lЈ͘ϭ2␥l␦llЈ , ͑17͒
and change Eq. ͑16͒ into
iប
ץ
ץt
ϭ͓H,͔Ϫ
iប
2
͑⌫ϩ⌫͒. ͑18͒
Assuming that only the dominant decaying factor is nonzero,
that is, ␥2ϭ␥ and ␥0,1ϭ0, and that the atom is in the ground
state at tϭ0, show that
⑀͑͒ϭ⑀0ͫ1ϩ
d͑Ϫ2͒
R
2
/4Ϫ͑Ϫ2͒2
Ϫi␥͑Ϫ2͒ͬ, ͑19͒
where dϭna͉p20͉2
/ប⑀0 with ͉p20͉ being the coupling dipole
strength between ͉2͘ and ͉0͘ and Rϭ2͉⍀21͉ the Rabi angu-
lar frequency between ͉2͘ and ͉1͘.
C. The slowest light
In the recent experiment, Hau and co-workers have suc-
cessfully reduced the group velocity of light in a cold, laser-
dressed sodium atom cloud to 1 mile per hour ͑0.45 m/s͒.1
Each sodium atom can be approximated well by a three-level
system. Assume that the permittivity of such a laser-dressed
atom cloud is given by Eq. ͑19͒ and the frequency of the
probe laser (/2) is near the resonance frequency ͑2/2
Ӎ5.1ϫ1014
Hz for sodium atom͒. Estimate the number den-
sity of the atom cloud needed in order to have vg
Ӎ0.45 m/s. Assume that the Rabi angular frequency is about
Rϭ3.5ϫ107
rad/s and the coupling dipole strength is about
͉p20͉Ӎ2.5ϫ10Ϫ29
C m.
III. SOLUTIONS
A. Coherent population trapping
From the time-dependent Schro¨dinger equation
iប
ץ͉͑t͒͘
ץt
ϭH͉͑t͒͘, ͑20͒
we have
ic˙0͑t͒ϭ0c0͑t͒ϩ⍀20ei2t
c2͑t͒, ͑21͒
ic˙1͑t͒ϭ1c1͑t͒ϩ⍀21ei21t
c2͑t͒, ͑22͒
ic˙2͑t͒ϭ2c2͑t͒ϩ⍀02eϪi2t
c0͑t͒ϩ⍀12eϪi21t
c1͑t͒.
͑23͒
If we redefine the coefficients by
cl͑t͒ϭeϪilt
bl͑t͒, ͑24͒
the equation set is simplified to
ib˙ 0͑t͒ϭ⍀20b2͑t͒, ͑25͒
ib˙ 1͑t͒ϭ⍀21b2͑t͒, ͑26͒
ib˙ 2͑t͒ϭ⍀02b0͑t͒ϩ⍀12b1͑t͒. ͑27͒
Multiplying Eq. ͑25͒ with ⍀02 and Eq. ͑26͒ with ⍀12 and
adding them together, and substituting the resulting equation
into Eq. ͑27͒ after taking one more time derivative, we ob-
tain
b¨ 2͑t͒ϭϪ͉͑⍀20͉2
ϩ͉⍀21͉2
͒b2͑t͒. ͑28͒
We have used ⍀02ϭ⍀20* and ⍀12ϭ⍀21* . So we have
b2͑t͒ϭAei⍀t
ϩBeϪi⍀t
, ͑29͒
with ⍀ϭͱ͉⍀20͉2
ϩ͉⍀21͉2
. Taking the initial condition
b2(0)ϭc2(0)ϭ0, we arrive at
b2͑t͒ϭC sin ⍀t, ͑30͒
with C being a constant. Substituting this result back into
Eqs. ͑25͒ and ͑26͒, we have
b0͑t͒ϭ͓c0͑0͒Ϫ␣͔cos ⍀tϩ␣, ͑31͒
b1͑t͒ϭ͓c1͑0͒Ϫ͔cos ⍀tϩ, ͑32͒
where ␣ and  are constants constrained by
605 605Am. J. Phys., Vol. 69, No. 5, May 2001 New Problems
6. ⍀02␣ϩ⍀12ϭ0. ͑33͒
We have used the initial conditions b0(0)ϭc0(0) and
b1(0)ϭc1(0). The coefficient C is given by
Cϭ
i
⍀
͓⍀02c0͑0͒ϩ⍀12c1͑0͔͒. ͑34͒
If c0(0) and c1(0) are such that Cϵ0, we have c2(t)ϵ0 all
the time. A typical case is ͉⍀02͉ϭ͉⍀12͉ and ͉c0(0)͉
ϭ͉c1(0)͉ϭ1/&, with the total phase difference between the
two terms being . So the state ͉2͘ will stay empty and the
atoms are trapped in the lower states. The effect of such a
coherent population trapping is that the absorption or emis-
sion of light is completely eliminated.
B. Electromagnetically induced transparency
Consider that the traveling ͑probing͒ laser is described by
a time-dependent electric field E(t)ϭE0eϪit
with very
close to 2 . The perturbation from such a field is
͗2͉H1͉0͘ϭϪ͗2͉p͉0͘E0eϪit
ϭប⍀20eϪit
, ͑35͒
where p is the dipole moment induced by the field. Now if
we examine the density matrix elements between two states,
llЈϭ͗l͉͉lЈ͘, we have
i
ץ20
ץt
ϭ͑2Ϫi␥͒20ϩ⍀21eϪi21t
10
ϩ⍀20eϪit
͑00Ϫ22͒, ͑36͒
i
ץ10
ץt
ϭ110ϩ⍀12eϪi12t
20Ϫ⍀20eϪi2t
12 . ͑37͒
We have used
͚lϭ0
2
͉l͗͘l͉ϭ1 ͑38͒
in deriving the above equations. We can then replace 00 ,
22 , and 12 by their values at tϭ0, that is, 00ϭ1, 22ϭ0,
and 12ϭ0, and change a variable with 10ϭ10eϪi21t
, be-
cause we are only looking for the linear solution. Then we
have
i
ץ20
ץt
ϭ͑2Ϫi␥͒20ϩ⍀2110ϩ⍀20eϪit
, ͑39͒
i
ץ10
ץt
ϭ210ϩ⍀1220 . ͑40͒
This equation set resembles a harmonic oscillator under
damping and driving forces. The steady solutions are there-
fore given by
20͑t͒ϭAeϪit
, ͑41͒
10͑t͒ϭBeϪit
. ͑42͒
Substituting the above solutions into the equations, we obtain
Aϭ
⍀20͑Ϫ2͒
͑Ϫ2ϩi␥͒͑Ϫ2͒Ϫ͉⍀21͉2 . ͑43͒
Because 20 represents the dipole transition rate between ͉2͘
and 0͘, the polarization of the system is given by P
ϭna20p02ϭ(⑀Ϫ⑀0)E(t) with p02ϭ͗0͉p͉2͘ϭp20* . Then we
reach Eq. ͑19͒.
C. The slowest light
We know that the group velocity is given by
vgϭ
d
dk
ϭ
c
nϩ͑dn/d͒
. ͑44͒
For all known materials, nϳO(1). So if vgӶc, we must
have
vgӍ
c
͑dn/d͒
. ͑45͒
For vgϭ0.45 m/s, as observed in the experiment by Hau’s
group,1
one must have
͑dn/d͒Ӎ6.7ϫ108
. ͑46͒
From the given permittivity, we have
nϩi
c␣
2
Ӎ1ϩ
1
2
d͑Ϫ2͒
R
2
/4Ϫ͑Ϫ2͒2
Ϫi␥͑Ϫ2͒
. ͑47͒
Considering that is very close to 2 , we have
nϩi
c␣
2
Ӎ1ϩ
2d͑Ϫ2͒
R
2
ϫͫ1ϩ
4͑Ϫ2͒2
R
2 ϩ
i4␥͑Ϫ2͒
R
2 ϩ¯ͬ,
͑48͒
which gives
͑dn/d͒Ӎ
2
ប⑀0
na͉p20͉2
R
2 . ͑49͒
We have used dϭna͉p20͉2
/ប⑀0 . With the numerical values
of the quantities given, we then obtain naӍ2ϫ1020
mϪ3
, a
density quite difficult to achieve experimentally.
Note that the absorption coefficient ␣ is zero at the reso-
nance frequency. This is the essence of the electromagneti-
cally induced transparency, a condition that must be met in
order to have a significant light transmission at the resonance
frequency. Otherwise, the drastically slowed group velocity
of light observed by Hau’s group would not have been pos-
sible.
a͒
Electronic mail: pang@nevada.edu
1
L. V. Hau, presentation at the American Association for the Advancement
of Science, February 2000, Washington, DC.
2
L. V. Hau, S. E. Harris, Z. Dutton, and C. H. Behroozi, ‘‘Light speed
reduction to 17 meters per second in an ultracold atomic gas,’’ Nature
͑London͒ 397, 594–598 ͑1999͒.
3
For a recent review, see R. Y. Chiao and A. M. Steinberg, Tunneling
Times and Superluminality, Progress in Optics Vol. 37, edited by E. Wolf
͑Elsevier, Amsterdam, 1997͒, pp. 347–405.
4
A. Kasapi, M. Jain, G. Y. Yin, and S. E. Harris, ‘‘Electromagnetically
introduced transparency: Propagation dynamics,’’ Phys. Rev. Lett. 74,
2447–2450 ͑1995͒.
5
S. E. Harris, ‘‘Electromagnetically induced transparency,’’ Phys. Today
50 ͑7͒, 36–42 ͑1997͒.
6
M. O. Scully and M. S. Zubairy, Quantum Optics ͑Cambridge U.P., Cam-
bridge, 1997͒, Secs. 7.2 and 7.3.
7
D. J. Jackson, Classical Electrodynamics ͑Wiley, New York, 1999͒, 3rd
ed., Secs. 7.5 and 7.8.
606 606Am. J. Phys., Vol. 69, No. 5, May 2001 New Problems
8. law11
͑since tϭsinϪ1
͓(ni /nt)sin i͔ can be in either the first
or second quadrant͒, but they seemed physically implausible
and the topic was largely dropped.
Present interest in negative group velocity is based on
anomalous dispersion in a gain medium, where the sign of
the phase velocity is the same for incident and transmitted
waves, and energy flows inside the gain medium in the op-
posite direction to the incident energy flow in vacuum.
The propagation of electromagnetic waves at frequencies
near those of spectral lines of a medium was first extensively
discussed by Sommerfeld and Brillouin,12
with emphasis on
the distinction between signal velocity and group velocity
when the latter exceeds c. The solution presented here is
based on the work of Garrett and McCumber,13
as extended
by Chiao et al.14,15
A discussion of negative group velocity
in electronic circuits has been given by Mitchell and Chiao.16
A. Negative group velocity
In a medium of index of refraction n(), the dispersion
relation can be written
kϭ
n
c
, ͑2͒
where k is the wave number. The group velocity is then
given by
vgϭReͫd
dk ͬϭ
1
Re͓dk/d͔
ϭ
c
Re͓d͑n͒/d͔
ϭ
c
nϩ Re͓dn/d͔
.
͑3͒
We see from Eq. ͑3͒ that if the index of refraction de-
creases rapidly enough with frequency, the group velocity
can be negative. It is well known that the index of refraction
decreases rapidly with frequency near an absorption line,
where ‘‘anomalous’’ wave propagation effects can occur.12
However, the absorption makes it difficult to study these
effects. The insight of Garrett and McCumber13
and of Chiao
et al.14,15,17–19
is that demonstrations of negative group ve-
locity are possible in media with inverted populations, so
that gain rather than absorption occurs at the frequencies of
interest. This was dramatically realized in the experiment of
Wang et al.4
by use of a closely spaced pair of gain lines, as
perhaps first suggested by Steinberg and Chiao.17
We use a classical oscillator model for the index of refrac-
tion. The index n is the square root of the dielectric constant
⑀, which is in turn related to the atomic polarizability ␣ ac-
cording to
Dϭ⑀EϭEϩ4PϭE͑1ϩ4N␣͒ ͑4͒
͑in Gaussian units͒, where D is the electric displacement, E is
the electric field, and P is the polarization density. Then, the
index of refraction of a dilute gas is
nϭͱ⑀Ϸ1ϩ2N␣. ͑5͒
The polarizability ␣ is obtained from the electric dipole
moment pϭexϭ␣E induced by electric field E. In the case
of a single spectral line of frequency j , we say that an
electron is bound to the ͑fixed͒ nucleus by a spring of con-
stant Kϭmj
2
, and that the motion is subject to the damping
force Ϫm␥jx˙, where the dot indicates differentiation with
respect to time. The equation of motion in the presence of an
electromagnetic wave of frequency is
x¨ϩ␥jx˙ϩj
2
xϭ
eE
m
ϭ
eE0
m
eit
. ͑6͒
Hence,
xϭ
eE
m
1
j
2
Ϫ2
Ϫi␥j
ϭ
eE
m
j
2
Ϫ2
ϩi␥j
͑j
2
Ϫ2
͒2
ϩ␥j
2
2 , ͑7͒
and the polarizability is
␣ϭ
e2
m
j
2
Ϫ2
ϩi␥j
͑j
2
Ϫ2
͒2
ϩ␥j
2
2 . ͑8͒
In the present problem we have two spectral lines, 1,2
ϭ0Ϯ⌬/2, both of oscillator strength Ϫ1 to indicate that the
populations of both lines are inverted, with damping con-
stants ␥1ϭ␥2ϭ␥. In this case, the polarizability is given by
␣ϭϪ
e2
m
͑0Ϫ⌬/2͒2
Ϫ2
ϩi␥
͑͑0Ϫ⌬/2͒2
Ϫ2
͒2
ϩ␥2
2
Ϫ
e2
m
͑0ϩ⌬/2͒2
Ϫ2
ϩi␥
͑͑0ϩ⌬/2͒2
Ϫ2
͒2
ϩ␥2
2
ϷϪ
e2
m
0
2
Ϫ⌬0Ϫ2
ϩi␥
͑0
2
Ϫ⌬0Ϫ2
͒2
ϩ␥2
2
Ϫ
e2
m
0
2
ϩ2⌬0Ϫ2
ϩi␥
͑0
2
ϩ⌬0Ϫ2
͒2
ϩ␥2
2 , ͑9͒
where the approximation is obtained by the neglect of terms
in ⌬2
compared to those in ⌬0 .
For a probe beam at frequency , the index of refraction
͑5͒ has the form
n͑͒Ϸ1Ϫ
p
2
2 ͫ 0
2
Ϫ⌬0Ϫ2
ϩi␥
͑0
2
Ϫ⌬0Ϫ2
͒2
ϩ␥2
2
ϩ
0
2
ϩ⌬0Ϫ2
ϩi␥
͑0
2
ϩ⌬0Ϫ2
͒2
ϩ␥2
2ͬ, ͑10͒
where p is the plasma frequency given by Eq. ͑1͒. This is
illustrated in Fig. 1.
The index at the central frequency 0 is
Fig. 1. The real and imaginary parts of the index of refraction in a medium
with two spectral lines that have been pumped to inverted populations. The
lines are separated by angular frequency ⌬ and have widths ␥ϭ0.4⌬.
608 608Am. J. Phys., Vol. 69, No. 5, May 2001 New Problems
9. n͑0͒Ϸ1Ϫi
p
2
␥
͑⌬2
ϩ␥2
͒0
Ϸ1Ϫi
p
2
⌬2
␥
0
, ͑11͒
where the second approximation holds when ␥Ӷ⌬. The
electric field of a continuous probe wave then propagates
according to
E͑z,t͒ϭei͑kzϪ0t͒
ϭei͑n͑0͒z/cϪt͒
Ϸez/͓⌬2c/␥͑2/p͔͒
ei0͑z/cϪt͒
. ͑12͒
From this we see that at frequency 0 the phase velocity is c,
and the medium has an amplitude gain length ⌬2
c/␥p
2
.
To obtain the group velocity ͑3͒ at frequency 0 , we need
the derivative
d͑n͒
d
ͯ0
Ϸ1Ϫ
2p
2
͑⌬2
Ϫ␥2
͒
͑⌬2
ϩ␥2
͒2 , ͑13͒
where we have neglected terms in ⌬ and ␥ compared to 0 .
From Eq. ͑3͒, we see that the group velocity can be negative
if
⌬2
p
2Ϫ
␥2
p
2 у
1
2 ͩ⌬2
p
2 ϩ
␥2
p
2 ͪ2
. ͑14͒
The boundary of the allowed region ͑14͒ in (⌬2
,␥2
) space is
a parabola whose axis is along the line ␥2
ϭϪ⌬2
, as shown
in Fig. 2. For the physical region ␥2
у0, the boundary is
given by
␥2
p
2 ϭͱ1ϩ4
⌬2
p
2Ϫ1Ϫ
⌬2
p
2 . ͑15͒
Thus, to have a negative group velocity, we must have
⌬р&p , ͑16͒
which limit is achieved when ␥ϭ0; the maximum value of ␥
is 0.5p when ⌬ϭ0.866p .
Near the boundary of the negative group velocity region,
͉vg͉ exceeds c, which alerts us to concerns of superluminal
behavior. However, as will be seen in the following sections,
the effect of a negative group velocity is more dramatic when
͉vg͉ is small rather than large.
The region of recent experimental interest is ␥Ӷ⌬Ӷp ,
for which Eqs. ͑3͒ and ͑13͒ predict that
vgϷϪ
c
2
⌬2
p
2 . ͑17͒
A value of vgϷϪc/310 as in the experiment of Wang cor-
responds to ⌬/pϷ1/12. In this case, the gain length
⌬2
c/␥p
2
was approximately 40 cm.
For later use we record the second derivative,
d2
͑n͒
d2 ͯ0
Ϸ8i
p
2
␥͑3⌬2
Ϫ␥2
͒
͑⌬2
ϩ␥2
͒3 Ϸ24i
p
2
⌬2
␥
⌬2 , ͑18͒
where the second approximation holds if ␥Ӷ⌬.
B. Propagation of a monochromatic plane wave
To illustrate the optical properties of a medium with nega-
tive group velocity, we consider the propagation of an elec-
tromagnetic wave through it. The medium extends from z
ϭ0 to a, and is surrounded by vacuum. Because the index of
refraction ͑10͒ is near unity in the frequency range of inter-
est, we ignore reflections at the boundaries of the medium.
A monochromatic plane wave of frequency and incident
from zϽ0 propagates with phase velocity c in vacuum. Its
electric field can be written
E͑z,t͒ϭE0eiz/c
eϪit
͑zϽ0͒. ͑19͒
Inside the medium this wave propagates with phase velocity
c/n() according to
E͑z,t͒ϭE0einz/c
eϪit
͑0ϽzϽa͒, ͑20͒
where the amplitude is unchanged since we neglect the small
reflection at the boundary zϭ0. When the wave emerges into
vacuum at zϭa, the phase velocity is again c, but it has
accumulated a phase lag of (/c)(nϪ1)a, and so appears as
E͑z,t͒ϭE0eia͑nϪ1͒/c
eiz/c
eϪit
ϭE0eian/c
eϪi͑tϪ͑zϪa͒/c͒
͑aϽz͒. ͑21͒
It is noteworthy that a monochromatic wave for zϾa has the
same form as that inside the medium if we make the
frequency-independent substitutions
z→a, t→tϪ
zϪa
c
. ͑22͒
Since an arbitrary waveform can be expressed in terms of
monochromatic plane waves via Fourier analysis, we can use
these substitutions to convert any wave in the region 0Ͻz
Ͻa to its continuation in the region aϽz.
A general relation can be deduced in the case where the
second and higher derivatives of n() are very small. We
can then write
n͑͒Ϸ0n͑0͒ϩ
c
vg
͑Ϫ0͒, ͑23͒
where vg is the group velocity for a pulse with central fre-
quency 0 . Using this in Eq. ͑20͒, we have
E͑z,t͒ϷE0ei0z͑n͑0͒/cϪ1/vg͒
eiz/vgeϪit
͑0ϽzϽa͒.
͑24͒
In this approximation, the Fourier component E(z) at fre-
quency of a wave inside the gain medium is related to that
of the incident wave by replacing the frequency dependence
Fig. 2. The allowed region ͑14͒ in (⌬2
,␥2
) space such that the group ve-
locity is negative.
609 609Am. J. Phys., Vol. 69, No. 5, May 2001 New Problems
10. eiz/c
by eiz/vg, i.e., by replacing z/c by z/vg , and multi-
plying by the frequency-independent phase factor
ei0z(n(0)/cϪ1/vg)
. Then, using transformation ͑22͒, the wave
that emerges into vacuum beyond the medium is
E͑z,t͒ϷE0ei0a͑n͑0͒/cϪ1/vg͒
ϫei͑z/cϪa͑1/cϪ1/vg͒͒
eϪit
͑aϽz͒. ͑25͒
The wave beyond the medium is related to the incident wave
by multiplying by a frequency-independent phase, and by
replacing z/c by z/cϪa(1/cϪ1/vg) in the frequency-
dependent part of the phase.
The effect of the medium on the wave as described by
Eqs. ͑24͒ and ͑25͒ has been called ‘‘rephasing.’’ 4
C. Fourier analysis and ‘‘rephasing’’
The transformations between the monochromatic incident
wave ͑19͒ and its continuation in and beyond the medium,
͑24͒ and ͑25͒, imply that an incident wave
E͑z,t͒ϭf͑z/cϪt͒ϭ ͵Ϫϱ
ϱ
E͑z͒eϪit
d ͑zϽ0͒, ͑26͒
whose Fourier components are given by
E͑z͒ϭ
1
2
͵Ϫϱ
ϱ
E͑z,t͒eit
dt, ͑27͒
propagates as
E͑z,t͒Ϸ
Ά
f͑z/cϪt͒ ͑zϽ0͒
ei0z͑n͑0͒/cϪ1/vg͒
f͑z/vgϪt͒ ͑0ϽzϽa͒
ei0a͑n͑0͒/cϪ1/vg͒
f͑z/cϪtϪa͑1/cϪ1/vg͒͒
͑aϽz͒.
͑28͒
An interpretation of Eq. ͑28͒ in terms of ‘‘rephasing’’ is as
follows. Fourier analysis tells us that the maximum ampli-
tude of a pulse made of waves of many frequencies, each of
the form E(z,t)ϭE0()ei()
ϭE0()ei(k()zϪtϩ0())
with E0у0, is determined by adding the amplitudes E0().
This maximum is achieved only if there exist points ͑z,t͒
such that all phases ͑͒ have the same value.
For example, we consider a pulse in the region zϽ0
whose maximum occurs when the phases of all component
frequencies vanish, as shown at the left of Fig. 3. Referring
to Eq. ͑19͒, we see that the peak occurs when zϭct. As
usual, we say that the group velocity of this wave is c in
vacuum.
Inside the medium, Eq. ͑24͒ describes the phases of the
components, which all have a common frequency-
independent phase 0z(n(0)/cϪ1/vg) at a given z, as well
as a frequency-dependent part (z/vgϪt). The peak of the
pulse occurs when all the frequency-dependent phases van-
ish; the overall frequency-independent phase does not affect
the pulse size. Thus, the peak of the pulse propagates within
the medium according to zϭvgt. The velocity of the peak is
vg , the group velocity of the medium, which can be nega-
tive.
The ‘‘rephasing’’ ͑24͒ within the medium changes the
wavelengths of the component waves. Typically the wave-
length increases, and by greater amounts at longer wave-
lengths. A longer time is required before the phases of the
waves all become the same at some point z inside the me-
dium, so in a normal medium the velocity of the peak ap-
pears to be slowed down. But in a negative group velocity
medium, wavelengths short compared to 0 are lengthened,
long waves are shortened, and the velocity of the peak ap-
pears to be reversed.
By a similar argument, Eq. ͑25͒ tells us that in the vacuum
region beyond the medium the peak of the pulse propagates
according to zϭctϩa(1/cϪ1/vg). The group velocity is
again c, but the ‘‘rephasing’’ within the medium results in a
shift of the position of the peak by the amount a(1/c
Ϫ1/vg). In a normal medium where 0Ͻvgрc the shift is
negative; the pulse appears to have been delayed during its
passage through the medium. But after a negative group ve-
locity medium, the pulse appears to have advanced!
This advance is possible because, in the Fourier view,
each component wave extends over all space, even if the
pulse appears to be restricted. The unusual ‘‘rephasing’’ in a
negative group velocity medium shifts the phases of the fre-
quency components of the wave train in the region ahead of
the nominal peak such that the phases all coincide, and a
peak is observed, at times earlier than expected at points
beyond the medium.
As shown in Fig. 3 and further illustrated in the examples
in the following, the ‘‘rephasing’’ can result in the simulta-
neous appearance of peaks in all three regions.
Fig. 3. A snapshot of three Fourier components of a pulse in the vicinity of a negative group velocity medium. The component at the central wavelength 0
is unaltered by the medium, but the wavelength of a longer wavelength component is shortened, and that of a shorter wavelength component is lengthened.
Then, even when the incident pulse has not yet reached the medium, there can be a point inside the medium at which all components have the same phase,
and a peak appears. Simultaneously, there can be a point in the vacuum region beyond the medium at which the Fourier components are again all in phase,
and a third peak appears. The peaks in the vacuum regions move with group velocity vgϭc, but the peak inside the medium moves with a negative group
velocity, shown as vgϭϪc/2. The phase velocity vp is c in vacuum, and close to c in the medium.
610 610Am. J. Phys., Vol. 69, No. 5, May 2001 New Problems
11. D. Propagation of a sharp wave front
To assess the effect of a medium with negative group ve-
locity on the propagation of a signal, we first consider a
waveform with a sharp front, as recommended by Sommer-
feld and Brillouin.12
As an extreme but convenient example, we take the inci-
dent pulse to be a Dirac delta function, E(z,t)ϭE0␦(z/c
Ϫt). Inserting this in Eq. ͑28͒, which is based on the linear
approximation ͑23͒, we find
E͑z,t͒Ϸ
Ά
E0␦͑z/cϪt͒ ͑zϽ0͒
E0ei0z͑n͑0͒/cϪ1/vg͒
␦͑z/vgϪt͒ ͑0ϽzϽa͒
E0ei0a͑n͑0͒/cϪ1/vg͒
␦͑z/cϪtϪa͑1/cϪ1/vg͒͒
͑aϽz͒.
͑29͒
According to Eq. ͑29͒, the delta-function pulse emerges
from the medium at zϭa at time tϭa/vg . If the group ve-
locity is negative, the pulse emerges from the medium before
it enters at tϭ0!
A sample history of ͑Gaussian͒ pulse propagation is illus-
trated in Fig. 4. Inside the negative group velocity medium,
an ͑anti͒pulse propagates backwards in space from zϭa at
time tϭa/vgϽ0 to zϭ0 at time tϭ0, at which point it ap-
pears to annihilate the incident pulse.
This behavior is analogous to barrier penetration by a rela-
tivistic electron20
in which an electron can emerge from the
far side of the barrier earlier than it hits the near side, if the
electron emission at the far side is accompanied by positron
emission, and the positron propagates within the barrier so as
to annihilate the incident electron at the near side. In the
Wheeler–Feynman view, this process involves only a single
electron which propagates backwards in time when inside
the barrier. In this spirit, we might say that pulses propagate
backwards in time ͑but forward in space͒ inside a negative
group velocity medium.
The Fourier components of the delta function are indepen-
dent of frequency, so the advanced appearance of the sharp
wave front as described by Eq. ͑29͒ can occur only for a gain
medium such that the index of refraction varies linearly at all
frequencies. If such a medium existed with negative slope
dn/d, then Eq. ͑29͒ would constitute superluminal signal
propagation.
However, from Fig. 1 we see that a linear approximation
to the index of refraction is reasonable in the negative group
velocity medium only for ͉Ϫ0͉Շ⌬/2. The sharpest wave
front that can be supported within this bandwidth has char-
acteristic rise time Ϸ1/⌬.
For the experiment of Wang et al. where ⌬/2Ϸ106
Hz,
an analysis based on Eq. ͑23͒ would be valid only for pulses
with տ0.1 s. Wang et al. used a pulse with Ϸ1 s,
close to the minimum value for which Eq. ͑23͒ is a reason-
able approximation.
Since a negative group velocity can only be experienced
over a limited bandwidth, very sharp wave fronts must be
excluded from the discussion of signal propagation. How-
ever, it is well known12
that great care must be taken when
discussing the signal velocity if the waveform is not sharp.
E. Propagation of a Gaussian pulse
We now consider a Gaussian pulse of temporal length
centered on frequency 0 ͑the carrier frequency͒, for which
the incident waveform is
Fig. 4. Ten ‘‘snapshots’’ of a Gaussian pulse as it traverses a negative group
velocity region (0ϽzϽ50), according to Eq. ͑31͒. The group velocity in the
gain medium is vgϭϪc/2, and c has been set to 1.
611 611Am. J. Phys., Vol. 69, No. 5, May 2001 New Problems
12. E͑z,t͒ϭE0eϪ͑z/cϪt͒2/22
ei0z/c
eϪi0t
͑zϽ0͒. ͑30͒
Inserting this in Eq. ͑28͒ we find
E͑z,t͒ϭ
Ά
E0eϪ͑z/cϪt͒2/22
ei0͑z/cϪt͒
͑zϽ0͒
E0eϪ͑z/vgϪt͒2/22
ei0͑n͑0͒z/cϪt͒
͑0ϽzϽa͒
E0ei0a͑n͑0͒Ϫ1͒/c
eϪ͑z/cϪa͑1/cϪ1/vg͒Ϫt͒2/22
ϫei0͑z/cϪt͒
͑aϽz͒.
͑31͒
The factor ei0a(n(0)Ϫ1)/c
in Eq. ͑31͒ for aϽz becomes
ep
2
␥a/⌬2c
using Eq. ͑11͒, and represents a small gain due to
traversing the negative group velocity medium. In the experi-
ment of Wang et al., this factor was only 1.16.
We have already noted in the previous section that the
linear approximation to n() is only good over a fre-
quency interval about 0 of order ⌬, and so Eq. ͑31͒ for the
pulse after the gain medium applies only for pulse widths
տ
1
⌬
. ͑32͒
Further constraints on the validity of Eq. ͑31͒ can be ob-
tained using the expansion of n() to second order. For
this, we repeat the derivation of Eq. ͑31͒ in slightly more
detail. The incident Gaussian pulse ͑30͒ has the Fourier de-
composition ͑27͒,
E͑z͒ϭ
ͱ2
E0eϪ2
͑Ϫ0͒2/2
eiz/c
͑zϽ0͒. ͑33͒
We again extrapolate the Fourier component at frequency
into the region zϾ0 using Eq. ͑20͒, which yields
E͑z͒ϭ
ͱ2
E0eϪ2
͑Ϫ0͒2/2
einz/c
͑0ϽzϽa͒. ͑34͒
We now approximate the factor n() by its Taylor ex-
pansion through second order:
n͑͒Ϸ0n͑0͒ϩ
c
vg
͑Ϫ0͒
ϩ
1
2
d2
͑n͒
d2 ͯ0
͑Ϫ0͒2
. ͑35͒
With this, we find from Eqs. ͑26͒ and ͑34͒ that
E͑z,t͒ϭ
E0
A
eϪ͑z/vgϪt͒2/2A22
ei0n͑0͒z/c
eϪi0t
͑0ϽzϽa͒. ͑36͒
where
A2
͑z͒ϭ1Ϫi
z
c2
d2
͑n͒
d2 ͯ0
. ͑37͒
The waveform for zϾa is obtained from that for 0ϽzϽa by
the substitutions ͑22͒ with the result
E͑z,t͒ϭ
E0
A
ei0a͑n͑0͒Ϫ1͒/c
eϪ͑z/cϪa͑1/cϪ1/vg͒Ϫt͒2/2A22
ϫei0z/c
eϪi0t
͑aϽz͒, ͑38͒
where A is evaluated at zϭa here. As expected, the forms
͑36͒ and ͑38͒ revert to those of Eq. ͑31͒ when
d2
(n(0))/d2
ϭ0.
So long as the factor A(a) is not greatly different from
unity, the pulse emerges from the medium essentially undis-
torted, which requires
a
c
Ӷ
1
24
⌬2
p
2
⌬
␥
⌬, ͑39͒
using Eqs. ͑18͒ and ͑37͒. In the experiment of Wang et al.,
this condition is that a/cӶ1/120, which was well satisfied
with aϭ6 cm and cϭ300 m.
As in the case of the delta function, the centroid of a
Gaussian pulse emerges from a negative group velocity me-
dium at time
tϭ
a
vg
Ͻ0, ͑40͒
which is earlier than the time tϭ0 when the centroid enters
the medium. In the experiment of Wang et al., the time ad-
vance of the pulse was a/͉vg͉Ϸ300a/cϷ6ϫ10Ϫ8
s
Ϸ0.06.
If one attempts to observe the negative group velocity
pulse inside the medium, the incident wave would be per-
turbed and the backwards-moving pulse would not be de-
tected. Rather, one must deduce the effect of the negative
group velocity medium by observation of the pulse that
emerges into the region zϾa beyond that medium, where the
significance of the time advance ͑40͒ is the main issue.
The time advance caused by a negative group velocity
medium is larger when ͉vg͉ is smaller. It is possible that
͉vg͉Ͼc, but this gives a smaller time advance than when the
negative group velocity is such that ͉vg͉Ͻc. Hence, there is
no special concern as to the meaning of negative group ve-
locity when ͉vg͉Ͼc.
The maximum possible time advance tmax by this tech-
nique can be estimated from Eqs. ͑17͒, ͑39͒, and ͑40͒ as
tmax
Ϸ
1
12
⌬
␥
⌬Ϸ1. ͑41͒
The pulse can advance by at most a few rise times due to
passage through the negative group velocity medium.
While this aspect of the pulse propagation appears to be
superluminal, it does not imply superluminal signal propaga-
tion.
In accounting for signal propagation time, the time needed
to generate the signal must be included as well. A pulse with
a finite frequency bandwidth ⌬ takes at least time Ϸ1/⌬ to
be generated, and so is delayed by a time of order of its rise
time compared to the case of an idealized sharp wave front.
Thus, the advance of a pulse front in a negative group veloc-
ity medium by Շ can at most compensate for the original
delay in generating that pulse. The signal velocity, as defined
by the path length between the source and detector divided
by the overall time from onset of signal generation to signal
detection, remains bounded by c.
As has been emphasized by Garrett and McCumber13
and
by Chiao,18,19
the time advance of a pulse emerging from a
gain medium is possible because the forward tail of a smooth
pulse gives advance warning of the later arrival of the peak.
The leading edge of the pulse can be amplified by the gain
medium, which gives the appearance of superluminal pulse
612 612Am. J. Phys., Vol. 69, No. 5, May 2001 New Problems
13. velocities. However, the medium is merely using information
stored in the early part of the pulse during its ͑lengthy͒ time
of generation to bring the apparent velocity of the pulse
closer to c.
The effect of the negative group velocity medium can be
dramatized in a calculation based on Eq. ͑31͒ in which the
pulse width is narrower than the gain region ͓in violation of
condition ͑39͔͒, as shown in Fig. 4. Here, the gain region is
0ϽzϽ50, the group velocity is taken to be Ϫc/2, and c is
defined to be unity. The behavior illustrated in Fig. 4 is per-
haps less surprising when the pulse amplitude is plotted on a
logarithmic scale, as in Fig. 5. Although the overall gain of
the system is near unity, the leading edge of the pulse is
amplified by about 70 orders of magnitude in this example
͓the implausibility of which underscores that condition ͑39͒
cannot be evaded͔, while the trailing edge of the pulse is
attenuated by the same amount. The gain medium has tem-
porarily loaned some of its energy to the pulse permitting the
leading edge of the pulse to appear to advance faster than the
speed of light.
Our discussion of the pulse has been based on a classical
analysis of interference, but, as remarked by Dirac,21
classi-
cal optical interference describes the behavior of the wave
functions of individual photons, not of interference between
photons. Therefore, we expect that the behavior discussed
above will soon be demonstrated for a ‘‘pulse’’ consisting of
a single photon with a Gaussian wave packet.
ACKNOWLEDGMENTS
The author thanks Lijun Wang for discussions of his ex-
periment, and Alex Granik for references to the early history
of negative group velocity and for the analysis contained in
Eqs. ͑14͒–͑16͒.
a͒
Electronic mail: mcdonald@puphed.princeton.edu
1
L. V. Hau et al., ‘‘Light speed reduction to 17 metres per second in an
ultracold atomic gas,’’ Nature ͑London͒ 397, 594–598 ͑1999͒.
2
K. T. McDonald, ‘‘Slow light,’’ Am. J. Phys. 68, 293–294 ͑2000͒. A
figure to be compared with Fig. 1 of the present paper has been added in
the version at http://arxiv.org/abs/physics/0007097
3
This is in contrast to the ‘‘⌳’’ configuration of the three-level atomic
system required for slow light ͑Ref. 2͒ where the pump laser does not
produce an inverted population, in which case an adequate classical de-
scription is simply to reverse the sign of the damping constant for the
pumped oscillator.
4
L. J. Wang, A. Kuzmich, and A. Dogariu, ‘‘Gain-assisted superluminal
light propagation,’’ Nature ͑London͒ 406, 277–279 ͑2000͒. Their website,
http://www.neci.nj.nec.com/homepages/lwan/gas.htm, contains additional
material, including an animation much like Fig. 4 of the present paper.
5
W. R. Hamilton, ‘‘Researches respecting vibration, connected with the
theory of light,’’ Proc. R. Ir. Acad. 1, 267,341 ͑1839͒.
6
J. S. Russell, ‘‘Report on waves,’’ Br. Assoc. Reports ͑1844͒, pp. 311–
390. This report features the first recorded observations of solitary waves
͑p. 321͒ and of group velocity ͑p. 369͒.
7
G. G. Stokes, Problem 11 of the Smith’s Prize examination papers ͑2
February 1876͒, in Mathematical and Physical Papers ͑Johnson Reprint
Co., New York, 1966͒, Vol. 5, p. 362.
8
T. H. Havelock, The Propagation of Disturbances in Dispersive Media
͑Cambridge U.P., Cambridge, 1914͒.
9
H. Lamb, ‘‘On Group-Velocity,’’ Proc. London Math. Soc. 1, 473–479
͑1904͒.
10
See p. 551 of M. Laue, ‘‘Die Fortpflanzung der Strahlung in Dispergier-
enden und Absorbierenden Medien,’’ Ann. Phys. ͑Leipzig͒ 18, 523–566
͑1905͒.
11
L. Mandelstam, Lectures on Optics, Relativity and Quantum Mechanics
͑Nauka, Moscow, 1972͒; in Russian.
12
L. Brillouin, Wave Propagation and Group Velocity ͑Academic, New
York, 1960͒. That the group velocity can be negative is mentioned on p.
122.
13
C. G. B. Garrett and D. E. McCumber, ‘‘Propagation of a Gaussian Light
Pulse through an Anomalous Dispersion Medium,’’ Phys. Rev. A 1, 305–
313 ͑1970͒.
14
R. Y. Chiao, ‘‘Superluminal ͑but causal͒ propagation of wave packets in
transparent media with inverted atomic populations,’’ Phys. Rev. A 48,
R34–R37 ͑1993͒.
Fig. 5. The same as Fig. 4, but with the electric field plotted on a logarith-
mic scale from 1 to 10Ϫ65
.
613 613Am. J. Phys., Vol. 69, No. 5, May 2001 New Problems
15. The force depends on the orientation of the dipole ͑repre-
sented by M͒ in the local field ͑represented by H͒ and on the
gradient of the local field in the vicinity of the dipole. There
is no force, only a torque, acting on a dipole in a uniform
field. The derivation of the last equality in Eq. ͑1͒ reasonably
assumes that “ÃHϭ0 and that the magnetic flux density B
is linearly related to the magnetic field strength and to the
magnetization as follows:
BϭHϭ0͑HϩM͒ ͑2͒
with the permeability of the film. Using Eq. ͑2͒ to repre-
sent the body force in terms of the magnetic flux density in
the second equality of Eq. ͑1͒ gives
fϭ
1
ͩ1Ϫ
0
ͪB“Bϭ
1
2 ͩ1Ϫ
0
ͪ“B2
. ͑3͒
Consequently, the negative square of the magnetic flux den-
sity within the film corresponds to a ‘‘potential field’’ to
which the film responds.
Consider the film to be of constant thickness and spread
uniformly over the surface of the water when in the presence
of the external magnetic field. In the absence of magnetic
charge and surface current density, consideration of the Max-
well equations leads to the following boundary conditions
for the magnetic field strength and magnetic flux density:
͑BϪB0͒"nϭ0, ͑HϪH0͒Ãnϭ0, ͑4͒
where the terms with a subscript refer to the air ͑or vacuum͒
side of the film boundary and the terms without a subscript to
the ferrofluid. The vector n is a unit normal to the film sur-
face. Note that these are the same boundary conditions and
field relationships used to find the field inside an ellipsoid
subjected to a uniform external field. For the film problem,
we take the normal to the film, the zˆ direction, to be parallel
to the magnet axis and assume azimuthal symmetry. The unit
vector ˆ designates the radial direction with respect to the
Fig. 3. Ellipsoidal ‘‘clump’’ or cone of ferrofluid.
Fig. 1. Experimental setup for viewing the dynamics of a ferrofluid film.
Fig. 2. Ferrofluid film before the magnet was introduced ͑a͒, after 1 min ͑b͒, after 3
1
4 min ͑c͒, and after 21 min ͑d͒. Note that any dark spots that appear the
same in all frames are due to imperfections in the optical train.
615 615Am. J. Phys., Vol. 69, No. 5, May 2001 New Problems
16. magnet axis. Using the relationships given in Eqs. ͑2͒ and
͑4͒, the magnetic flux density and magnetic field strength just
inside the film are represented in terms of the magnetic flux
density just outside the film as
BϭB0zzˆϩ
0
B0ˆ,
͑5͒
Hϭ
1
B0zzˆϩ
1
0
B0ˆ.
Since the film is thin, we assume these boundary results to
represent the field within the film.
Next we approximate the external field at the surface of
the film by a dipole field with moment m directed parallel
to zˆ,
B0ϭ
0
4r3 ͑3͑m"rˆ͒rˆϪm͒
ϭ
0m
4 ͫ 3z
͑2
ϩz2
͒5/2 ˆ ϩ
2z2
Ϫ2
͑2
ϩz2
͒5/2 zˆ ͬ, ͑6͒
where z measures the distance from the film to the dipole
source ͑cylindrical magnet͒, is the radial position in the
film, rϭͱ2
ϩz2
is the position vector magnitude in spheri-
cal coordinates, and the vectors with a caret are unit vectors.
This magnetic flux density, when plugged into the right-hand
side of Eq. ͑5͒, gives an estimate of the magnetic flux density
inside the film. Directly beneath the dipole the magnetic flux
density is normal to the film and has the same magnitude on
both sides of the film surface. As increases from zero,
however, there is a component of the magnetic flux density
which is parallel to the surface and larger inside the film than
outside for /0Ͼ1. While the magnitude of the external
magnetic flux density decreases monotonically with increas-
ing for this dipole field, the magnetic flux density inside
the film will increase for sufficiently large permeability ratio,
/0 , before decreasing to zero. The increasing magnetic
flux density results in a force ͓see Eq. ͑3͔͒ that pushes the
film outward radially to collect in a ring where the flux den-
sity reaches a maximum. Note that we neglected contribu-
tions from the film to the external magnetic field on the
assumption that this field is small for a very thin film. While
an exact solution to this problem is beyond the scope of a
typical undergraduate course in electromagnetism, we
checked our results using the method of images to find the
magnetic flux density produced by a dipole near a thin plane
of material with permeability . In the limit that the thick-
ness goes to zero, the fields inside and outside the film be-
come identical to those approximated here. There is one ca-
veat. The body force must be calculated using the second
equality in Eq. ͑1͒. The first equality involves a derivative
with respect to z, which must be performed before the film
thickness is taken to zero.
Figure 4 shows the reduced potential, estimated for our
ferrofluid film using the dipole field given in Eq. ͑6͒, as a
function of for zϭ1, and different values of the permeabil-
ity ratio /0 . The functional form of this reduced potential
is
⌽ϭϪ
B2
͑0m/4͒2
ϭϪͩ4
ϩ͑Ϫ4ϩ9͑/0͒2
͒2
z2
ϩ4z4
͑2
ϩz2
͒5 ͪ. ͑7͒
For permeability ratios greater than ͱ8/3Ϸ1.63 a potential
minimum obtains at finite radius. The minimum position min
obeys the following linear relationship with respect to z:
min /zϭͱϪ6͑/0͒2
ϩ3ϩͱ36͑/0͒4
Ϫ33͑/0͒2
ϩ1.
͑8͒
This ratio ranges between zero and one half as the perme-
ability ratio increases from 1.63 to infinity. Since the initial
magnetic susceptibility of our ferrofluid is ϭ1.9, the per-
meability ratio is 2.9, and Eq. ͑8͒ predicts min /zϭ0.43. Ap-
proximating the magnet by a dipole placed at the lower end
of the magnet, the end closest to the ferrofluid, gives min /z
ϳ1.0 cm/3.3 cmϳ0.30 or placing the dipole at the physical
center of the magnet gives min /zϳ1.0 cm/5.8 cmϳ0.17.
Considering that the magnet is an extended source rather
than a point dipole, the agreement is quite good.
The response of a ferrofluid film to a nonuniform external
field is complex, but a fairly straightforward undergraduate
boundary value calculation explains puzzling observations.
The large susceptibility of the magnetic fluid and fluid sur-
face orientation beneath a magnet determines the net force
on the ferrofluid, giving attraction for the cones and repul-
sion for the film.
a͒
Author to whom correspondence should be addressed; electronic mail:
bjack@okstate.edu
b͒
This communication originated as an honors thesis project of A.N., who is
presently a graduate student in physics at Colorado State University.
1
R. E. Rosensweig, Ferrohydrodynamics ͑Cambridge U.P., Cambridge,
1985͒, p. 110 ff.
2
R. E. Rosensweig, ‘‘Magnetic Fluids,’’ Sci. Am. 247 ͑4͒, 136–145 ͑1982͒.
3
B. M. Berkovsky, V. F. Medvedev, and M. S. Krakov, Magnetic Fluids
Engineering Applications ͑Oxford U.P., Oxford, 1993͒, Chap. 6.
4
Ferrofluidics Corporation, 40 Simon Street, Nashua, NH 03060-3075.
5
Ferrofluidics: Catalog No. EMG 905, Lot No. F8193A.
6
V. I. Arkhipenko, Yu. D. Barkov, and V. G. Bashtovoi, ‘‘Study of a
magnetized fluid drop shape in a homogeneous magnetic field,’’ Magn.
Gidrodin. ͑3͒, 131–134 ͑1978͒.
7
G. Arfken, Mathematical Methods for Physicists ͑Academic, New York,
1970͒, p. 603; S. D. Poisson, ‘‘Seconde me´moire sur la the´orie du mag-
ne´tisme,’’ Mem. Acad. R. Sci. Inst. France 5, 488–533 ͑1821–1822͒.
8
A. T. Skjeltorp, ‘‘One- and two-dimensional crystallization of magnetic
holes,’’ Phys. Rev. Lett. 51 ͑25͒, 2306–2309 ͑1983͒.
Fig. 4. Reduced potential for an element of ferrofluid film for zϭ1 as a
function of the distance from the magnet axis and shown for different
values of the permeability ratio /0ϭ1, 2, 2.9, and 5 from top to bottom.
616 616Am. J. Phys., Vol. 69, No. 5, May 2001 New Problems
18. r2
ϭR2
ez2
, ͑16͒
which has a minimum radius R, and a critical radius rcrit
ϭRͱ4
eϭ1.28R.
Our final example is the surface
rϭϪ
k
zͱ1Ϫz2
͑Ϫ1ϽzϽ0͒, ͑17͒
which has a minimum radius of Rϭ2k, approaches the sur-
face rϭϪk/z at large r ͑small z͒, and has a critical radius of
rcritϭ6k/ͱ5ϭ1.34R.
These examples arise in a 2ϩ1 geometry with curved
space but flat time. As such, they are not fully analogous to
black holes in 3ϩ1 geometry with both curved space and
curved time. Still, they provide a glimpse as to how a particle
in curved space–time can undergo considerably more com-
plex motion than in flat space–time.
ACKNOWLEDGMENTS
The author wishes to thank Ori Ganor and Vipul Periwal
for discussions of this problem.
a͒
Electronic mail: mcdonald@puphed.princeton.edu
1
The Vortx͑tm͒ Miniature Wishing Well, Divnick International, Inc., 321 S.
Alexander Road, Miamisburg, OH 45342, http://www.divnick.com/
AWESTRUCK SCIENTISTS
The second feature of science is that it shows that the world is simple. Even many scientists do
not appreciate that they are hewers of simplicity from complexity. They are often more deluded
than those they aim to tell. Scientists are often overawed by the complexity of detecting simplicity.
They look at the latest fundamental particle experiment, see that it involves a thousand kilograms
of apparatus and a discernible percentage of a gross national product, and become thunderstruck.
They see the complexity of the apparatus and the intensity of the effort needed to construct and
operate it, and confuse that with the simplicity that the experiment, if successful, will expose.
Some scientists are so awestruck that they even turn to religion! Others keep a cool head, and
marvel not at an implied design but at the richness of simplicity.
P. W. Atkins, ‘‘The Limitless Power of Science,’’ in Nature’s Imagination—The Frontiers of Scientific Vision, edited by
John Cornwell ͑Oxford University Press, New York, 1995͒.
618 618Am. J. Phys., Vol. 69, No. 5, May 2001 New Problems