Web 2.0 Weekly - 09-05-12

In the first week of May, $38.9 million was raised on seven deals. Over the last three months, four sectors, Media, Ad Network, Video, and Social Network, have seen the most activity, bringing in a combined $209 million on 25 transactions. Overall, capital market activity has trended downwards on the back of a declining economy and lower valuations. With any sustainable certainty and stability in the public markets, we would expect to see activity pick up as more institutions participate in private placements. Seven companies raised $38.9 million in the first week of May. EveryZing, a company in the video search sector, raised $8.3 million, followed by Gist at $6.8 million. All transactions except one (Resonate Networks) were greater than or equal to $5 million. The companies in our universe had mixed stock price performances over the past week (for stocks with prices greater than $1) (Figure 6), with 22 companies showing positive returns on the week. Tree.com (TREE-NASDAQ) led the group with a 27.5% return, while Beyond Commerce, Inc. (BYOC-OTCBB) had the worst return, dropping 21.8% in the week. This email and any files transmitted with it are privileged, confidential, subject to copyright and intended solely for the use of the individual or entity to whom they are addressed. Views expressed are those of the user and not necessarily this Firm or its subsidiaries. Any unauthorized use, copying, review or disclosure is prohibited. Please notify the sender immediately if you have received this communication in error. Please note that this Firm, nor any of it's employees accept trade instructions via email. If trade instructions are received via email, they will not be acted upon. Thank you for your assistance and co-operation. Member CIPF. Ce courrier électronique et toutes les pièces jointes transmises sont privés, confidentiels et assujettis aux droits d'auteur et sont conçus pour l'emploi exclusif de l'individu ou de l'entité destinataire. Les opinions exprimées sont celles de l'utilisateur et ne sont pas nécessairement celles de cette firme ou ses filiales. Il est interdit de diffuser, distribuer, réviser ou divulguer ce courrier électronique illégalement. Si ce message vous avez reçu ce communiqué par erreur, veuillez aviser l'expéditeur immédiatement. Veuillez noter que ni cette firme , ni ses employés ne peuvent accepter des instructions de transactions envoyées par courrier électronique. De telles instructions ne seront pas suivies ou exécutées si elles sont reçues par courrier électronique. Nous vous remercions pour votre aide et pour votre coopération. Membre du FCPE.

Empfohlen
Weitere ähnliche Inhalte
Andere mochten auch
Andere mochten auch (7)
Ähnlich wie Web 2.0 Weekly - 09-05-12
Ähnlich wie Web 2.0 Weekly - 09-05-12 (20)
Mehr von David Shore
Mehr von David Shore (19)
Kürzlich hochgeladen
Kürzlich hochgeladen (20)
Web 2.0 Weekly - 09-05-12
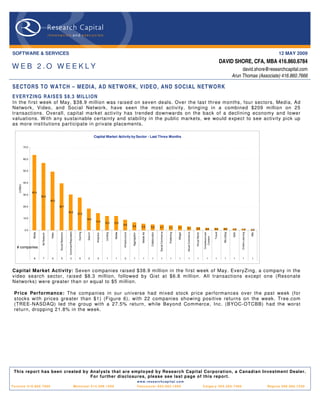
- 1. SOFTWARE & SERVICES 12 MAY 2009 DAVID SHORE, CFA, MBA 416.860.6784 WEB 2.O WEEKLY david.shore@researchcapital.com Arun Thomas (Associate) 416.860.7666 SECTORS TO WATCH – MEDIA, AD NETWORK, VIDEO, AND SOCIAL NETWORK E V ER YZ IN G R AI S E S $ 8.3 MIL L I ON In the first week of May, $38.9 million was raised on seven deals. Over the last three months, four sectors, Media, Ad Network, Video, and Social Network, have seen the most activity, bringing in a combined $209 million on 25 transactions. Overall, capital market activity has trended downwards on the back of a declining economy and lower valuations. W ith any sustainable certainty and stability in the public markets, we would expect to see activity pick up as more institutions participate in private placements. Capital Market Activity by Sector - Last Three Months 70.0 60.0 50.0 40.0 (US$m) 63.4 30.0 56.9 49.5 20.0 39.7 30.2 27.6 10.0 18.3 14.4 12.0 12.0 8.9 6.8 5.5 5.0 4.7 4.1 4.1 3.1 2.5 2.0 2.0 2.0 1.3 1.3 0.6 0.0 Comment/Reputation Social Commerce Gaming Visual Commerce Travel Wiki Media Mobile Collaboration Publishing Microblog Online Learning Search Lending Infrastructure Mobile Ad Widget Social Networks SAS Crowdsourced Video Aggregation Virtual World Ad Network Analytics Content # companies 8 7 5 5 2 5 2 3 1 1 2 1 1 1 1 1 1 1 1 1 1 1 1 1 1 Capital Market Activity: Seven companies raised $38.9 million in the first week of May. EveryZing, a company in the video search sector, raised $8.3 million, followed by Gist at $6.8 million. All transactions except one (Resonate Networks) were greater than or equal to $5 million. Price Performance: The companies in our universe had mixed stock price performances over the past week (for stocks with prices greater than $1) (Figure 6), with 22 companies showing positive returns on the week. Tree.com (TREE-NASDAQ) led the group with a 27.5% return, while Beyond Commerce, Inc. (BYOC-OTCBB) had the worst return, dropping 21.8% in the week. This report has been created b y Anal ysts that are emplo yed b y Research Capital Corporation, a Canadian Investment Dealer. For further disclosures, please see last page of this report. w w w . r e s e a rc h c a p i t a l . c o m T o ro n t o 4 1 6 . 8 6 0 . 7 6 0 0 Montreal 514.399.1500 Vancouver 604.662.1800 Calgary 403.265.7400 Regina 306.566.7550
- 2. Page 2 THE WEB 2.0 UNIVERSE Ninety-tw o public Web 2.0 companies identified: Our W eb 2.0 universe contains 92 companies, with a combined market cap of ~ $46 billion (Figure 1). The average market cap for the group is ~$500 million (but a median of only $48.8 million), with average trailing revenue of $149.6 million (median $56.0 million). The companies are also generally profitable, with a median EBITDA margin of 16.0%. On a valuation basis, the overall average is 5.2x trailing revenue (median 1.5x) and 9.4x trailing EBITDA (median 8.7x). Thirteen of the companies have more than 500 employees. C omparable C o mpany A nalys is > W eb 2.0 Trading Current U S D Market U S D LT M Total US D L TM T otal E BITDA TE V/LT M T E V/LT M C om pan y Nam e L TM as of T icker E xc hange Cu rrenc y H Q P ric e C ap ($m) R ev ($m) E B ITDA ($m) % R evenue E B IT DA E mployees Acce le rize N ew Me dia, Inc. 1 2/31 /200 8 AC LZ OT C B B US D U nited S ta tes 0 .50 1 3.8 3.8 (4 .8) NM 4.8 x - 11 Actoz S of t C o., L td. 1 2/31 /200 8 A0 527 90 K OS E KR W S o uth K orea 14, 400 9 9.4 75. 7 1 5.1 20 .0% 0.9 x 4.7x NA AQ Inte ractive , Inc. 1 2/31 /200 8 38 38 TSE J PY J apan 48 ,000 .00 2 6.8 61. 8 4 .9 8 .0% - - NA As s o cia ted Media H oldings Inc. 6 /30 /200 7 AS MH OT C P K US D U nited S ta tes 0 0 .1 0.1 (2 .3) NM 8.1 x - 3 B igstring Corp. 1 2/31 /200 8 BS GC OT C B B US D U nited S ta tes 0 .02 1 .2 0.1 (2 .1) NM 30.6 x - 4 B e tawave Corpora tion 1 2/31 /200 8 B W AV OT C B B US D U nited S ta tes 0 3 .2 7.7 (1 1.8) NM - - 45 B e yo nd Commerce, Inc. 1 2/31 /200 8 B Y OC OT C B B US D U nited S ta tes 1 .04 4 3.0 1.8 (8 .6) NM 25.4 x - 43 B right T hings plc 9 /30 /200 8 AIM:B G T AIM GBP U nited K ingdom 0 5 .6 0.2 (1 .7) NM 22.1 x - 9 B roa dW ebAs ia Inc. 9 /30 /200 8 BW BA OT C P K US D U nited S ta tes 0 .30 2 5.3 0.0 (4 .6) NM - - 46 C DC C orp. 1 2/31 /200 8 C HIN .A N as da qG S US D H ong K ong 1 15 7.3 409 .1 2 5.5 6 .2% 0.5 x 7.3x NA C ha ngyou. com Limite d 3 /31 /200 9 C Y OU N as da qG S US D C hina 29 .80 1,5 27.3 222 .5 13 5.1 60 .7% 6.0 x 9.9x 628 C hina G ate wa y C or pora tion 9 /30 /200 8 CGWY OT C P K US D U nited S ta tes 0 0 .0 6.7 (6 .6) -9 8.9% 0.0 x - 37 C hine s e G amer International 3 /31 /200 9 G T S M:308 3 GT S M TWD T aiwan 225 .00 57 5.6 56. 2 3 1.5 56 .0% 9.1 x 1 6.2 x NA C ornerW orld C orporation 1 /31 /200 9 C WR L OT C B B US D U nited S ta tes 0 6 .4 1.3 NM NM 6.0 x - NA C yberplex Inc. 1 2/31 /200 8 T S X:C X TSX C AD C ana da 1 .87 8 6.5 49. 4 4 .1 8 .3% 1.7 x 2 0.6 x NA DADA S pA 9 /30 /200 8 C M:DA CM E UR Ita ly 6 13 9.4 231 .1 3 6.9 16 .0% 0.8 x 5.0x 574 DXN Ho ldings B hd 1 1/30 /200 8 DXN KLSE MY R Ma la ys ia 0 .44 2 9.1 79. 0 1 0.5 13 .3% 0.6 x 4.7x NA Dibz Inte rnational, Inc. NA DIB Z OT C P K US D U nited S ta tes 0 0 .0 NA NM NM - - NA DigitalP o st Inte ra ctive , Inc. 9 /30 /200 8 DG LP OT C B B US D U nited S ta tes 0 .02 1 .1 0.4 (3 .3) NM 5.0 x - 11 DigitalT own, Inc. 2 /28 /200 9 DG T W OT C B B US D U nited S ta tes 3 6 7.7 NM (3 .0) NM - - 3 Dolphin Digital Me dia, Inc. 1 2/31 /200 8 DP DM OT C B B US D U nited S ta tes 0 .68 3 3.5 0.9 (3 .0) NM 37.2 x - NA E o lith C o. L td. 1 2/31 /200 7 A0 410 60 K OS E KR W S o uth K orea 900 5 2.4 20. 2 (0 .1) -0 .3% 2.6 x - NA E xte ns ions , Inc. 1 2/31 /200 8 E XT I OT C P K US D U nited S ta tes 0 .15 1 4.2 NM NM NM - - NA F inancia l Media G roup, Inc. 1 1/30 /200 8 F NG P OT C B B US D U nited S ta tes 0 0 .4 6.8 1 .2 18 .3% - - 22 F luid Mus ic Ca nada, Inc. 1 2/31 /200 8 T S X:F MN TSX C AD U nited S ta tes 0 .45 2 0.4 4.6 (9 .3) NM 1.9 x - NA F rogs te r Interactive P ictu re s AG 6 /30 /200 8 FRG XT R A E UR G ermany 8 2 4.6 5.5 (3 .3) -6 0.6% 4.4 x - NA G a ma nia Digital E ntertainment C o., L td. 3 /31 /200 9 61 80 GT S M TWD T aiwan 38 .60 17 8.2 126 .0 2 0.9 16 .6% 1.2 x 7.4x NA G a me On C o L td. 1 2/31 /200 8 38 12 TSE J PY J apan 91, 800 9 1.0 76. 5 1 9.8 25 .9% 0.4 x 1.7x NA G e oS e ntr ic O yj 1 2/31 /200 8 G E O1 V H LS E E UR F inland 0 .04 4 8.8 6.0 (1 3.4) NM 6.9 x - 94 G iant Intera ctive G r oup, Inc. 1 2/31 /200 8 GA NYS E US D C hina 8 1,8 62.2 233 .6 14 4.6 61 .9% - - NA G iga Media Ltd. 1 2/31 /200 8 G IG M N as da qG S US D T aiwan 6 .38 34 4.7 190 .4 4 6.0 24 .2% 1.4 x 5.8x NA G ravity C o., L td 9 /30 /200 8 G R VY N as da qG M US D S o uth K orea 1 2 7.0 39. 7 7 .6 19 .2% - - 636 G ree, Inc. 6 /30 /200 8 T S E : 363 2 TSE J PY J apan 5 ,260 .00 1,2 03.8 30. 1 1 0.8 36 .0% 37.9 x - NA G u ngH o O nline E ntertainment, Inc. 1 2/31 /200 8 37 65 OS E J PY J apan 1 42, 600 16 7.5 115 .3 2 0.6 17 .8% 1.3 x 7.1x NA H anbitS of t, Inc. 1 2/31 /200 8 A0 470 80 K OS E KR W S o uth K orea 4 ,855 .00 8 6.3 56. 4 (1 5.9) -2 8.2% 1.2 x - NA IAC /InterActiveC orp. 3 /31 /200 9 IAC I N as da qG S US D U nited S ta tes 16 2,3 92.0 1 ,40 6.4 4 2.6 3 .0% 0.4 x 1 1.9 x 3 ,20 0 IAS E nergy, Inc. 1 /31 /200 9 IAS C.A OT C B B US D C ana da 0 .28 1 9.6 0.0 (0 .8) NM - - NA IdeaE dge, Inc. 1 2/31 /200 8 OT C B B :IDAE OT C B B US D U nited S ta tes 1 2 4.3 0.0 (4 .6) NM - - NA is ee media Inc. 1 2/31 /200 8 IE E T S XV C AD C ana da 0 .09 4 .0 1.3 (5 .1) NM 1.8 x - NA J umbuck E nter tainment P ty Ltd. 1 2/31 /200 8 AS X:J MB AS X AU D Au s tra lia 0 1 5.3 13. 7 5 .1 37 .2% 0.8 x 2.1x 72 J umpT V Inc. 1 2/31 /200 8 T S X:J T V TSX C AD C ana da 0 .71 6 9.7 13. 4 (8 .4) -6 2.6% 4.0 x - 237 K a boos e Inc. 1 2/31 /200 8 T S X:K AB TSX C AD C ana da 1 7 2.5 70. 7 7 .0 10 .0% 1.1 x 1 1.2 x NA K ings oft Co . Ltd. 1 2/31 /200 8 38 88 S E HK HKD C hina 4 .14 57 6.9 120 .2 4 6.6 38 .7% 4.2 x 1 0.9 x NA Lingo Media Co rporation 9 /30 /200 8 T S XV: LM T S XV C AD C ana da 1 1 1.1 3.5 (1 .5) -4 2.5% 3.4 x - NA Live World Inc. 1 2/31 /200 8 LV WD OT C P K US D U nited S ta tes 0 .07 2 .2 11. 8 (0 .5) -4 .3% 0.1 x - NA Lo okS mart, Ltd. 3 /31 /200 9 LOOK N as da qG M US D U nited S ta tes 1 2 4.6 60. 7 (3 .8) -6 .3% - - 90 Magnitu de Information S ys tems Inc. 1 2/31 /200 8 MA G Y OT C B B US D U nited S ta tes 0 .01 4 .4 0.1 (3 .0) NM - - 14 Mixi, Inc. 1 2/31 /200 8 21 21 TSE J PY J apan 4 50, 000 70 8.4 120 .3 4 5.8 38 .0% 5.0 x 1 3.2 x NA Mode rn Times G r ou p Mtg AB 3 /31 /200 9 MT G B OM S EK S weden 237 .50 2,0 20.2 1 ,73 7.6 26 6.2 15 .3% 1.5 x 9.7x 2 ,96 9 Moggle , Inc 1 2/31 /200 8 MMOG OT C B B US D U nited S ta tes 2 8 3.5 NM (1 .1) NM - - 3 MOK O.mobi L imited 1 2/31 /200 8 MK B AS X AU D Au s tra lia 0 .08 5 .0 1.1 (2 .3) NM 3.5 x - NA N E OW IZ G ames C orpo ra tion 1 2/31 /200 8 A0 956 60 K OS E KR W S o uth K orea 62, 400 48 7.1 200 .8 5 3.9 26 .8% 2.4 x 8.9x NA N etD rago n W ebS oft, Inc. 1 2/31 /200 8 77 7 S E HK HKD C hina 5 .53 37 7.2 87. 3 3 9.9 45 .7% 2.8 x 6.1x 2 ,42 6 N ete as e.co m I nc. 1 2/31 /200 8 NT E S N as da qG S US D C hina 31 3,8 09.7 451 .8 29 3.7 65 .0% - - NA N eXplo re Co rpora tion 9 /30 /200 7 N XP C OT C P K US D U nited S ta tes 0 .70 3 9.0 NM (4 .9) NM - - 19 N gi G roup Inc. 1 2/31 /200 8 24 97 TSE J PY J apan 31, 700 4 0.2 100 .8 3 1.0 30 .8% - - NA N orthgate Te chno logies L imited 1 2/31 /200 8 59 005 7 BS E INR India 39 .15 2 7.6 136 .2 2 4.0 17 .6% 0.2 x 1.2x 286 Open T e xt Co rp. 3 /31 /200 9 OT E X N as da qG S US D C ana da 32 1,6 69.7 782 .6 19 9.2 25 .5% 2.2 x 8.7x 2 ,91 5 Openwave S ys tems Inc. 3 /31 /200 9 OP W V N as da qG S US D U nited S ta tes 1 .27 10 5.8 197 .2 (2 .9) -1 .5% 0.0 x - 657 P e rf ect W or ld C o., Ltd. 1 2/31 /200 8 PW R D N as da qG S US D C hina 19 99 7.1 210 .5 11 3.9 54 .1% - - NA P hoto Channel N etwork s Inc. 1 2/31 /200 8 T S XV: P N T S XV C AD C ana da 1 .59 4 7.0 17. 2 (0 .8) -4 .9% 2.7 x - NA Qu epa s a C orp. 1 2/31 /200 8 QP S A N as da qC M US D U nited S ta tes 1 1 2.3 0.1 (1 1.4) NM - - 74 OA O R B C Information S ys tems 1 2/31 /200 7 R BC I R TS US D R us s ia 1 .25 17 3.4 146 .9 1 9.2 13 .1% 0.0 x 0.3x NA S handa Interactive E ntertainme nt L td. 1 2/31 /200 8 S N DA N as da qG S US D C hina 49 3,4 26.1 522 .7 24 0.2 46 .0% 0.2 x 0.4x NA S hutte rf ly, Inc. 3 /31 /200 9 S F LY N as da qG S US D U nited S ta tes 12 .85 32 3.5 215 .2 2 8.3 13 .2% 1.2 x 9.1x 514 S K C ommunications Co., Ltd. 1 2/31 /200 7 A0 662 70 K OS E KR W S o uth K orea 9, 390 31 3.1 168 .1 1 5.8 9 .4% 1.9 x 1 9.8 x NA S N AP Inte ra ctive , Inc. 1 2/31 /200 8 ST VI OT C B B US D U nited S ta tes 0 .75 8 .1 3.0 0 .9 31 .4% 2.2 x 7.0x 11 S N M G lobal H oldings 9 /30 /200 8 S N MN OT C P K US D U nited S ta tes 0 0 .0 2.0 (0 .7) -3 4.8% 1.1 x - 33 S o cia l Media V e nur es , Inc. 1 2/31 /200 8 S M VI OT C P K US D U nited S ta tes 0 .01 0 .0 0.1 (0 .1) -6 0.5% 0.0 x - NA S o hu. com Inc. 3 /31 /200 9 S OH U N as da qG S US D C hina 55 2,1 16.8 460 .0 20 0.4 43 .6% 3.8 x 8.7x 3 ,19 7 S ite s earch C orpo ratio n 1 /31 /200 9 STPC OT C B B US D U nited S ta tes 3 .50 2 8.2 NM (1 .1) NM - - 15 S park N etworks , Inc. 1 2/31 /200 8 LOV AME X US D U nited S ta tes 3 5 6.5 57. 3 1 2.3 NM 1.0 x 4.6x 183 S pectrumDN A, Inc. 1 2/31 /200 8 S P XA OT C B B US D U nited S ta tes 0 .42 2 0.5 0.1 (2 .5) 48 .9% - - 7 T encent Ho ldings L td. 1 2/31 /200 8 70 0 S E HK HKD C hina 71 16,5 68. 2 1 ,04 7.8 51 2.5 -1 2.0% 17.2 x 3 5.3 x 6 ,19 4 T he P arent C ompany 8/2/2008 K IDS .Q OT C P K US D U nited S ta tes 0 .01 0 .3 112 .0 (1 3.5) 33 .7% 0.2 x - 347 T he 9 L imited 1 2/31 /200 8 N CT Y N as da qG S US D C hina 9 25 3.7 250 .2 8 4.3 2 .6% - - NA T he S treet.com, Inc. 3 /31 /200 9 TSC M N as da qG M US D U nited S ta tes 2 .05 6 2.8 67. 0 1 .7 -5 0.6% - - 310 T otal S po rt Online A S 3 /31 /200 6 T OS O OT C NO NOK N orwa y 0 0 .1 2.1 (1 .1) -6 .2% 4.6 x - 16 T ree.C om, Inc. 3 /31 /200 9 TR EE N as da qG M US D U nited S ta tes 12 .09 13 0.5 215 .6 (1 3.3) 0 .4% 0.6 x - 700 U nis erve C ommu nications Corp. 1 1/30 /200 8 T S XV: US S T S XV C AD C ana da 0 0 .8 25. 8 0 .1 21 .9% 0.1 x 2 9.5 x NA U nited Online Inc. 3 /31 /200 9 U NT D N as da qG S US D U nited S ta tes 7 .24 60 5.1 811 .2 17 7.3 -7 8.2% 1.1 x 5.0x 1 ,46 9 U OMO Media , Inc 1 /31 /200 9 U OMO OT C B B US D C ana da 0 2 1.0 0.6 (0 .5) 18 .1% 33.6 x - NA Va lueC lick Inc. 3 /31 /200 9 VC LK N as da qG S US D U nited S ta tes 10 .34 89 7.0 591 .7 10 6.9 NM 1.3 x 7.4x 1 ,18 9 VO IS , Inc. 1 2/31 /200 8 VOIS OT C B B US D U nited S ta tes 0 2 .7 0.0 (1 .3) -1 9.8% - - 4 W ebze n Inc. 1 2/31 /200 8 W ZE N N as da qG M US D S o uth K orea 3 .28 3 8.9 23. 1 (4 .6) -9 8.2% - - NA W izza rd S of twa re Co rpora tion 1 2/31 /200 8 W ZE AME X US D U nited S ta tes 1 2 9.2 6.1 (6 .0) NM 4.8 x - 110 W or lds .com Inc. 1 2/31 /200 8 W DD D OT C B B US D U nited S ta tes 0 .17 8 .9 0.1 (0 .7) NM - - 1 W ynds torm C orporatio n NA W YND OT C B B US D U nited S ta tes 0 0 .5 NA NM 32 .0% - - NA XIN G AG 1 2/31 /200 8 O1B C XT R A E UR G ermany 28 .95 20 8.1 47. 6 1 5.2 22 .4% 3.1 x 9.8x 174 Y e dangOnline Corp. 1 2/31 /200 7 A0 527 70 K OS E KR W S o uth K orea 8, 900 11 3.3 55. 6 1 2.4 -7 .6% 2.0 x 9.0x NA Y nk K orea Inc. 1 2/31 /200 7 A0 237 70 K OS E KR W S o uth K orea 6 ,850 .00 1 3.6 15. 8 (1 .2) NM 0.9 x - NA ZipLocal Inc. 1 2/31 /200 8 T S XV: ZIP T S XV C AD C ana da 0 0 .3 2.8 (3 .0) 0 .0% 0.6 x - NA H igh 16,5 68. 2 1 ,737 .6 51 2.5 65 .0% 37.9 x 3 5.3 x 6 ,194 Lo w 0 .0 0.0 -15.9 -9 8.9% 0.0 x 0.3x 1 A vera ge 500.3 149.6 33.4 7.5% 5.2x 9.4x 644 Median 4 8.8 56. 0 0 .9 16 .0% 1.5 x 8.7x 179 Figure 1. Web 2.0 Universe Summary Source. Capital IQ
- 3. Page 3 C A P I T A L M A R K E T S A C T I V I T Y (M & A A N D F I N A N C I N G ) Will May be better than April? Month-to-date financings in May totalled $38.9 million and has commenced slowly - just like April. The month of May (so far) has registered seven deals, all except one greater than $5 million. No deals were greater than $10 million, with the capital raise by EveryZing being the largest at $8.3 million. The average value for April was $6.5 million on 21 financings. The March average was $6.6 million on 24 financings. Except for two deals (Kaixin001.com and Collective Media) all were below $20 million for the last three months and a total of four deals were greater than or equal to $15 million. Financing Activity Last Three Months 180.0 6.8 160.0 6.6 140.0 6.4 120.0 6.2 100.0 6.0 (US$m) (US$m) 80.0 5.8 60.0 5.6 40.0 5.4 20.0 5.2 0.0 5.0 Mar-09 Apr-09 May-09 Total Average Figure 2. Financings, Last Three Months Source. Company reports Ever yZing largest deal in May: A week into May and EveryZing tops the list with a $8.3 million raise, followed by Gist at $6.8 million. The month so far has seen four deals about the $6 million mark. For additional details, see Figures 23 and 24 (at end of note). Further, the month of May also witnessed the spin-off of StumbleUpon from E-bay on a $29 million valuation. E-bay had bought StumbleUpon for $75 million.
- 4. (US$m) 0.0 5.0 10.0 15.0 20.0 25.0 30.0 35.0 StumbleUpon Kaixin001.com Source. Company reports Collective Media GOOM Radio Vidyo Marin Software raising $56.9 million. The Rubicon Project Buzznet FreeWheel SendMe Inc. Figure 3. Capital Market Activity, Last Three Months LendingClub Miva Auditude Conductor Inc. Cellufun Glam Media Visible Measures SuperSecret GoViral EveryZing ScanScout Batanga Gist Azuki Systems I Love Rewards Greystripe TimeBridge DocuSign DoubleTwist OMGPOP IMShopping Socialtext Apture Mixercast Simulmedia Tynt SoundCloud AnySource Media Pixazza Financing & M/A Summary - Last Three Months TubeMogul Tribal Nova Sports Composite Tripbase Resonate Networks Hunch Bit.ly Socialcast Brandtology Scan & Target AdultSpace Myngle Jodange 33Across Three Melons Foodista Apr-09 Mar-09 May-09 Page 4 companies raising over $63.4 million (Figure 4). The Ad Network sector has the next highest totals, with seven companies Media is the most active sector: Activity over the last three months was busiest in the Media sector, with eight
- 5. Page 5 Capital Market Activity by Sector - Last Three Months 70.0 60.0 50.0 40.0 (US$m) 63.4 30.0 56.9 49.5 20.0 39.7 30.2 27.6 10.0 18.3 14.4 12.0 12.0 8.9 6.8 5.5 5.0 4.7 4.1 4.1 3.1 2.5 2.0 2.0 2.0 1.3 1.3 0.6 0.0 Comment/Reputation Social Commerce Gaming Visual Commerce Travel Wiki Media Mobile Collaboration Publishing Microblog Online Learning Mobile Ad Widget Search Lending Infrastructure Social Networks SAS Video Aggregation Virtual World Crowdsourced Ad Network Analytics Content # companies 8 7 5 5 2 5 2 3 1 1 2 1 1 1 1 1 1 1 1 1 1 1 1 1 1 Figure 4. Capital Market Activity, by Sector, Last Three Months Source. Company reports C A P I T A L M A R K E T S A C T I V I T Y (P R I C E P E R F O R M A N C E ) Web 2.0 Index outperforms: Our W eb 2.0 index (market-cap weighted) essentially mirrored the performance of the NASDAQ composite index from mid-2008 until recently when it has moved higher than the NASDAQ index (Figure 5).
- 6. Page 6 Web 2.0 Index Price Performance 120 100 80 60 40 20 0 5/12/2008 5/26/2008 6/9/2008 6/23/2008 7/7/2008 7/21/2008 8/4/2008 8/18/2008 9/1/2008 9/15/2008 9/29/2008 10/13/2008 10/27/2008 11/10/2008 11/24/2008 12/8/2008 12/22/2008 1/5/2009 1/19/2009 2/2/2009 2/16/2009 3/2/2009 3/16/2009 3/30/2009 4/13/2009 4/27/2009 5/11/2009 ^COMP - Share Pricing Index: Web 2.0 X (Market Cap) Figure 5. Web 2.0 Price Performance Source. Capital IQ A positive week: The companies in our universe had mixed stock price performances over the past week (for stocks with prices greater than $1) (Figure 6), with 22 companies showing positive returns on the week. Tree.com (TREE-NASDAQ) led the group with a 27.5% return while Beyond Commerce, Inc. (BYOC-OTCBB) had the worst return, dropping 21.8% in the week.
- 7. Page 7 1 Week P rice P erformance Tree.Com, Inc. 27.5% United Online Inc. 27.5% Y nk K orea Inc. 21.9% Webz en Inc. 14.3% 12.2% LookS mart, Ltd. 11.4% CDC Corp. K ings of t Co. Ltd. 10.4% Gamania Digital Entertainment Co., 9.0% Cy berplex Inc. 8.7% NEOWIZ Games Corporation 8.5% 8.0% Modern Times G roup Mtg A B 7.9% HanbitS of t, Inc. 6.0% PhotoChannel Netw orks Inc. S park Netw orks , Inc. 3.8% G igaMedia Ltd. 3.6% Perfect World Co., Ltd. 2.8% NetDragon WebS of t, Inc. 2.4% 2.2% A Q Interactiv e, Inc. 1.9% Y edangOnline Corp. Openw ave S y s tems Inc. 0.8% A ctoz S of t Co., Ltd. 0.7% Neteas e.com Inc. 0.7% Giant Interactive G roup, Inc. 0.0% 0.0% Chines e Gamer International -0.7% Mix i, Inc. -1.1% Eolith Co. Ltd. IA C/InterA ctiveCorp. -1.1% S hutterf ly , Inc. -2.1% The9 Limited -2.1% -2.5% Open Tex t Corp. -2.7% S K Communications Co., Ltd. -3.2% XING A G S ohu.com Inc. -3.9% Tencent Holdings Ltd. -3.9% TheS treet.com, Inc. -4.2% Northgate Technologies Limited -4.5% -4.7% G ree, Inc. -5.0% G ameOn Co Ltd. -5.8% S handa Interactive Entertainment Ltd. V alueClick Inc. -6.0% DA DA S pA -8.2% Changy ou.com Limited -8.6% -11.7% Frogs ter Interactiv e Pictures A G -13.9% Ngi G roup Inc. -21.8% B ey ond Commerc e, Inc. -30.0% -20.0% -10.0% 0.0% 10.0% 20.0% 30.0% Figure 6. 1-Week Price Performance Source. Capital IQ
- 8. Page 8 INDUSTRY NEWS (PARTNERSHIPS, FINANCIAL RESULTS, NEW PRODUCTS) K ey Developments C ompany Headline Notes L ookS mart L td. Announc es Una u dited Cons olidated L ookS mart L td. a nnounc ed unaudited c ons olidated ea rnings res ults for the firs t qua rter ended March 31, 20 09. F or the qua rter, the L o okS mart, Ltd. (Nas daqG M: LOOK ) E a rnings R esults for the F irst Quarter E nded M arch 31, company's revenues were $13. 3 million, a 24% dec rea s e from $17. 5 million in the firs t qua rter of 2008 and a 11% dec reas e from $14. 9 2009 million in the fourth quarter of 2008. Net loss for the quarter was $2. 0 million, or $0. 12 per sha re compa red to net los s for the first quarter of 2008 of $0. 5 million, or $0. 02 per sha re and net loss for the fourth quarter of 2008 of $12.4 mil lion, or $0. 73 per s ha re. L oss from c ontinuing opera tions for the quarter was $2. 1 million or $0 .13 per s ha re compa red to a los s from continuing opera tions in the first qua rter of 2008 of $0.2 mi llion or $0.01 per s hare a nd los s from co ntinuing opera tions for the fourth quarter of 2008 of $11.4 mil lion. Non-G AAP net los s for the quarter wa s $1. 6 million compared to non-G AAP net income of $0. 8 million in the firs t quarter of 2008 a nd non-G AAP net los s for the fourth quarter of 2008 of $1.1 million. C apita l expenditures for the quarte r were $0. 9 million, c ompared to $1. 0 million in the fourth qua rter of 2008, a nd $0. 6 million in the firs t quarter of 2008. L os s from operations was $2. 2 million compa red with $0. 61 million for the s a me period la st y ear. L S NAP I ntera ctive Inc. B eta -La unches S NAP I ntera ctive I nc. announced the beta la unch of AreY ouInteres ted. com, a sta nd-a lone online dating website incorporating a Fa cebook S NAP Interactive, Inc . (OT CB B: S TVI) AreY ouI nteres ted. com Online D ating W ebs ite Us ing Connec t integra tion. AreY ouI nterested.c om repres ents a n expand ed version of S NA P 's popular F a cebook P latform da ting applica tion 'Are F acebook (R ) C onnect Y ou I nteres ted,' which pres ently ha s more than 13 million us ers. T he website has been built to include a number of unique features for an online dating website. B y utilizing F acebook C onnec t, us ers c an login to AreY ouI nteres ted.com with their Fa cebook identity a nd allow th e site to a cc ess the member's exis ting F a cebook profile informa tion. Additiona lly, us ers are a ble to s ha re content a nd ac tions ta k en on AreY ouInteres ted. com with their friends ba ck on F a cebook for a b etter ov era ll ex perience. W ith Fa cebook C onnect, users benefit from the following fea tures : T rusted Au thentica tion-ea s ily a uthentica te into partner si tes us ing their F ac ebook ac count; R eal I dentity-leverage their rea l identity a cros s the W eb i n a trus ted envi ron ment; Fri end Link ing-tak e their friends with them wherever they go, enabling trus ted s ocia l context any where on the W eb; Dynamic P ri vac y-a s surance that the s ame priva cy s ettings us ers hav e s et up on F acebook will follow them whe Changy ou.com Limited R eports U naudited C onsolidated Changy ou.com Limited reported unaudited c ons olidated ea rnings res ults for the firs t qua rter ended March 31, 2009. F or the qua rter, the C hang yo u. c om L imited E a rnings R esults for the F irst Quarter E nded M arch 31, company's tota l revenues increa s ed 6% qua rter-over-qua rter and 50% yea r-ov er-year to $61.6 million c ompared to total rev enue of $41 (Nas daqG S : C YOU) 2009; P rov ides E arnings G uidance for the S econd million for the s ame quarter a year ago. T he inc reases were mainly a ttributable to a n increa s e in T LB B rev enues as a result of user base Quarter of 2009 expans ion and enha nced us er loy a lty , a s well a s inc reased revenues from B lade Online ('B O'). Opera ting profi t increa s ed 12% qua rter-over- quarter and 79% ye ar-ov er-year to $37. 9 million compared to operating profi t of $21.2 million for the same qua rter a y ea r a go. N et income increa s ed 15% quarter-over-qua rter a nd 120% year-over-y ear to $33.5 mil lion c ompa red to net inc ome of $15. 2 million for the s ame quarter a y ea r a go. N on-G AAP net inc ome increas ed 13% qua rter-over-quarter and 100% yea r-over-yea r to $34.4 million compa red to net income of $17.2 mi llion for the s a me qua rter a y ea r a go. B as ic and fully dil uted ea rnings per A DS were $0.71, c ompared to $0. 32 in the firs t quarter of 2008. Non-G AAP fully diluted ea rnings per ADS were $0. 72, compared to $0.36 in the firs t quarter of 2008. Inc ome before inc ome ta x expens S ohu.com I nc. R eports Una udited Cons olida ted E arnings S ohu.com I nc. repo rted una udited cons olida ted earnings results for the first quarter ended M a rch 31, 2009. G AAP net income of $44. 6 S ohu. c om Inc . (Nas daqG S : S OHU) R es ults for the F irst Quarter E nded M arch 31, 2009 ; million or $1.15 per fully diluted s ha re. G AAP net inc ome was 2. 1 times that of first quarter 2008. G AAP net income included $33.5 million of P rovides E arnings G uida nc e for the S econd Quarter of G AAP net income contributed by online ga me bus iness with a 15% qua rter-on-quarter increas e or a 120% yea r-on-year inc rease. N on-G AAP 2009 net income (i.e. , exc luding sha re-bas ed compensation expense) of $46. 9 million, or $1.20 per fully diluted share, ex ceeding the high end of company guida nc e of $1. 10 by 10 cents . N on-G AAP net income increas ed 87% y ea r-on-year. N on-G AAP n et income included $34.4 million of Non-G AAP net income c ontributed by online ga me busines s with a 13% qua rter-on-quarter increas e or a 100% y ea r-on-year increas e. T otal revenues were $115. 7 million, repres enting a dec reas e of 5% s equentially a nd increa se of 36% yea r-on-y ea r. The company als o reported operating profi t of $50,037, 000, income before inc ome tax expens e of $51, 160, 000 a nd income from continuing operations of $44,574, 000 agains t operating profit of $30, 531,000, income before income tax expens e of $30,740, 000 a nd income from c ontinuing operations of $21 T heS treet.c om, Inc . (Nas daqG M: T S CM) T heS treet.com I nc. R eports E arnings R es ults for Fi rs t T heS treet. com Inc. reported earnings results for first qua rter ende d M arch 31, 2009. F or the qua rter, the c ompany re ported net loss of Quarter E nded Marc h 31, 2009 ; Announc es N on C ash $45,675, 349 and los s attributa ble to c ommon s tockholders of $45,771, 773 or $1. 50 los s per diluted sha re on tota l rev enues of $14, 026,864 Impa irment C harges in F irst Q ua rter of 2009 compared to net income of $2,446 ,649 and inc ome attributable to common s tock holders of $2, 350,225 or $0. 07 per diluted s ha re on total revenues of $18, 947, 985 for the s a me period a year a go. O pera ting los s was $29, 449, 197 compared to operating income of $1, 909, 114 for the sa me period a yea r a go. L os s from continuing operations before in come ta xes of $29,449, 197 compa red to i ncome from continui ng opera tions before incomes taxes of $2, 595, 308 for the s a me period a y ea r a go. L oss from c onti nuing operations of $45, 676,274 compa red to loss from c ontinui ng operations of $2, 449,380 for the s ame period a y ear ago. Adj usted E B I T DA was negative at $620, 400 compa red to a djusted E B IT DA of $3, 871,084 for the s a me period a y ear ago. C apital expenditures were $647, 948 compa red to c apita l ex penditures of $1,390, 341 for the same period a yea r a go. E B I TD A was negative at $28,207, 672 compa red to E B IT DA of $3, 169,987 for the s ame period a y W izz ard S oftwa re C orporati on has filed a S helf W izza rd S oftwa re C orporation has filed a S helf R egistration in the amount of $5.70 million. W izz ard S oftware Co rporation R egis tra tion in the a mount of $5. 70 million . (A ME X: WZE ) China G ateway Deleted From OT C B B China G ateway C orporation’s common stock has been deleted from O T C B ulletin B oa rd effec tiv e Ma y 6, 2009 on a cc ount of its fa ilure to C hin a G ateway Co rporation comply with NAS D 6530. T he compa ny ha s been added to NB B . (OT CPK : C G WY) Mel R ic h to S tep Down a s P resident of S NM G lobal S NM G lobal Holdings announced tha t the company P res ident Mel R ich will be s tepping down immediately a nd the c ompany 's day by day S NM G lobal H olding s (OTCP K:S NMN) Holdings respons ibilities will be ha ndled by newly hired C E O W illia m B rowning. M r. R ich was appointed interim P res ident in 2008 and will remain with the compa ny as a S pecia l Adv isor to B oard Direc tors for E nterta inment S ervices . P erfect W orld Co. , L td. Announces B ra nd N ew 2D P erfect W orld Co. , L td. a nnou nced that it pla ns to releas e a brand new 2D turn-bas ed ca rtoon MM OR P G 'Fa ntasy Zhu Xi a n' in 2009. P erfec t World C o. , Ltd. MM O R P G 'F anta sy Z hu Xia n' F anta sy Z hu Xian' is P erfect W orld's first 2D turn-ba s ed c arto on M MOR P G , which is run on the company 's proprieta ry E P AR CH engine. T he (Nas daqG S : PW R D) game is ba s ed on a popu la r internet fanta s y novel 'Z hu Xian. ' P l ayers will be ushered into the unk nown world of 'Zhu X ia n' to unrav el a series of my s teries . 'F anta sy Z hu Xia n' will a lso fea ture a number of new chara cters which will intera ct with the origina l c ha ra cters of 'Zhu X ian' to generate new stories . G a mania D igita l E ntertainment C o. L td. R eports G a ma nia Di gita l E ntertainment C o. L td. reported cons olidated earnings res ults for the firs t quarter M a rch 31, 2009. F or the quarter, the G am ania Digital E ntertainmen t C o. , Cons olida ted E arnings R es ults for the F irs t Quarter company reported a n opera ting revenues were T W D 1, 363,614, 000, operating income was TW D 217, 031,000, net income was T W D L td. (G TS M: 6180) Ma rc h 31, 2009 165,308, 000 and ea rnings per share wa s T W D 1. 13. United O nline I nc. R eports E a rnings R esults fo r the F irst United Online I nc. reported ea rnings results for the first qua rter ended M a rch 31, 2009. F or the period, the c ompa ny reported cons olida ted U nited Online Inc. (N as daqG S :U NT D) Quarter E nded Marc h 31, 2009; P rovides E a rnings revenues were $263. 6 million, an increa se of 116% against the yea r-ago qua rter. T he inc reas e wa s prima ri ly a ttributable to the company's G uida nce for the S econd Q ua rter of 2009; D eclares a cquis ition of F TD in Augus t 2008. Adjus ted OI B DA was $61. 5 million, an increase of 59% against the year-ago quarter. G A AP diluted net Quarterly C a s h D ividend P a ya ble on Ma y 29, 2009 income per s ha re applica ble to common s tock holders wa s $0 .20, a n increas e of 11% aga inst the y ea r-ago qua rter. Adjus ted diluted net income per s ha re applica ble to common s tock holders wa s $0 .35, a n increas e of 13% aga inst the y ea r-ago qua rter. C a sh flows from opera tions were $43. 6 million, an increa se of 50% a ga inst the year-a go quarter. T he increa s e was primarily attributa bl e to the F TD a cquis ition . Opera ting inc ome was $37. 4 million a ga ins t $20.4 million for the sa me period earlier. I ncome before inc ome ta x es were $29.6 million a ga ins t $22.0 million for the sa me period earlier. N et income a nd net income a pplica ble to c ommon stock holders were $17.0 million or $0. 20 per ba s ic a nd diluted ea rnings per s ha re ag ainst net inc ome and net income applic able to common s toc k holders of $13. 0 million or $0.18 pe