Transforming Data Streams with Kafka Connect: An Introduction to Single Messa...
09 08 18 Web 2.0 Weekly
1. SOFTWARE & SERVICES 18 AUGUST 2009
DAVID SHORE, CFA, MBA 416.860.6784
WEB 2.O WEEKLY david.shore@researchcapital.com
Arun Thomas (Associate) 416.860.7666
VENTURE CAPITAL EXITS TAKING LONGER
SOFT WAR E CO MPAN IES TAK ING A BOUT 91 MONTH S TO EXIT
A recent research report published by SVB Financial elucidates how difficult it has been for venture capitalists to exit
their investment across various sectors. Data combined from Dow Jones Venture Source and SVB measures the time
and capital it takes for a venture-backed company to go public, be sold or go out of business. In the software sector,
the median exit multiple (calculated as the value of the company at the time of exit divided by the amount of capital
invested in the company) since 2001 was 0.0x to 0.1x compared to 3.7x to 10.7x between 1994 and 2001. Moreover,
the median time it takes to exit these companies is at an all-time high of 91 months (7.6 years).
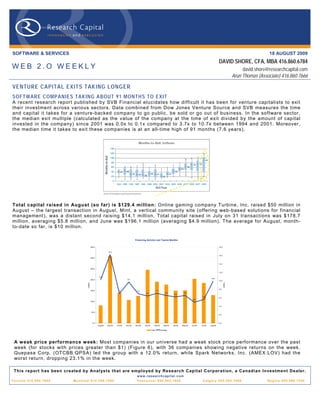
Total capital raised in August (so far) is $129.4 million: Online gaming company Turbine, Inc. raised $50 million in
August – the largest transaction in August. Mint, a vertical community site (offering web-based solutions for financial
management), was a distant second raising $14.1 million. Total capital raised in July on 31 transactions was $178.7
million, averaging $5.8 million, and June was $196.1 million (averaging $4.9 million). The average for August, month-
to-date so far, is $10 million.
Financing Activity Last Twelve Months
350.0 18.0
16.2
16.0
300.0
14.0
250.0
12.0
10.3
10.0
200.0 9.7
10.0
(US$m)
(US$m)
8.0
150.0 7.0 7.0 7.1
6.5 6.6 6.6
6.2
5.6
6.0
5.0
100.0
4.0
50.0
2.0
0.0 0.0
Aug-08 Sep-08 Oct-08 Nov-08 Dec-08 Jan-09 Feb-09 Mar-09 Apr-09 May-09 Jun-09 Jul-09 Aug-09
Total Average
A w eak price performance w eek: Most companies in our universe had a weak stock price performance over the past
week (for stocks with prices greater than $1) (Figure 6), with 36 companies showing negative returns on the week.
Quepasa Corp. (OTCBB:QPSA) led the group with a 12.0% return, while Spark Networks, Inc. (AMEX:LOV) had the
worst return, dropping 23.1% in the week.
This report has been created by Anal ysts that are employed by Research Capital Corporation, a Canadian Investment Dealer.
www.researchcapital.com
Toronto 416.860.7600 Montreal 514.399.1500 Vancouver 604.662.1800 Calgary 403.265.7400 Regina 306.566.7550
2. Page 2
THE WEB 2.0 UNIVERSE
Ninety-one public Web 2.0 companies identified: Our Web 2.0 universe contains 91 companies, with a combined market
cap of ~$62 billion (Figure 1). The median market cap for the group is ~$60 million, with average trailing revenue of
~$159.6 million (median $54.9 million). The companies are also generally profitable, with a median EBITDA margin of
13.1%. On a valuation basis, the overall average is 4.8x trailing revenue (median 1.8x) and 11.0x trailing EBITDA (median
9.8x). Twenty-one of the companies have more than 500 employees.
C omparable C ompany Analys is > Web 2.0
Trading C urrent US D Market US D L TM Total US D L TM Total E B ITDA TE V/L TM TE V/L TM
C ompany Name L TM as of Tic ker E xc hange C urrenc y HQ P ric e C ap ($m) R ev ($m) E B ITDA ($m) % R evenue E B ITDA E mployees
Accelerize New Media, Inc. 3/31/2009 AC L Z OT C B B US D United S ta tes 0. 57 15.8 4.1 (4.4) NM 5. 1x - 11
Actoz S oft C o. , L td. 3/31/2009 A052790 K OS E KR W S outh K orea 21,300 146.0 91. 8 19.9 21.7% 1. 3x 5.9x NA
AQ Interactive, Inc. 3/31/2009 3838 TS E JPY J a pa n 49,600 28.6 65. 5 4.1 6.3% - - NA
As s ocia ted Media Holdings Inc. 6/30/2007 AS MH OT C P K US D United S ta tes 0. 01 0. 6 0.1 (2.3) NM 15.6x - 3
B igs tring C orp. 3/31/2009 BSGC OT C B B US D United S ta tes 0. 02 1. 1 0.1 (2.0) NM 32.4x - 4
B etawave C orporation 3/31/2009 B W AV OT C B B US D United S ta tes 0. 06 1. 8 8.4 (12.6) NM - - 53
B eyond C ommerce, Inc. 3/31/2009 B Y OC OT C B B US D United S ta tes 0. 27 12.5 7.1 (9.5) NM 2. 4x - 69
B right T hings plc 9/30/2008 AIM:B G T AIM GBP United K ingdom 0. 01 4. 1 0.3 (1.8) NM 14.9x - 9
B roadW ebAs ia Inc. 9/30/2008 BWBA OT C P K US D United S ta tes 0. 23 19.5 0.0 (4.6) NM - - 46
C DC C orp. 3/31/2009 C HIN.A Na s daqG S US D Hong K ong 2. 54 269.5 389.9 30.8 7.9% 0. 7x 9.2x 2,227
C hangyou.com Limited 6/30/2009 C Y OU Na s daqG S US D C hina 37. 35 2,054.3 241.2 147. 2 61.0% 7. 4x 12.1x 628
C hina G ateway C orpora tion 9/30/2008 CGWY OT C P K US D United S ta tes 0. 02 0. 3 6.7 (6.6) -98.9% 0. 0x - 37
C hines e G amer International 3/31/2009 G T S M:3083 GTS M TWD T aiwan 412 1,051.6 56. 1 31.4 56.0% 17.6x 31.4x NA
C L IC K E R Inc. 5/31/2009 C LK Z OT C B B US D United S ta tes 0. 01 0. 4 2.5 (1.2) -45.8% 0. 2x - 22
C ornerW orld C orporation 1/31/2009 CWR L OT C B B US D United S ta tes 0. 06 5. 7 1.3 NM NM 5. 5x - NA
C yberplex Inc. 6/30/2009 T S X :C X TS X C AD C anada 2 97.0 88. 1 9.5 10.8% 0. 9x 8.1x NA
DADA S pA 6/30/2009 C M:DA CM E UR Ita ly 6. 09 139.0 232.5 30.5 13.1% 0. 8x 6.1x NA
DXN Holdings B hd 5/31/2009 DXN K LS E MY R Ma la ys ia 0. 49 31.5 75. 7 10.9 14.4% 0. 6x 4.2x NA
Dibz Interna tiona l, Inc. NA DIB Z OT C P K US D United S ta tes 0. 00 0. 0 NA NM NM - - NA
Digita lP os t Intera ctive, Inc. 3/31/2009 DG L P OT C B B US D United S ta tes 0. 05 3. 9 0.7 (2.6) NM 7. 5x - 7
Digita lT own, Inc. 5/31/2009 DG T W OT C B B US D United S ta tes 1. 30 35.6 NM (2.5) NM - - 3
Dolphin Digita l Media, Inc. 3/31/2009 DP DM OT C B B US D United S ta tes 0. 39 20.2 0.8 (3.7) NM 27.3x - NA
E olith C o. L td. 12/31/2008 A041060 K OS E KR W S outh K orea 820 47.2 14. 6 (3.5) -23.6% 3. 4x - NA
E xtens ions , Inc. 3/31/2009 E XT I OT C P K US D United S ta tes 0. 08 3. 6 NM NM NM - - 2
F luid Mus ic C ana da , Inc. 3/31/2009 T S X :F MN TS X C AD United S ta tes 1. 20 56.8 5.0 (6.9) NM 9. 9x - NA
F rogs ter Intera ctive P ictures AG 12/31/2008 FR G XT R A E UR G erma ny 14. 00 49.8 3.2 (6.2) NM 14.9x - NA
G a mania Digital E ntertainment C o., Ltd. 3/31/2009 6180 GTS M TWD T aiwan 56. 70 261.7 125.9 20.9 16.6% 1. 9x 11.4x NA
G a meO n C o L td. 6/30/2009 3812 TS E JPY J a pa n 103,000 105.5 77. 6 19.0 24.5% 0. 4x 1.8x NA
G eoS entric O yj 3/31/2009 G E O 1V HL S E E UR F inla nd 0. 05 63.2 6.0 (15.4) NM 9. 9x - 108
G ia nt Intera ctive G roup, Inc. 3/31/2009 GA NY S E US D C hina 8 1,734.5 218.9 NM NM - - 1,570
G igaMedia Ltd. 3/31/2009 G IG M Na s daqG S US D T aiwan 4. 41 240.4 183.6 NM NM 0. 9x - 751
G ra vity C o. , L td 3/31/2009 GR VY Na s daqG M US D S outh K orea 2. 01 55.9 45. 5 12.5 27.5% - - 469
G ree, Inc. 6/30/2009 T S E :3632 TS E JPY J a pa n 7,930 1,880.7 147.8 88.8 60.1% 12.0x 19.9x NA
G ungHo O nline E ntertainment, Inc. 3/31/2009 3765 OS E JPY J a pa n 230,000 279.2 109.2 19.6 18.0% 2. 3x 12.8x NA
Ha nbitS oft, Inc. 3/31/2009 A047080 K OS E KR W S outh K orea 4,125 71.8 54. 9 (14.7) -26.8% 1. 0x - NA
IAC /InterActiveC orp. 6/30/2009 IAC I Na s daqG S US D United S ta tes 18. 40 2,436.2 1,392.3 52.7 3.8% 0. 5x 13.2x 3,200
IAS E nergy, Inc. 1/31/2009 IAS C .A OT C B B US D C anada 0. 12 8. 4 0.0 (0.8) NM - - NA
is eemedia Inc. 3/31/2009 IE E T S XV C AD C anada 0. 06 2. 8 1.5 (4.9) NM 1. 2x - NA
J umbuck E ntertainment P ty Ltd. 12/31/2008 AS X :J MB AS X AUD Aus tra lia 0. 36 14.4 14. 7 5.5 37.2% 0. 6x 1.7x 72
K AB Dis tribution Inc. 3/31/2009 T S X :K AB TS X C AD C anada 1 80.8 74. 2 8.8 11.9% 1. 2x 9.7x NA
K ings oft C o. L td. 3/31/2009 3888 S E HK HK D C hina 8 1,182.3 129.0 52.0 40.3% 9. 2x 22.7x 2,271
L ingo Media C orpora tion 3/31/2009 T S X V : LM T S XV C AD C anada 1. 00 11.2 0.9 (1.6) NM 10.9x - NA
L iveW orld Inc. 3/31/2009 LV W D OT C P K US D United S ta tes 0. 06 1. 7 11. 4 (0.0) -0.4% 0. 1x - NA
L ookS mart, L td. 6/30/2009 LO O K Na s daqG M US D United S ta tes 1. 20 20.5 56. 8 (4.4) -7.8% - - 90
Magnitude Informa tion S ys tems Inc. 3/31/2009 MAG Y OT C B B US D United S ta tes 0. 01 3. 0 0.1 (3.1) NM - - 14
Mixi, Inc. 6/30/2009 2121 TS E JPY J a pa n 604000. 00 984.0 129.6 43.7 33.8% 6. 7x 19.9x NA
Modern T imes G roup Mtg AB 6/30/2009 MT G B OM SEK S weden 288. 00 2,597.6 1,878.9 288. 7 15.4% 1. 7x 10.9x 2,969
MO K O .mobi L imited 12/31/2008 MK B AS X AUD Aus tra lia 0. 08 5. 3 1.2 (2.4) NM 3. 5x - NA
Myria d G roup AG 12/31/2008 MY R N SWX C HF S witzerland 4. 26 84.1 40. 0 0.8 1.9% 2. 3x - 405
NE O W IZ G a mes C orporation 12/31/2008 A095660 K OS E KR W S outh K orea 31600. 00 528.5 196.7 52.8 26.8% 2. 6x 9.8x NA
NetDragon W ebS oft, Inc. 3/31/2009 777 S E HK HK D C hina 6 404.4 86. 9 34.4 39.5% 3. 1x 7.9x 2,426
Netea s e.com Inc. 6/30/2009 NT E S Na s daqG S US D C hina 40. 21 5,204.2 471.9 297. 1 63.0% - - 3,109
NeuL ion Incorpora ted 3/31/2009 T S X :NLN TS X C AD C anada 1. 10 113.2 18. 1 (11.8) -65.2% 5. 8x - 237
NeXplore C orporation 6/30/2008 NXP C OT C P K US D United S ta tes 1 37.9 0.7 (6.2) NM - - NA
Ngi G roup Inc. 3/31/2009 2497 TS E JPY J a pa n 32800. 00 43.0 93. 6 11.2 12.0% 0. 0x 0.2x NA
Northga te T echnologies Limited 6/30/2009 590057 BSE INR India 34. 30 24.4 81. 3 (40.6) -50.0% 0. 3x - NA
O pen T ext C orp. 3/31/2009 OT E X Na s daqG S US D C anada 38. 15 2,007.6 782.6 199. 2 25.5% 2. 6x 10.4x 3,400
O penwa ve S ys tems Inc. 6/30/2009 OP W V Na s daqG S US D United S ta tes 2. 80 233.3 191.7 5.3 2.8% 0. 6x 23.4x NA
P erfect W orld C o., Ltd. 6/30/2009 PWRD Na s daqG S US D C hina 36. 15 1,777.9 255.4 142. 0 55.6% 0. 5x 0.8x 2,096
P NI Digita l Media Inc. 3/31/2009 T S XV :P N T S XV C AD C anada 1. 60 49.4 19. 5 0.5 2.3% 2. 5x - NA
Q uepas a C orp. 3/31/2009 QP S A OT C B B US D United S ta tes 1 17.8 0.1 (10.8) NM - - 74
O AO R B C Informa tion S ys tems 12/31/2007 R BCI R TS US D R us s ia 1. 05 145.7 146.9 19.2 13.1% 0. 0x 0.2x NA
S handa Intera ctive E ntertainment Ltd. 3/31/2009 S NDA Na s daqG S US D C hina 45. 40 3,031.3 569.9 260. 8 45.8% - - 3,124
S hutterfly, Inc. 6/30/2009 S FLY Na s daqG S US D United S ta tes 14. 75 375.5 218.6 27.3 12.5% 1. 4x 11.4x 514
S K C ommunications C o., L td. 12/31/2008 A066270 K OS E KR W S outh K orea 9850. 00 328.0 182.8 11.9 6.5% 1. 8x 27.6x NA
S NAP Intera ctive, Inc. 3/31/2009 S TVI OT C B B US D United S ta tes 0 4. 3 3.3 0.9 28.0% 0. 9x 3.1x 11
S NM G lobal Holdings 9/30/2008 S NMN OT C P K US D United S ta tes 0. 00 0. 0 2.0 (0.7) -34.8% 1. 1x - 33
S ocia l Media V enures , Inc. 12/31/2008 S MV I OT C P K US D United S ta tes 0 0. 0 0.1 (0.1) -60.6% 4. 5x - NA
S ocia lwis e, Inc. 3/31/2009 S C LW OT C B B US D United S ta tes 0. 68 30.1 0.0 (4.8) NM - - NA
S ohu.com Inc. 6/30/2009 S OHU Na s daqG S US D C hina 59. 92 2,297.0 485.1 209. 6 43.2% 3. 7x 8.5x 3,197
S park Networks , Inc. 6/30/2009 LO V AME X US D United S ta tes 2 43.2 50. 5 10.8 21.3% 0. 8x 3.8x 183
S pectrumDNA, Inc. 3/31/2009 S P XA OT C B B US D United S ta tes 0 11.2 0.1 (2.6) NM - - 7
T encent Holdings L td. 6/30/2009 700 S E HK HK D C hina 115 26,804.0 1,390.1 685. 2 49.3% 21.1x 42.8x 6,194
T he P a rent C ompa ny 8/2/2008 K IDS .Q OT C P K US D United S ta tes 0. 02 0. 4 112.0 (13.5) -12.0% 0. 2x - 347
T he9 Limited 12/31/2008 NC T Y Na s daqG S US D C hina 8. 28 211.2 250.3 85.4 34.1% - - 1,626
T heS treet.com, Inc. 3/31/2009 TSCM Na s daqG M US D United S ta tes 2. 24 68.6 67. 0 1.9 2.9% 0. 1x 2.1x 310
T otal S port Online AS 3/31/2006 T OS O O T C NO NO K Norway 0. 03 0. 1 2.2 (1.1) -50.6% 4. 6x - 16
T ree. C om, Inc. 6/30/2009 TR E E Na s daqG M US D United S ta tes 8. 90 96.1 216.6 (1.0) -0.4% 0. 5x - 700
Unis erve C ommunications C orp. 2/28/2009 T S X V : US S T S XV C AD C anada 0. 05 1. 0 23. 5 0.1 0.2% 0. 2x - NA
United O nline Inc. 6/30/2009 UNT D Na s daqG S US D United S ta tes 7. 31 612.9 949.8 203. 2 21.4% 0. 9x 4.3x 1,469
UO MO Media , Inc 1/31/2009 UOMO OT C B B US D C anada 0 10.7 0.6 (0.5) -78.2% 17.4x - NA
V a lueC lick Inc. 6/30/2009 V C LK Na s daqG S US D United S ta tes 10 872.4 563.6 99.0 17.6% 1. 3x 7.4x 1,189
V O IS , Inc. 3/31/2009 V OIS OT C B B US D United S ta tes 0 4. 1 0.0 (1.1) NM - - 4
W ebzen Inc. 3/31/2009 W ZE N Na s daqG M US D S outh K orea 2. 75 32.6 22. 8 (0.5) -2.4% - - NA
W izza rd S oftware C orpora tion 3/31/2009 W ZE AME X US D United S ta tes 0. 47 23.7 5.6 (5.3) -94.5% 4. 5x - 110
W orlds . com Inc. 3/31/2009 W DDD OT C B B US D United S ta tes 0. 09 4. 7 0.0 (0.8) NM - - 1
W oozyF ly, Inc. 3/31/2009 W ZY F OT C B B US D United S ta tes 0. 15 2. 6 NM NM NM - - NA
W ynds torm C orporation NA W Y ND OT C P K US D United S ta tes 0. 10 1. 8 NA NM NM - - NA
XING AG 3/31/2009 O 1B C XT R A E UR G erma ny 27. 50 204.1 53. 3 16.6 31.2% 2. 8x 9.1x 239
Y edangO nline C orp. 12/31/2007 A052770 K OS E KR W S outh K orea 8,870 110.6 54. 5 11.7 21.6% 2. 2x 10.3x NA
Y nk K orea Inc. 3/31/2009 A023770 K OS E KR W S outh K orea 4,770 20.2 10. 4 (0.8) -7.6% - - NA
High 26,804.0 1,878.9 685.2 63.0% 32.4x 42.8x 6,194
L ow 0. 0 0.0 -40.6 -98.9% 0. 0x 0.2x 1
Average 688.8 159.6 36.9 6.9% 4.8x 11.0x 913
Media n 60.0 54.9 0.9 13.1% 1. 8x 9.8x 405
Figure 1. Web 2.0 Universe Summary
Source. Capital IQ
3. Page 3
CAPITAL MARKETS ACTIVITY (M&A AND FINANCING)
Total capital raised in August (so far) is $129.4 million: Online gaming company Turbine, Inc. raised $50 million in
August – the largest transaction in August. Mint, a vertical community site (offering web based solutions for financial
management), was a distant second raising $14.1 million. Total capital raised in July on 31 transactions was $178.7
million, averaging $5.8 million, and June was $196.1 million (averaging $4.9 million). The average for August, month-to-
date so far, is $10 million.
Financing Activity Last Twelve Months
350.0 18.0
16.2
16.0
300.0
14.0
250.0
12.0
10.3
10.0
200.0 9.7
10.0
(US$m)
(US$m)
8.0
150.0 7.0 7.0 7.1
6.5 6.6 6.6
6.2
5.6
6.0
5.0
100.0
4.0
50.0
2.0
0.0 0.0
Aug-08 Sep-08 Oct-08 Nov-08 Dec-08 Jan-09 Feb-09 Mar-09 Apr-09 May-09 Jun-09 Jul-09 Aug-09
Total Average
Figure 2. Financings, Last Twelve Months
Source. Company reports
4. (US$m)
0.0
10.0
20.0
30.0
40.0
50.0
60.0
70.0
80.0
90.0
People Media
Super Rewards
Turbine
Friends Reunited
AdLink Internet Media
Source. Company reports
Pandora Media
xoopit
MediaMath
Edo Interactive
Sugar Inc.
Kontera Ltd.
Ning
Tumri
Mint
Boku
RichRelevance
QuickPlay Media
Grab Networks
Wimba
Figure 3. Capital Market Activity, Last Three Months
Traffiq
AdChina
Causes
Goojet SAS
Bill.com
Outspark
Figures 23 and 24 (at end of note).
ConnectEdu
Acquia, Inc
beeTV
AdMeld Inc.
SBNation
blueKiwi Software SA
Nokeena
Metaversum
iMemories
Boxee
Bubble Motion
Invodo
Zoosk
Sense Networks
Gather
Taomee
MojoPages
Animoto
Quikr India Pvt. Ltd.
GameGround
OPEN Sports network
Nexage
StyleCaster
RingRevenue
TweetDeck
Z2Live
KODA
Crowdcast
YuMe
eRepublik
Busca
ClickFuel
Akademos
Newser LLC
ProtonMedia
Inigral
AdEx Media
Roblox
GROU.PS
Financing & M/A Summary - Last Three Months
OneTXT
my6sense
iLoop Mobile
Yapta
I Love Rewards
Comunitae
Lat49
Cliqset
Aloqa
ChessCube
Tributes.com
CoTweet
Cellufun
AdWhirl
LiquidPlanner
Picaboo
Glubble
Clikthrough
Cognitive Match Limited
TodaCell
BookFresh
People Capital
MashLogic
iSyndica
Masher Media
Jaxtr
Jul-09
Jun-09
Aug-09
Page 4
far) at $129.4 million. In addition, Friends Reunited was acquired for $42 million. For additional details on financings, see
in August. Mint was a distant second securing a $14.1 million round. Closely behind was RichRelevance raising $12.5
million. Of the total 13 transactions, eight were below $10 million each, bringing the total capital raised for August (thus
Turbine, Inc. raises $50 million: On the capital raise front, Turbine, Inc. raised $50 million, the largest transaction so far
5. Page 5
Ad Netw ork remains the most active sector in dollars raised: Following recent trends, Ad Networks as a sector saw
the most activity in dollars raised ($126.4 million), followed by the Social Network sector with 12 transactions, raising
$99.6 million (Figure 4).
Capital Market Activity by Sector - Last Three Months
140.0
120.0
100.0
80.0
(US$m)
126.4
60.0
99.6
40.0 80.0
69.9
64.2 64.0
20.0
35.0 32.6
24.0 22.3 21.5 19.3 19.1
13.0 12.5 12.0 10.7
5.0 4.1 3.2 3.0 1.0 1.0
0.0 0.5 0.5 0.0
Comment/Reputation
Mobile Payment
Communities
Online Dating
Gaming
Online Calendar
Enterprise
Mobile
Media
Collaboration
Online Learning
Microblog
Publishing
Online Lending
Music
Infrastructure
Blog
Search
Classified
Mobile Ad
SMS/Voice
Social Networks
Virtual World
Video
Ad Network
Analytics
Vertical
# companies
13 12 1 5 7 10 1 5 2 7 4 3 4 1 1 2 2 1 1 1 2 1 1 1 1 0
Figure 4. Capital Market Activity, by Sector, Last Three Months
Source. Company reports
CAPITAL MARKETS ACTIVITY (PRICE PERFORMANCE)
Web 2.0 index far outpaces NASDAQ recovery: Our Web 2.0 index (market-cap weighted) essentially mirrored the
performance of the NASDAQ composite index from mid-2008 until earlier this year. However, the index has recently had a
much stronger recovery relative to the NASDAQ index (Figure 5).
Web 2.0 Index Price Performance
130
120
110
100
90
80
70
60
50
40
8/18/2008
9/1/2008
9/15/2008
9/29/2008
10/13/2008
10/27/2008
11/10/2008
11/24/2008
12/8/2008
12/22/2008
1/5/2009
1/19/2009
2/2/2009
2/16/2009
3/2/2009
3/16/2009
3/30/2009
4/13/2009
4/27/2009
5/11/2009
5/25/2009
6/8/2009
6/22/2009
7/6/2009
7/20/2009
8/3/2009
8/17/2009
^COMP - Share Pricing Index: Web 2.0 X (Market Cap Weights) - Index Value
Figure 5. Web 2.0 Price Performance
Source. Capital IQ
6. Page 6
A w eak price performance w eek: Most companies in our universe had a weak stock price performances over the past
week (for stocks with prices greater than $1) (Figure 6), with 36 companies showing negative returns on the week.
Quepasa Corp (OTCBB:QPSA) led the group with a 12.0% return, while Spark Networks, Inc. (AMEX:LOV) had the worst
return, dropping 23.1% in the week.
1 Week P rice P erformance
Quepas a Corp. 12.0%
PNI Digital Media Inc. 8.1%
Openw ave S y s tems Inc. 6.9%
K ings oft Co. L td. 4.2%
NeuLion Incorporated 3.8%
NetDragon WebS of t, Inc. 3.7%
Tencent Holdings L td. 3.5%
My riad G roup A G 3.4%
XING A G 3.0%
Gree, Inc. 2.5%
Ngi G roup Inc. 1. 9%
Fluid Mus ic Canada, Inc. 1.7%
Eolith Co. L td. 0. 0%
DA DA S pA -0.2%
IA C/InterA ctiveCorp. -0.5%
GameOn Co L td. -0.7%
Open Tex t Corp. -0.8%
NEOWIZ Games Corporation -0.8%
Modern Times G roup Mtg A B -1.7%
Gamania Digital Entertainment -2.2%
Mix i, Inc. -2.3%
S K Communications Co., L td. -2.5%
Northgate Technologies Limited -2.6%
TheS treet.com, Inc. -2.6%
Y nk K orea Inc. -2.9%
Cy berplex Inc. -2.9%
United Online Inc. -3.2%
Perf ect World Co., L td. -3.3%
Frogs ter Interactive Pic tures A G -3.4%
LookS mart, L td. -4. 0%
HanbitS of t, Inc. -4.2%
G ravity Co., L td -4.3%
Chines e Gamer International -4.3%
Giant Interactive G roup, Inc. -4.6%
Changy ou.com Limited -5.1%
Y edangOnline Corp. -6.0%
S ohu.com Inc. -6.4%
S hutterf ly , Inc. -7.2%
A Q Interactive, Inc. -7.5%
CDC Corp. -7.8%
V alueClick Inc. -8.0%
S handa Interactive -9.1%
A ctoz S of t Co., L td. -9.6%
Tree.Com, Inc. -9.9%
G igaMedia L td. -10.7%
Neteas e.com Inc. -11.4%
The9 Limited -11.7%
Webz en Inc. -16.1%
S park Netw orks , Inc. -23.1%
-25.0% -20.0% -15.0% -10.0% -5.0% 0.0% 5.0% 10.0% 15.0%
Figure 6. 1-Week Price Performance
Source. Capital IQ
7. Page 7
INDUSTRY NEWS (PARTNERSHIPS, FINANCIAL RESULTS, NEW PRODUCTS)
K ey Developmen ts
C ompany Headline Notes
OA O R BC Info rm atio n S ys tem s V E B Files S uit W orth R U B 202. 3 Million Aga inst R B C V neshec onomba nk (V E B ) has lodged a s uit a ga inst the R B C I nforma tion S ys tems for the s um of R UB 202. 30 million (E UR 4. 52 million US D
(R TS : R B CI) Information S ys tems 6.41 mi llion) to the M os cow Arbitra tion Court. Ac cording to V E B , the la ws uit dema nds to rec over funds on bonds of R B C a c quired by V E B on
the stoc k exc ha nge in 2008.
P erfec t Wo rld C o. , Ltd. P erfec t W orld C o. , L td. ha s filed a S helf R egis tra tion in P erfec t W orld Co. , L td. ha s filed a S helf R egis tra tion in the a mount of $373. 30 million.
(N as daqG S :P W R D) the a mount of $373. 30 million.
P erfec t Wo rld C o. , Ltd. P erfec t W orld C o. L td. R eports U na udited C onsolida ted P erfec t W orld Co. L td. reported una udited c onsol ida ted ea rnings res ults for the sec ond qua rter ended J une 30, 2009 . For the quarter, tota l
(N as daqG S :P W R D) E a rnings R esults for the S ec ond Q ua rter E nded J une 30, revenues were R MB 521,326, 842 a ga inst R MB 334, 412,759 a y ea r a go. O pera ting profit wa s R MB 279,667, 909 a ga ins t R MB 165,957, 778 a
2009; P rov ides R ev enue G uida nc e for the Third Q uarter yea r a go. P rofit before ta x wa s R M B 282, 232, 114 a ga ins t R M B 169,758, 739 a yea r a go. N et income wa s R MB 262,479, 619 a ga inst R MB
of 2009 164,489, 367 a yea r a go. N et income a ttributa bl e to the c ompa ny's s ha reholders wa s R MB 262, 585,824 or R MB 0. 99 per diluted s ha re
a ga inst R MB 164, 489,367 R M B 0. 55 per diluted s ha re a y ea r a go. N et c a sh provided by opera ting a c tiv ities wa s R MB 326,652, 835 a ga i nst
R M B 131, 218,948 a yea r a go. Ca pita l ex penditure on purcha s e of property , equipment, a nd softwa re wa s R MB 41,752, 492 a ga ins t R MB
511,927, 172 a yea r a go. N on-G AAP opera ting profit wa s R M B 299,957, 997 a ga ins t R MB 177,812, 863 a y ea r a go. N on-G AAP net income
a ttributa ble to the c ompa ny's s ha reholders wa s R MB 282, 875,912 a ga inst R MB 176, 344,452 a yea r a go.
For the third qua rter of 2009 the c ompa ny 's tota l revenues a re expec ted to be between R MB 547 million a nd R MB 563 million, representing
L o okS mart, Ltd. (N as daqG M: LOOK ) L ookS ma rt, L td. L a unches P a y P er C lick S ea rch L ookS ma rt, L td. a nnounc ed the la unch of O ptima l P ric ing: a new initia tive to deliv er better performa nc e to s ea rc h a dv ertis ers by s egmenting
Advertis ing M odel with O ptima l P ricing a nd pric ing tra ffic a c c ording to tha t tra ffic's v a lue. O ptima l P ric ing offers a dvertisers a unique opportunity to reac h a nd a ttra ct a udiences
outs ide of the ma jor s ea rch engines, while ma na ging to meet a nd exc eed return-on-inves tment (R O I) goa ls. O ptima l P ricing a ggrega tes
key word sea rc h tra ffic on the L ook S ma rt Advertiser Network , a nd cla s si fies performa nce da ta s o tha t the full s pectrum of tha t tra ffic is pric ed
a ppropria tely a c cordi ng to traffic type, qua lity, and v olume. The model relies on informa tion a bout a dvertiser campa ign objectives a nd
network structure to provide ea ch a dve rtis er a cha nc e to bid on the most va lua ble tra ffic a t a ll pric e points . As the c us tomer c a s e dia gra m
illustra tes , this a pproa c h, when compa red to a s imple 'blended pricing' a pproa ch more c ommon in the sea rc h a dv ertis ing industry, a llows
a dvertisers to genera te more pa id click s a nd c onvers ions , a nd to rea li ze conv ersions a t a lower c ost-per-conv ers ion.
Open T ext C orp. (N as daqG S :OT E X) Ma ra thon O il C orpora tion S elects O pen Tex t eDis c overy O pen T ext C orp. a nnounc ed tha t Ma ra thon O i l C orpora tion ha s s elected O pen T ext eD isc overy E a rly C a s e As ses s ment, powered by
E a rly C a s e Ass es sment R ec ommind, to prov ide the la tes t in eDis cov ery c a pa bilities . T he eD isc overy s olution a dds to a c ompa ny 's broa der enterpris e c ontent a nd
records ma na gement s tra tegy. eD isc ov ery, wi th E CM initia tives , is des igned to improv e bus iness proces ses , proa c tiv ely ma na ge importa nt
records in a c corda nc e with co mplia nce, lega l a nd polic y requirements , a nd gives employ ees new wa y s to sha re bus iness c ontent. T he O pen
Text E CM S uite, the c ompa ny's fla gship offering, brings together the broa d ra nge of content ma na gement c a pa bilities orga niza tions need to
sec urely a nd s a fely ma na ge a ll ty pes of enterprise informa tion-documents, v ita l rec ords, W eb c ontent, video, i ma ges , ema il, fo rms a nd
reports -a cros s ma ny different enterprise s ys tems a nd a pplica tions . O pen T ext's E CM S uite offers the c ross -enterpris e E CM s olutions
cus tomers need a s the s tra tegic importa nc e of E CM grows in la rge orga niz a tions , driven by c ompli a nce a nd the need to c ut c osts.
T heS treet.c om, Inc . (Nas daqG M: T S CM) TheS treet.c om, Inc . a nnounc ed dela y ed 10-Q fil ing O n 08/11/2009, TheS treet. c om, I nc . a nnounced tha t they will be una ble to file thei r next 10-Q by the dea dline required by the S E C .
T heS treet.c om, Inc . (Nas daqG M: T S CM) TheS treet U pda tes O n D elisting R eview O n Augus t 11, 2009, T heS treet. com, I nc. notified T he N AS D AQ S toc k Ma rk et tha t the Compa ny did not ti mely file its Q ua rterly R eport on
Form 10-Q for the qua rter ended J une 30, 2009, a s a res ult of which the Compa ny is not currently in c omplia nce with R ule 5250(c)(1) of the
NAS D AQ S toc k Ma rk et R ules – E qui ty R ules – N AS D AQ L is ting R ules. T he Company ha s identified an is s ue rela ting to its rec ording of
certa in rev enue in P romotions . com, tha t the Compa ny ac quired in Augus t 2007. T he C ompa ny currently is a s ses sing the impa ct of this iss ue
on the periods sinc e the a cquis ition a nd ha s not yet determined whether it will be required to res ta te a ny prior period res ults . T he C ompa ny
currently does not believ e tha t this ma tter is lik ely to res ult in a ny signific a nt percenta ge revis ion to the a ggrega te revenue or ex pense
previous ly reported by the C ompa ny s inc e the a c quis ition (a lthough the C ompa ny c a nnot give a ny a s s ura nces with respe ct to this ma tter a s
its rev iew is not y et complete) but ma y result in ma teria l revi sions upwa rd or downwa rd to the net income reported by the C ompa ny during
IB 3 N etworks , Inc . (OT CB B:IBN W ) IB 3 N etwork s I nc. Announces C hanges in C ertify ing O n Augus t 3, 2009, B oa rd of D irectors of the I B 3 Network s Inc . dis mis s ed M oore & As soc ia tes Cha rtered, its independent registered public
Acc ounta nt a cc ount firm. O n the s a me da te, Augus t 3, 2009, the a c counting firm of S ea le a nd B eers , CP As wa s enga ged a s the c ompa ny 's new
independent registered public a cc ount firm. The B oa rd of Direc tors of the compa ny a nd the co mpa ny 's Audit C ommittee a pproved of the
dismis sa l of Moore & Ass oc ia tes C ha rtered a nd the enga gement of S ea le a nd B eers , CP A s a s its independent a uditor.
S NM G lobal H oldings (OTCP K:S N MN ) S NM G loba l H oldings Completes Join t V enture to S NM G loba l Holdings a nnounced a joi nt venture with High S peed Ma ga z ine a nd its editor 'D J ' Foothill to develop a soc ia l media network a nd
Dev elop S oc ia l Media Network la unch a n onlin e ma ga zine. T he new entity will be a n online soc ia l media community tha t will inc lude a n online ma ga zine, a rea lity televi sion
progra m, intera c tiv e enterta inment tools a nd the development of pa rtners hips with other s oc ia l network ing s ites. T he compa ny will la unc h a n
online s ports a nd enterta inment ma ga zine with empha s is on upcoming a thletes a nd enterta iners. S NM will la unc h the online s ite with a
limited V IP ha rd c opy run in the firs t qua rter of 2010. T he joint venture pla ns to expand to a dditiona l loc a tions , inc luding N ew Y ork, O rl a ndo,
a nd a site in S outh F lorida to be s elec ted la ter.
S park Networks , Inc . (AME X:L OV) S pa rk N etwork s I nc. R eports Una udited Cons olida ted S pa rk Network s I nc. reported una udited cons olida ted ea rnings res ults for the s econd qua rter a nd six months ended J une 30, 2009. For the
E a rnings R esults for the S ec ond Q ua rter a nd S ix M onths qua rter, the c ompa ny reported net income of $1, 887,000 or $0.09 ba sic a nd diluted ea rnings per s ha re on net rev enue of $11, 242,000
E nded J une 30, 2009 compa red to net income of $1,641 ,000 or $0. 07 ba s ic a nd diluted ea rnings per sha re on net revenue of $14, 987,000 for the s a me period a
yea r a go. O pera ting inc ome wa s $ 1,930, 000 a nd inc ome before inc ome tax es wa s $3,815, 000 c ompa red to opera ting income of $2,923, 000
a nd inc ome before inc ome taxes of $3, 147, 000 for the sa me period a yea r a go. E B I TD A wa s $4,321, 000 a nd a djus ted E B I TD A wa s
$2,553, 000 c ompa red to E B IT DA of $3, 581,000 a nd a djus ted E B I T DA of $4,386, 000 for the sa me period a yea r a go. As of June 30, 2009,
the compa ny ha d a pproxima tely $7. 8 million of debt outs ta nding.
For six months the compa ny reported net income of $2,197, 000 or $0. 11 ba s ic a nd diluted ea rnings per sha re on net rev enue of $23,274, 000
compa red to net income of $3,207 ,000 or $0. 13 ba s ic a nd diluted ea rnings per sha re on net revenue of $30, 009,000 for the s a me period a
yea r a go. O pera ting inc ome wa s $ 3,138, 000 a nd inc ome before inc ome tax es wa s $4,531, 000 c ompa red to opera ting income of $5,400, 000 a