SlideShare ist ein Scribd-Unternehmen logo
1 von 65
Downloaden Sie, um offline zu lesen
Diagramas de Equilíbrio
   e Transformacoes
Composicao + Processamento = Microestrutura + Propriedades


                          EMC5712-Materiais e Microestrutura
                          Prof. Wendhausen
                          Daphiny Pottmaier, posdoc
                          Fonte figuras: Callister 7ed.
                          Agosto & Dezembro 2011.
GOL
• Esbocar diagramas de fases simples (isomorfos,
  euteticos e eutetoides);
• Identificar as regioes de fases, linhas liquidus-
  solvus-solidus e pontos de coexistencia;
• Calcular composicoes das fases (linha de
  amarracao) e fracoes massicas (regra da alavanca);
• Localizar as temperaturas e composicoes das
  transformacoes (pontos/linhas);
• Escrever as reacoes para as transformacoes e
  desenvolvimento das microestruturas.
Sumario
•   Contextualizacao
•   Introducao (aplicacao, limitacao)
•   Diagramas de Fases/Equilibrio (X,T,P)
•   Conceitos (componente, fase, sistema, solucao)
•   Unario (H2O)
•   Isomorfo (Cu-Ni)
•   Eutetico (Pb-Sn)
•   Eutetoide (Fe-C)
•   Conceitos (difusiva/displaciva, cinetica)
•   Diagramas Tempo-Temperatura-Transformacao
CONTEXTUALIZAÇÃO
• Aplicacao:
 –   Quimico-Fisica
 –   Engenharia
 –   Mineralogia
 –   Ciencia dos Materiais


                         • Limitacoes:
                         – Taxa de Transformacao
                         – TTT
INTRODUÇÃO
EXEMPLOS “PRÁTICOS” – Brasagem com ligas Pb-Sn
INTRODUÇÃO
EXEMPLOS “PRÁTICOS” - Brasagem de Chips de Si
Diagramas de Fases/Equilibrio
Mapas para Determinação da Microestrutura

Representação gráfica de dados:
    informações sobre os compostos puros
    natureza das interações entre mais de um componente

Informações disponíveis diretamente no diagrama:
     Tf de cada componente puro
       redução de Tf pela mistura de 2 ou mais componentes
       interação de dois componentes (Fe + C) para
             formar um terceiro (Fe3C )
       presença e grau de solubilidade sólida
       efeito da temperatura na solubilidade sólida
       temperatura de transformação polimórfica
       quantidade e composição das fases líquidas e sólidas a
        temperatura e composição química global específica
       presença de líquidos imiscíveis a altas temperaturas
DIAGRAMAS DE EQUILIBRIO
Representacoes graficas dos estados de equilibrio disponivel para
um sistema e a influencia dos estados de equilibrio com a
composicao (X), temperatura (T) e pressao (P).
                                     Equilibrio se X, T e p sao
                                     estaveis, nao muda com o tempo.
                                     Descrito termodinamicamente
                                     como o estado do sistema dado
                                     pela minima energia livre (G).
CONCEITOS
Componente: elementos quimicos e compostos
estoiquiometricos (Al, H2O, Cu, Fe3C) 8
                                      Chapter
Sistema: categorizado pelo numero de componentes
  unario, binario, ternario, quaternario                    Chapter 8
                                  Phase Diagrams
Fase: caracteristicas fisicasae quimicas (solidos),
          A phase in a material is region that differ in its microstructure and
miscibilidade (liquidos) another region (gases)
          or composition from e uniforme              Phase Diagram
  Homogeneo x Heterogeneo in a material is a region that differ in its mic
                              A phase
                              or composition from another region
Solucao: solvente e soluto
Limite de Solubilidade
                      Al2CuMg

                                          Al2CuMg       H2O(solid, ice) in H2O
              Al
                                                        (liquid) ! 2 phases
                                                                          H2O(so
                                 Al
             • homogeneous in crystal structure and atomic arrangement (liquid
             • have same chemicalhomogeneous in crystal structure and atomic arra
                               • and physical properties throughout
DIAGRAMA UNARIO
                                                                   composicao quimica fixa,
                                                                   T e P variaveis
        100                      fusao
                                            Liquido
                             congelamento
                                                      evaporacao
                                                                          H2O
                                                                       3 fases: solido,
                                             condensacao
                                                                       liquido, gas.
                1     Solido
Pressao [atm]


                                                                       Ponto triplo:
                             sublimacao
                                                  Gas                  0.0098 °C,
                              deposicao
                                                                       0.0063 atm.


                                  0         100                         Regiao: 1 fase
                                                    Temperatura [°C]    Linha: 2 fases
        SI: Kelvin, Pascal                                              Ponto: 3 fases
DIAGRAMA UNARIO
ALOTROPIA
              composicao
              quimica fixa,
              T e P variaveis


            I - XV: alotropos
            do gelo.


              H2O
ENERGIA LIVRE

                 Gsolido
G [kJ/mol]


                                          G(T,p)= H - T.S
                                               H = Href + ∫CpdT
                            Gliquido
                                               S = Sref + ∫CpdlnT

                           Ggas
                                       H2O

             0       100    Temperatura [°C]
   P=1 atm
LEI DAS FASES DE GIBBS
                Graus de liberdade (F) de um sistema fechado em equilibrio, em
                termos de fases separadas (P) e componentes quimicos (C) e
                variaveis do processo (N).

   100
                                    Liquido
                                                         F+P=C+N
                              (i)
                                                               H2O, C = 1
                                     (ii)
                1   Solido (iii)                               (i) P = 1, F = 2
                                                               (ii) P = 2, F = 1
Pressao [atm]


                                          Gas
                                                               (iii) P = 3, F = 0


                          0         100     Temperatura [°C]       F: freedom, P: phase
Solubility Limit: Water-Sugar
                   Solubilidade do Açúcar em Água
• Changing T can change # of phases: path A to B.
• Changing Co can change # of phases: path B to D
                                                B (100,70)         D(100,90)
                                                1 phase            2 phases
              10 0

                   80                                          L
                                                            (liquid)
Temperature (°C)


                   60                                          +
                                     L                         S
                             (liquid solution                (solid
                   40          i.e., syrup)                 sugar)
                   20                                  A(70, 20 )                  T : B-D
                                                       2 phases                    C : B-A
                    0
                        0     20     40      60 70 80                  10 0
                             C o =Composition (wt% sugar)              Adapted from Callister
                                                Chapter 8
Sistemas Eutéticos Binários
  Concept Check 9.5
 (SEM solubilidade no estadoO–NaClEx: NaCl-H2O)
 Below is a portion of the H2 sólido phase diagram:

                      10                                                  50

                                                 Liquid
                                                 (brine)                  40

                       0
                                                                          30
                                                                 Salt
  Temperature (°C)


                                                                                Temperature (°C)
                                                                  ϩ
                               Ice                                        20
                                                                Liquid
                                ϩ                               (brine)
                     Ϫ10
                             Liquid
                             (brine)                                      10


                                                                          0
                     Ϫ20

                                                                          Ϫ10
                                               Ice ϩ Salt

                                                                          Ϫ20
                     Ϫ30
 NaCl                   0              10             20             30
 H2O                   100             90             80             70
                                            Composition (wt%)
SOLUBILIDADE SÓLIDA
     ELEMENTOS PUROS


           Regra Hume-Rothery:
           •Razao raio atomico (± 15%)
           •Estrutura cristalina
           •Eletronegatividade (± 0.4 e.u.)
           •Mesma Valencia
SOLUBILIDADE SÓLIDA
      INTERSTICIAIS
DIAGRAMA - experimental                           "#!$%&'()*+!,-%!,)&%!./)0!1$'&!,-%!23$(%0!.*4!$%56.
                                                                                23$(%0!)*4)2.,%!,-%!,%&5%$.,3$%0!'1!,-%!0'6)430!.*4!6
                                                                                .66'70!,-%!0'6)430!.*4!6)93)430!,'!<%!56',,%4!,'!5$'43
                                                                                !


                                                        !
)&%!./)0!1$'&!,-%!23$(%0!.*4!$%56.2)*+!),!7),-!2'&5'0),)'*8!,-%!2''6)*+!
%!,%&5%$.,3$%0!'1!,-%!0'6)430!.*4!6)93)430!1'$!.!+)(%*!2'&5'0),)'*:!;-)0!
!.*4!6)93)430!,'!<%!56',,%4!,'!5$'432%!,-%!5-.0%!4).+$.&=!
                                                            !
-%!,)&%!./)0!1$'&!,-%!23$(%0!.*4!$%56.2)*+!),!7),-!2'&5'0),)'*8!,-%!2''6)*+!                                                 !
 !,-%!,%&5%$.,3$%0!'1!,-%!0'6)430!.*4!6)93)430!1'$!.!+)(%*!2'&5'0),)'*:!;-)0!
430!.*4!6)93)430!,'!<%!56',,%4!,'!5$'432%!,-%!5-.0%!4).+$.&=!                   !"#$%&#'&(&)#)*'&#
                                                                                >1!.*!.66'#!2'*0)0,0!'1!&'$%!,-.*!'*%!5-.0%8!,-%!.&'
                                                                                1'3*4!<#!.556#)*+!,-%!6%(%$!$36%!,'!,-%!5-.0%!4).+$.&
                                                                                !
                                                                                ;-%!6%(%$!$36%!2.*!<%!%/56.)*%4!<#!2'*0)4%$)*+!.!0)&
                                                                                .66'#!)0!$%5$%0%*,%4!<#!,-%!1362$3&!.*4!,-%!2'&5'0)
                                                                                .!<.$:!;-%!5$'5'$,)'*0!'1!,-%!5-.0%0!5$%0%*,!.$%!4%,%
                                                                                <.6.*2%!,-%!0#0,%&:!


                                                                            !
                               !                                                              !
REGRA DA ALAVANCA

              R         Co    S


    α
                                   L
Wα = S/(R+S) = Co - CL / Cα - CL
WL = R/(R+S) = Cα - Co / Cα - CL
SISTEMA ISOMORFO Cu-Ni                                                9.7 Binary Isomorphous Systems • 259

  Figure 9.3 (a) The                                                    Composition (at% Ni)
 copper–nickel phase
                                                   0            20         40          60          80            100
       diagram. (b) A                       1600
        portion of the
 copper–nickel phase                                                                                                2800
   diagram for which
                                            1500
    compositions and
   phase amounts are                                                 Liquid                             1453°C
 determined at point                                                                                                2600
    B. (Adapted from                        1400
   Phase Diagrams of
                         Temperature (°C)


                                                                                                                           Temperature (°F)
Binary Nickel Alloys,                                                                           Solidus line
P. Nash, Editor, 1991.                                               Liquidus line
                                                                                                                    2400
                                            1300                                ␣ +L
         Reprinted by
  permission of ASM
                                                                          B
        International,
Materials Park, OH.)                        1200                                       ␣
                                                                                                                    2200


                                            1100                                           A                        2000
                                                       1085°C


                                            1000
                                                   0            20         40          60          80            100

                                               (Cu)                     Composition (wt% Ni)                     (Ni)
                                                                                 (a)
6T_c09_252-310 11/29/05 11:33 Page 265
                                                                                                                                                                  REVISED PAGES

                                                      DIAGRAMA Cu-Ni
                   Composição9.9 Development das Fases -Isomorphous Alloys • 265
                              Química of Microstructure in Equilíbrio
                     Figure 9.4
                     Schematic
                                                                                                                              L
         representation of the                                                      L                    L
              development of                                                     (35 Ni)              (35 Ni)
               microstructure                                  ␣ (46 Ni)
                    during the                       1300                                         a                            ␣
                   equilibrium                                                                                                        +
                                                                                                                                          L
            solidification of a
          35 wt% Ni–65 wt%
                      Cu alloy.
                                                                               L (32 Ni)          b
                                                                                                                            ␣ (46 Ni)
                                                                                              c
                                  Temperature (°C)


                                                                                                                  ␣ (43 Ni)               ␣ (43 Ni)
                                                              L (24 Ni)
                                                                                             d                                        ␣
                                                                                                                                                  ␣
                                                                                                            L (32 Ni)             ␣           ␣
                                                     1200                                                                                 ␣
                                                                                                  e                                                   L (24 Ni)
                                                                                                                                      ␣ ␣
                                                                                                                              ␣
                                                                                                                ␣ (35 Ni)          ␣ ␣ ␣
                                                                                                                              ␣
                                                                                                                                     ␣ ␣
                                                                                                                                   ␣
                                                                                                                                     ␣
                                                                           ␣
                                                                                                                                   ␣          ␣
                                                                                                                              ␣
                                                                                                                ␣ (35 Ni)                 ␣


                                                     1100
                                                         20                      30                         40                                    50

                                                                                           Composition (wt% Ni)
DIAGRAMA BINÁRIO
  SOLUÇÃO SÓLIDA TOTAL
MICROESTRUTURAS DE LIGAS
     COM SOLUÇÃO SÓLIDA TOTAL
alloys are affected by composition as other structural variables (e.g., grain size) are

                                                Sistemas Isomorfos
  held constant. For all temperatures and compositions below the melting tempera-
  ture of the lowest-melting component, only a single solid phase will exist. There-
  fore, each component will experience solid-solution strengthening (Section 7.9), or
                                                      (Propriedades Mecânicas)
  an increase in strength and hardness by additions of the other component. This
  effect is demonstrated in Figure 9.6a as tensile strength versus composition for the


                                                                                                                                     60


                                                                                                   Elongation (% in 50 mm [2 in.])
                                                                     60
                         400
Tensile strength (MPa)


                                                                                                                                     50


                                                                          Tensile strength (ksi)
                                                                     50
                                                                                                                                     40
                         300
                                                                     40
                                                                                                                                     30


                         200                                         30
                                                                                                                                     20
                            0     20       40         60      80   100                                                                 0     20       40         60      80   100
                           (Cu)                                    (Ni)                                                               (Cu)                                    (Ni)
                                       Composition (wt% Ni)                                                                                       Composition (wt% Ni)

                                                (a)                                                                                                        (b)

  Figure 9.6 For the copper–nickel system, (a) tensile strength versus composition, and
  (b) ductility (%EL) versus composition at room temperature. A solid solution exists over
  all compositions for this system.
SISTEMA EUTÉTICO
  SEM SOLUÇÃO SÓLIDA
MICROESTRUTURAS DE LIGAS
       SEM SOLUÇÃO SÓLIDA
molten at about 185ЊC (365ЊF), which makes this material especially attractive as a

                               SISTEMA EUTETICO Pb-Sn
 low-temperature solder, since it is easily melted.


                                                      Composition (at% Sn)

                         0           20          40           60                     80                       100

                             327°C

                                                                                                                  600
                   300

                                                                            Liquid
                                                                                                                  500
                                                                                                      232°C
                                             ␣ +L
Temperature (°C)


                                                                                                                        Temperature (°F)
                   200           ␣                                                             ␤ +L               400
                                                      183°C
                                                                                                              ␤
                                          18.3                             61.9                       97.8

                                                                                                                  300


                   100                                             ␣ + ␤                                          200


                                                                                                                  100


                    0
                         0                20          40                   60             80                  100

                     (Pb)                             Composition (wt% Sn)                                    (Sn)
tion at the point where ww¿ crosses the solidus line. The resulting alloy is poly-
  crystalline with a uniform composition of C1, and no subsequent changes will occur

            DIAGRAMA Pb-Sn
                   400                                                                           Figure 9.11 Schematic
                                              L
                                                                                                 representations of the
                             w
                                       (C1 wt% Sn)
                                                                                                 equilibrium microstructures for
                                                                 ␣
                                                                                                 a lead–tin alloy of composition
                                 a                                                   L
                                 b                                        L                      C1 as it is cooled from the
                                                                                                 liquid-phase region.
                   300
                                                                                 Liquidus

                                 c

                                              ␣       ␣
                                                                               ␣ +L
Temperature (°C)


                                          ␣       ␣
                                                                Solidus
                   200
                                     (C1 wt% Sn)


                                         ␣


                   100
                                                                      ␣ +␤


                             wЈ
                         0                            10                      20            30

                             C1                           Composition (wt% Sn)
MICROESTRUTURA MONOFÁSICA
(C3 in Figure 9.13). Consider an alloy having this composition that is cooled from
   a temperature within the liquid-phase region (e.g., 250ЊC) down the vertical line yy¿

SISTEMA EUTETICO Pb-Sn
                                                                                                  Figure 9.12 Schematic
                                                                                                  representations of the
                                            x                                                     equilibrium microstructures
                                                                                   L
                                        d                    L                                    for a lead–tin alloy of
                                                     (C2 wt% Sn)                                  composition C2 as it is cooled
                                                                                                  from the liquid-phase region.
                    300
                                                                          L              ␣
                                        e


                                                             ␣        ␣
                                                                                  ␣ +L
 Temperature (°C)


                                                         ␣

                    200       ␣                                  ␣         C2 wt% Sn
                                        f


                                                                              ␤
                          Solvus
                           line
                                        g

                                                                              ␣
                    100


                                                                          ␣ +␤


                                            xЈ
                      0            10               20               30           40         50

                                            C2

                                                 Composition (wt% Sn)
1496T_c09_252-310 1/9/06 13:00 Page 280
                                                                                                                                     2nd REVISE PAG

                                                DIAGRAMA Pb-Sn
           280 • Chapter 9 / Phase Diagrams           (liga hipoeutética)
                                                      L
                                                 (C4 wt% Sn)
                                                                         z

                                                                              j                      ␣                         600
                             300
                                                                                                                       L

                                            ␣ +L
                                                                                                         L                     500

                                      ␣ (18.3
                                      wt% Sn)                        k
          Temperature (°C)


                                                                                                                                     Temperature (°F)
                             200                                                                                               400
                                                                                                                   ␤ +L
                                      ␣                                       l                                            ␤
                                                                     m
                                                   L (61.9 wt% Sn)                                 Eutectic
                                                                                                   structure                   300

                                                                                                    Primary ␣
                                                 ␣ + ␤                                            (18.3 wt% Sn)
                             100
                                                                                                                               200
                                                                                             ␤ (97.8 wt% Sn)
                                                                               Eutectic ␣
                                                                             (18.3 wt% Sn)
                                                                                                                               100
                                                                         zЈ

                               0
                                0               20                                           60                   80       100
                               (Pb)                                   C4                                                   (Sn)
                                                                     (40)

                                                                     Composition (wt% Sn)

                                                 Figure 9.16 Schematic representations of the equilibrium microstructures for a lead–tin
DIAGRAMA Pb-Sn
 (liga hipoeutética)
Representação Esquemática
                 phase field. To distinguish one a from the other, that which resides in th
eutectic phase   structure is called eutectic a, while the other that formed prior to cro
                 eutectic isotherm is termed primary a; both are labeled in Figure
primary phase
                             Reação Eutética
                 photomicrograph in Figure 9.17 is of a lead–tin alloy in which both prim
                 eutectic structures are shown.


                                                              Figure 9.15 Schematic represen
                                                              the formation of the eutectic str
                                  ␤     Pb                    the lead–tin system. Directions o
                                                              of tin and lead atoms are indicat
                                                              blue and red arrows, respectively
                                  ␣      Sn        Liquid


                                  ␤          Pb


                                  ␣      Sn       Eutectic
                                                   growth
                                                  direction

                                  ␤     Pb
apter 9 / Phase Diagrams                     DIAGRAMA Pb-Sn
gure 9.13
 chematic
 ations of                                                                                                            600
                                300                                            y               L
uilibrium                                                                                  (61.9 wt%
 res for a                                                                                    Sn)
n alloy of                                                       L                                                    500
                                                                           h
mposition                                          ␣ +L
nd below
             Temperature (°C)


                                                                                                                            Temperature (°F)
  eutectic                      200       ␣                 183°C
                                                                                                       ␤+L          ␤ 400
perature.                                     18.3                         i                                 97.8

                                                                                                                      300


                                100                       ␣+␤
                                                                                                                      200
                                                                                    ␣ (18.3 wt%    ␤ (97.8 wt%
                                                                                         Sn)            Sn)
                                                                                                                      100
                                                                               yЈ
                                 0
                                      0       20            40            60                      80                100
                                  (Pb)                                       C3                                     (Sn)
                                                                           (61.9)
                                                           Composition (wt%Sn)
Microestrutura EUTETICA
ENERGIA LIVRE
             H = Href + ∫CpdT    S = Sref + ∫CpdlnT
                                                              γ                      1400˚
                      G(T,p)= H - T.S
                                                                        Fe3C
G [kJ/mol]


                                                                                         L


                                                      G
              Gccc                  Gliquido                           Eutetico
                                                                                      1147˚
                        Gcfc
                                                               γ
                                                                               L         Fe3C


                                                      G
                                        Fe                                           L


                                                      T
                                                                   γ
                912       1394        1538                                          γ + Fe3C
                                                          α
                                                                         α + Fe3C
                            Temperatura [°C]
   P=1 atm                                                Fe                       C
                                                                          % Eutetico
austenite
                                                    912ЊC (1674ЊF). This austenite persists to 1394ЊC (2541ЊF), at which tem

                          SISTEMA EUTETOIDE Fe-C
                                                    the FCC austenite reverts back to a BCC phase known as d ferrite, whic


                                                                       Composition (at% C)
                          0                         5                 10                15                     20             25
                   1600
                          1538°C
                                          1493°C


                                   ␦                                                          L
                   1400
                                                                                                                                2500
                                   1394°C                ␥+L


                   1200
                                                                           1147°C
Temperature (°C)


                                                                                                                                       Temperature (°F)
                                                               2.14                               4.30
                                    ␥, Austenite                                                                                2000

                   1000
                              912°C                                                      ␥ + Fe3C


                    800        ␣                                                                                                1500
                               +                                                                   727°C
                               ␥
                                        0.76

                                         0.022
                    600                                                    ␣ + Fe3C
                                       ␣, Ferrite
                                                                                                           Cementite (Fe3C)     1000


                    400
                       0                       1           2              3               4                5             6    6.70
                      (Fe)                                             Composition (wt% C)
Microestruturas Fe-C
                            9.18 The Iron–Iron Carbide (Fe–Fe3C) Phase Diagram • 291

e 9.25
phs of
(90ϫ)
tenite
yright
 nited
  Steel
 tion.)


                             (a)                                         (b)
             Microestrutura Ferrita α                     Microestrutura Austenita
          melts at 1538ЊC (2800ЊF). All these changes are apparent along the left vertical axis
                                   1
Section 9.12 and illustrated in Figure 9.16 for the eutectic system. Consider a com-

                                              DIAGRAMA Fe-C
                       position C0 to the left of the eutectoid, between 0.022 and 0.76 wt% C; this is termed
hypoeutectoid alloy    a hypoeutectoid (less than eutectoid) alloy. Cooling an alloy of this composition is
                       represented by moving down the vertical line yy¿ in Figure 9.29. At about 875ЊC ,
                                                (liga hipoeutetoide)
                       point c, the microstructure will consist entirely of grains of the g phase, as shown

                                         1100                                                                              Figure 9.29 Schematic
                                                                                           ␥
                                                                                                                           representations of the
                                                                                                  ␥
                                                                                                                           microstructures for an
                                                                                           ␥
                                                                                                  ␥                        iron–carbon alloy of
                                         1000
                                                                         ␥                                                 hypoeutectoid composition C0
                                                                                                            ␥ + Fe3C       (containing less than 0.76 wt%
                                                            y                                 ␥
                                                    M
                                                                                                      ␥                    C) as it is cooled from within
                                          900                                                                              the austenite phase region to
                                                                                           ␥                  ␣
                                                        c                                         ␥                        below the eutectoid
                                                                                                                           temperature.
                      Temperature (°C)


                                                                                           ␥
                                          800                                                         ␥
                                                        d
                                                                                          ␥       ␥
                                                            e
                                         Te         N
                                                        f                 O
                                          700

                                                        ␣                                                     Pearlite

                                          600                                Fe3C

                                                                                                          Proeutectoid ␣
                                                                      Eutectoid ␣
                                          500                                         ␣ + Fe3C


                                                                 yЈ
                                          400
                                                0                               1.0                            2.0
                                                            C0                Composition (wt% C)
from grain to grain; some of the pearlite appears dark because the many close
      spaced layers are unresolved at the magnification of the photomicrograph. The
          MICROESTRUTURA HIPOEUTETOIDE
  0
 h
C
  a
  e
  e
 d                                                                      Proeutectoid
ϫ.                                                                         ferrite
 h
  c
 .)


                                                                        Pearlite
Representação Esquemática
                    Reação Eutetoide
               9.19 Development of Microstructure in Iron–Carbo

            Austenite grain                                                    Figure 9.28
              boundary
                                                                               representatio
                                                                               formation of
                                                                               austenite; dir
                              ␣                                                diffusion ind

                          Ferrite (␣)
                                            Austenite
                                               (␥ )
              Austenite       Ferrite (␣)
                 (␥ )
                              Ferrite (␣)
Cementite                                                   Growth direction
 (Fe3C)                   Ferrite (␣)                          of pearlite

                              ␣
                                                        Carbon diffusion
phase field (Figure 9.24) are relatively complex and similar to those described for
 the eutectic systems in Section 9.12. Consider, for example, an alloy of eutectoid

                              DIAGRAMA Fe-C
 composition (0.76 wt% C) as it is cooled from a temperature within the g phase re-
 gion, say, 800ЊC—that is, beginning at point a in Figure 9.26 and moving down the


                   1100                                                            Figure 9.26 Schematic
                                                                                   representations of the
                                                                                   microstructures for an
                                                                                   iron–carbon alloy of eutectoid
                   1000              ␥
                                                                        ␥ + Fe3C   composition (0.76 wt% C) above
                                                                                   and below the eutectoid
                                                                                   temperature.
                    900

                                         x                      ␥   ␥
Temperature (°C)


                                                                ␥
                    800              a                              ␥

                              ␣ +␥
                                                        727°C
                                     b                                    ␣
                    700
                                ␣


                    600
                                                                           Fe3C


                    500                                  ␣ + Fe3C


                                             xЈ
                    400
                          0                       1.0                    2.0
                                             Composition (wt% C)
MICROESTRUTURA EUTETOIDE
2nd REVISE PAGE


                                    DIAGRAMA Fe-C
298 • Chapter 9 / Phase Diagrams       (liga hipereutetoide)
                                    1100
                                                                                            P
                                                                                                                        Figure 9.32 Schematic
                                                                                                                        representations of the
                                                                                                ␥ + Fe3C                microstructures for an
                                                                                                                        iron–carbon alloy of
                                    1000         ␥
                                                                 z                                                      hypereutectoid composition
                                                                                        ␥
                                                                                                 ␥                      C1 (containing between 0.76
                                                                                    ␥
                                                             g                                                          and 2.14 wt% C), as it is
                                                                                            ␥
                                     900                                                                                cooled from within the
                                                                                                      Fe3C              austenite phase region to
                                                                                        ␥                               below the eutectoid
                                                                                                  ␥                     temperature.
                 Temperature (°C)


                                     800                                           ␥
                                                             h
                                                                                            ␥
                                               ␣ +␥
                                                        O    i
                                     700
                                                 ␣
                                                                                                             Pearlite


                                     600                                                                ␣
                                                                          Proeutectoid
                                                                             Fe3C      Eutectoid Fe3C

                                     500
                                                 ␣ + Fe3C


                                                                     z'
                                     400
                                           0                1.0                                 2.0

                                                              C1
                                                      Composition (wt% C)
MICROESTRUTURA of Microstructure in Iron–Carbon A
               9.19 Development HIPEREUTETOIDE

gure 9.33
crograph
4 wt% C
 having a
structure
 f a white
eutectoid
  network
nding the                                    Proeutectoid
                                              cementite
 colonies.
  opyright
y United
 tes Steel
 oration.)
             Pearlite
REAÇÃO EUTETÓIDE
   Sistema Fe-C
REAÇÃO EUTETÓIDE
         Sistema Fe-C


MEV                     MO
Sistema Ferro-Carbono
   Digrama de Equilíbrio
Ferro-Fundido Branco
     Sistema Fe-C
Sistema Ferro-Carbono
   Digrama de Equilíbrio
Ferro-Fundido Cinzento
      Sistema Fe-C
eutectoid reaction but also the relative fra
                                    Influencia de outros Elementos              phase that form. Steels are normally alloy
                                                                                either to improve their corrosion resistan
                                                                                treatment (see Section 11.8).
                                                                 9.20 The Influence of Other Alloying Elements • 301

                                                                                                                      Figure 9.34 The dependence of       Figu
                                        Ti                                           2400
                                                                                                                  0.8 eutectoid temperature on alloy      com
                                                            Mo             W                                                   Ni
                             1200                                                    2200                             concentration for several alloying for
Eutectoid temperature (°C)


                                                                                            Eutectoid temperature (°F)
                                                                                         Eutectoid composition (wt% C)
                                                                 Si
                                                                                                                      elements in steel. (From Edgar C. Edg
                                                                                     2000                         0.6
                                                                                                                      Bain, Functions of the Alloying     Elem
                             1000                                                                                                        American Society 1939
                                                                                                                      Elements in Steel,Cr
                                                                                     1800
                                                                               Cr
                                                                                     1600                         0.4 for Metals, 1939, p. 127.)
                              800                                                                                                                     Si
                                                                                     1400                                                        Mo              Mn
                                                                                                                  0.2                                      W
                                                                               Mn    1200                                          Ti
                              600
                                                                               Ni    1000
                                                                                                                         0
                                    0        2   4      6        8    10   12       14                                       0       2     4      6      8    10 12 14
                                        Concentration of alloying elements (wt%)                                                 Concentration of alloying elements (wt%)


                                        Temperatura Eutetoide                                                                    Composicao Eutetoide
   existence at room temperature of nonequilibrium phases that do not appear on the
required for the transformation to proceed halfway to completion, t0.5, or
                                                                                                   Transformation
                                                                                                   rate—reciprocal of                                                                                 1
                                                                                                                                                                                         rate ϭ                                  (10.18)
                                                                                                   the halfway-to-                                                                                   t0.5


                                      TEMPO-TEMPERATURA-TRANSFORMAÇÃO
                                                                                                   completion
                                                                                                   transformation time                     Temperature will have a profound influence on the kinetics and thus on the
10_311-357 11/30/05 7:37 Page 323                                                                                                      rate of a transformation. This is PAGES
                                                                                                                                                           REVISED demonstrated in Figure 10.11, where y-versus-log t

                                                                                                                                                            100
:37 Page 323
                   termodinamicamente                                                         REVISED PAGES


                                                                                                                                   Percent recrystallized
                                                                                                                                                             80

                   como o estado do sistema The Kinetics of Phase Transformations • 323
                                         10.3
                                                                                                                                                             60   135ЊC   119ЊC        113ЊC 102ЊC           88ЊC         43ЊC


                   dado pela minima energia                                 1.0
                                                             Figure 10.10 Plot of fraction
                                                             reacted versus the logarithm of
                                                                                                                                                             40

                                                             time typical of many solid-state                                                                20
                   livre (G).
                                            Fraction of transformation, y


                                                             transformations in which
                                                             temperature is held constant.                                                                    0
                                                                                                                                                                                                 2
                                                                                                                                                                                                                    104
                                                                                                  10.3 The Kinetics of Phase Transformations • 323
                                                                                                                    1          10          10
                                                                                                                                        Time (min)
                                                                            0.5
                                                                                                                                                                                       (Logarithmic scale)

                                      1.0                                                                                             Figure 10.11 Percent recrystallization as a function of time and at constant
                                                                                                                                                 Figure 10.10 Plot of fraction
                                                                                                                                      temperature for pure copper. (Reprinted with permission from Metallurgical
                                                                                                            Representacoes graficas dos
                                                                                                                t0.5
                                                                                                                                                 reacted versus the logarithm of
                                                                                                                                      Transactions, Vol. 188, 1950, a publication of The Metallurgical Society of AIME,
                                                                                                                                                 time typical of many solid-state
                                                                                                                                      Warrendale, PA. Adapted from B. F. Decker and D. Harker, “Recrystallization in Rolled
      Fraction of transformation, y


                                                                             0
                                                                                  Nucleation
                                                                                                            estados da CINETICA de
                                                                                                           Growth
                                                                                                        transformations in which
                                                                                                                                      Copper,” Trans. AIME, 188, 1950, p. 888.)

                                                                                                        temperature is held constant.
                                                                                                            transformacao para um sistema
                                                                                               Logarithm of heating time, t


                                                formed material versus the logarithm of time; an S-shaped emsimilar to that in do tempo (t).
                                                                                                            curve funcao
                                      0.5       of which is distinctive of the new phase. Data are plotted as the fraction of trans-

                                                Figure 10.10 represents the typical kinetic behavior for most solid-state reactions.
                                                Nucleation and growth stages are also indicated in the figure.
                                                    For solid-state transformations displaying the kinetic behavior in Figure 10.10,
                                                the fraction of transformation y is a function of time t as follows:

                                                   t0.5 y ϭ 1 Ϫ exp1Ϫkt 2
     Avrami equation—                                                     n
     dependence of                                                                                     (10.17)
     fraction 0
              of
     transformation       where k and n are time-independent constants for the particular reaction. The above
     on time     Nucleation
                          expression is often Growth to as the Avrami equation.
                                              referred
                                                    By convention, the rate of a transformation is taken as the reciprocal of time
                                                required for the of heating time, tproceed halfway to completion, t0.5, or
                                                     Logarithm transformation to
     Transformation
     rate—reciprocal of                                                                                                             1
                                                                                                                          rate ϭ                                             (10.18)
CONCEITOS
Transformacao de fase: difusiva ou displaciva.

Difusiva: solidificacao, alotropicas, recristalizacao,
crescimento de grao, etc.
Ponto de vista microestrutural:
  Nucleacao: Homogenea x Heterogenea
  Crescimento:

Displaciva/martensitica: sem difusao, metaestavel.

Cinetica: velocidade (tempo) - mecanismo.
ters 10 and 11.
                                                                                                                    system has been chosen because it is familiar and because a wide variety
                                                                                                                    crostructures and mechanical properties are possible for iron–carbon (or steel)
                                                                                                                             9.18 THE IRON–IRON CARBIDE (Fe–Fe3C)


                                        Diagrama TTT Fe-C eutetoide
                                                                                                                                    PHASE DIAGRAM
                                                                                        10.5 ISOTHERMAL TRANSFORMATION DIAGRAMS diagram is presented in Figure
                                                                                                                 A portion of the iron–carbon phase
                                                                                                                    Pearlite                                                           upon heating, experiences two changes in crystal structure before it
                                                                                                                                                       ferrite                         temperature the stable form, called ferrite, or a iron, has a BCC c
ter 10 / Phase Transformations in Metals                                                                            Consider again the
                                                                                                                                                       austenite
                                                                                                                                                                                 iron–iron carbide eutectoid reaction
                                                                                                                                                                                       Ferrite experiences a polymorphic transformation to FCC austeni
                                                                                                                                                                                       912ЊC (1674ЊF). This austenite persists to 1394ЊC (2541ЊF), at whi
                                                                                        Eutectoid reaction                                                                             the FCC austenite reverts back to a BCC phase known as d ferrit
                                                                                                                                                                                         cooling
                                                                                        for the iron-iron
                                  100                                                   carbide system       Figure 10.13 ∆ a10.022 wt% C2 ϩ Fe3C16.70 wt% C2 (1
                                                                                                                g10.76 wt% C2
                                                                                                                                            heating
      transformed to pearlite


                                                                                                             Demonstration of how Composition (at% C)
        Percent of austenite


                                            Transformation                  Transformation
                                                                                                     which is fundamental to the development of microstructure in steel alloys.
                                                                                                             an isothermal 5
                                                                                                                       0                                 10                15            20              25
                                         temperature 675°C                       ends                             1600
                                                                                                     cooling, austenite, having an intermediate carbon concentration, transforms to
                                                                                                                        1538°C

                                  50
                                                                                                             transformation diagram1493°C
                                                                                                     rite phase, having a much lower carbon content, and also cementite, with a
                                                                                                             (bottom)␦ is generated                                           L
                                                                                                     higher carbon concentration. Pearlite is one microstructural product of this
                                                                                                                  1400
                                                                                                                                                                                                           2500
                                            Transformation                                                   from percentage ␥ + L
                                                                                                     formation (Figure1394°C and the mechanism of pearlite formation was disc
                                                                                                                               9.27),
                                                begins                                               previously (Section 9.19) and demonstrated in Figure 9.28.
                                                                                                             transformation-versus- 1147°C
                                                                                                                  1200
                                                                                                          Temperature plays an important role in the rate of the austenite-to-pe
                                    0                                                                        logarithm Austenite
                                                                                                                              ␥, of time
                                                                                                105 transformation. The temperature dependence for an iron–carbon alloy of2000                              eute


                                                                                                                                                      Temperature (°C)
                                                                                                                                                    2.14                        4.30
                                          1         10          102        103        104
                                                                                                             measurements (top).
                                                                                                     composition is indicated in Figure 10.12, which plots S-shaped curves of the
                                                                                                                  1000
                                                                 Time (s)                            centage transformation versus the logarithm of time at three different tempera
                                                                                                             [Adapted from H.
                                                                                                                         912°C                                             ␥ + Fe C                                       3
                                                                                                     For each curve, data were collected after rapidly cooling a specimen compos
                                                                                                             Boyer, ␣
                                                                                                                   800     (Editor), Atlas
                                                                                                     100% austenite to the temperature indicated; that temperature was maintained
                                                                                                                           +
                                                                                                                                                                                                           1500
                                                                                                                                                                                 727°C
                                                                                                             of Isothermal ␥
                                                                                                     stant throughout the course of the reaction.
                                                                                                                                0.76
                                                                                                  1400 A more convenient way of representing both the time and temperatur
                                             Austenite (stable)             Eutectoid temperature            Transformation and  0.022
                                                                                                     pendence of600 transformation is in the+ bottom portion of Figure 10.13. Her
                                                                                                                    this ␣, Ferrite                          ␣ Fe C                                           3

                                        Austenite                                                            Cooling Transformation
                                                                                                     vertical and horizontal axes are, respectively, temperature and the logarithm of
                                                                                                                                                                                       Cementite (Fe C)    1000                                         3
                                  700
                                        (unstable)                                                           Diagrams, American
                                                                                                     Two solid curves are plotted; one represents the time required at each temper
                                                                                                                   400
                                                                                                             initiation for Metals,21977, 3
                                                                                                                       0             1                                      4
                                                                                                  1200 the Society or start of the transformation; C) other is for the transform
                                                                                                     for             (Fe)                                 Composition (wt%
                                                                                                                                                                           the         5             6  6.70

                                                                  Pearlite                           conclusion. The dashed curve 9.24 The iron–iron carbide phase transformation compl
                                                                                                                                          Figure corresponds to 50% of diagram. [Adapted from Binary
               Temperature (°C)


                                                                                                                                   Temperature (°F)
                                                                                                             p. 369.]
                                                                                                     These curves were generated from a series of T. B. Massalski (Editor-in-Chief), 1990. Repr
                                                                                                                                          Diagrams, 2nd edition, Vol. 1, plots of the percentage transfo
                                  600                                                                                                      permission of ASM International, Materials Park, OH.]
                                                                                                                tion versus the logarithm of time taken over a range of temperatures. The S-sh
                                                             50% Completion curve
                                                                                                                curve [for 675ЊC (1247ЊF)], in the upper portion of Figure 10.13, illustrates ho
                                                                                                             1000
                                                                                                                data transfer is made.
                                                                                                                    In interpreting this diagram, note first that the eutectoid temperature [
                                  500                      Completion curve
                                                           (~100% pearlite)                                     (1341ЊF)] is indicated by a horizontal line; at temperatures above the eutecto

                                               Begin curve                                                   800                      100                                                                                     0                     Figure 10.12 For
                                             (~ 0% pearlite)                                                                                                                                                                                        iron–carbon alloy
                                  400                                                                                                                                                                                                               eutectoid composi
                                                                                                                                                                                                                                                    (0.76 wt% C),
                                                                                                                                                                                                                                                    isothermal fractio


                                                                                                                                                                                                                                   cent austenite
                                                                  102          103           104          105
                                                                                                                  rcent pearlite


                                         1            10                                                                                                                                                                                            reacted versus the
                                                                   Time (s)                                                                 50                           600°C         650°C       675°C                      50                    logarithm of time
                                                                                                                                                                                                                                                    the austenite-to-p
2nd REVISE PAGES
                                                                                                system has been chosen because it is familiar and because a wide variety
                                                                                                crostructures and mechanical properties are possible for iron–carbon (or steel)


                                      Diagrama TTT Fe-C (perlita)      10.5 ISOTHERMAL TRANSFORMATION DIAGRAMS
                                                                                                Pearlite
                                                                                                Consider again the iron–iron carbide eutectoid reaction
                                                                       Eutectoid reaction
                                                           10.5 Isothermal Transformation Diagrams a10.022327C2 ϩ Fe3C16.70 wt% C2
                                                                  for the iron-iron g10.76 wt% C2 ∆ • wt%
                                                                                                  cooling
                                                                                                                                                                                                            (1
                                                                       carbide system                                            heating


                                     1s                        1 min                       which is fundamental to the development of microstructure in steel alloys.
                                                                                                1h                          1 day
                                                                                           cooling, austenite, having an intermediate carbon concentration, transforms to
                                                                                           rite phase, having a much lower carbon content, and also cementite, with a
                                                                                                                Eutectoid        1400
                    A                             ␥                    Austenite (stable) higher carbon concentration. Pearlite is one microstructural product of this
                                                                                                              temperature
                         727°C                                                             formation (Figure 9.27), and the mechanism of pearlite formation was disc
                                                                                           previously (Section 9.19) and demonstrated in Figure 9.28.
                                                                                                Temperature plays an important role in the rate of the austenite-to-pe
                   700           ␥        ␥       ␥        ␥                               transformation. The temperature dependence for an iron–carbon alloy of eute
                                                                                           composition is indicated in Figure 10.12, which plots S-shaped curves of the
                             ␥            ␥                                             ␣ Ferrite transformation versus the logarithm of time at three different tempera
                                                                                           centage       Coarse pearlite
                                                                                           For each curve, data were collected after rapidly cooling a specimen compos
                                                                                           100% austenite to the temperature indicated; that temperature was maintained
                                                                                                                                 1200
                                              C                                            stant throughout the course of the reaction.
Temperature (°C)


                                                                                                                                                   Temperature (°F)
                                                                                                A more convenient way of representing both the time and temperatur
                         B                             D                                   pendence of this transformation is in the bottom portion of Figure 10.13. Her
                   600                                                                   Fe3C
                                                                                           vertical and horizontal axes are, respectively, temperature and the logarithm of
                                                                                           Two solid curves are plotted; one represents the time required at each temper
                                                                                           for the initiation or start of the transformation; the other is for the transform
                                                  Fine pearlite                            conclusion. The dashed curve corresponds to 50% of transformation compl
                                                                                           These curves were generated from a series of plots of the percentage transfo
                                                                                           tion versus the logarithm of time taken over a range of temperatures. The S-sh
                                                                                                                                 1000
                                                                                           curve [for 675ЊC (1247ЊF)], in the upper portion of Figure 10.13, illustrates ho
                                                                                           data transfer is made.
                             Austenite → pearlite
                   500
                               transformation                                        Denotes thatinterpreting this diagram, note first that the eutectoid temperature [
                                                                                                In a transformation
                                                                                           (1341ЊF)] is indicated by a horizontal line; at temperatures above the eutecto
                                                                                        is occurring

                                                                                                               100                                                    0                     Figure 10.12 For
                                                                                                                                                                                            iron–carbon alloy
                                                                                                                                            800                                             eutectoid composi
                                                                                                                                                                                            (0.76 wt% C),
                                     1            10              102                   103                          104               105                                                  isothermal fractio


                                                                                                                                                                           cent austenite
                                                                                              rcent pearlite


                                                                                                                                                                                            reacted versus the
                                                                         Time (s)                               50    600°C   650°C        675°C                      50                    logarithm of time
                                                                                                                                                                                            the austenite-to-p
REAÇÃO EUTETÓIDE - Perlita
8 • Chapter 10 / Phase Transformations in Metals        Sistema Fe-C
        Figure 10.15
 otomicrographs of
 (a) coarse pearlite
 d (b) fine pearlite.
 00ϫ. (From K. M.
     Ralls et al., An
     Introduction to
 terials Science and
Engineering, p. 361.
 pyright © 1976 by
 ohn Wiley & Sons,
 w York. Reprinted
   by permission of
 ohn Wiley & Sons,
                Inc.)


                             Perlita Grosseira                                  Perlita Fina
                             For iron–carbon alloys of other compositions, a proeutectoid phase (either
                        ferrite or cementite) will coexist with pearlite, as discussed in Section 9.19. Thus
                        additional curves corresponding to a proeutectoid transformation also must be in-
Diagramas de Equilibrio e Transformações

Weitere ähnliche Inhalte

Was ist angesagt?

Ciências dos Materiais - Aula 16 e 17 - Apresentação dos Diagramas de fases
Ciências dos Materiais - Aula 16 e 17 - Apresentação dos Diagramas de fasesCiências dos Materiais - Aula 16 e 17 - Apresentação dos Diagramas de fases
Ciências dos Materiais - Aula 16 e 17 - Apresentação dos Diagramas de fasesFelipe Machado
 
Aula 2 diagrama de fases
Aula 2 diagrama de fasesAula 2 diagrama de fases
Aula 2 diagrama de fasesGian Remundini
 
RELATÓRIO DE AULA PRÁTICA: EXTRAÇÃO LÍQUIDO - LÍQUIDO
 RELATÓRIO DE AULA PRÁTICA: EXTRAÇÃO LÍQUIDO - LÍQUIDO RELATÓRIO DE AULA PRÁTICA: EXTRAÇÃO LÍQUIDO - LÍQUIDO
RELATÓRIO DE AULA PRÁTICA: EXTRAÇÃO LÍQUIDO - LÍQUIDOEzequias Guimaraes
 
REATORES CONTINUOS, EM SÉRIE E PARELELO
REATORES CONTINUOS, EM SÉRIE E PARELELOREATORES CONTINUOS, EM SÉRIE E PARELELO
REATORES CONTINUOS, EM SÉRIE E PARELELODaphne Rodrigues
 
Aula 3 ensaios mecânicos e end - ensaio de compressão
Aula 3   ensaios mecânicos e end - ensaio de compressãoAula 3   ensaios mecânicos e end - ensaio de compressão
Aula 3 ensaios mecânicos e end - ensaio de compressãoAlex Leal
 
Aula 13 balanço de massa - prof. nelson (area 1) - 29.04.11
Aula 13   balanço de massa - prof. nelson (area 1) - 29.04.11Aula 13   balanço de massa - prof. nelson (area 1) - 29.04.11
Aula 13 balanço de massa - prof. nelson (area 1) - 29.04.11Nelson Virgilio Carvalho Filho
 
Apostila técnica de mecânica dos fluidos
Apostila técnica de mecânica dos fluidosApostila técnica de mecânica dos fluidos
Apostila técnica de mecânica dos fluidosValdineilao Lao
 
Síntese e caracterização do cloreto de hexaamminníquel (ii)
Síntese e caracterização do cloreto de hexaamminníquel (ii)Síntese e caracterização do cloreto de hexaamminníquel (ii)
Síntese e caracterização do cloreto de hexaamminníquel (ii)Cybele Sobrenome
 
Industria Do Petr4óLeo
Industria Do Petr4óLeoIndustria Do Petr4óLeo
Industria Do Petr4óLeoBruno Silva
 
RELATÓRIO DE AULA PRÁTICA: DESTILAÇÃO FRACIONADA E PONTO DE EBULIÇÃO
RELATÓRIO DE AULA PRÁTICA: DESTILAÇÃO FRACIONADA E PONTO DE EBULIÇÃORELATÓRIO DE AULA PRÁTICA: DESTILAÇÃO FRACIONADA E PONTO DE EBULIÇÃO
RELATÓRIO DE AULA PRÁTICA: DESTILAÇÃO FRACIONADA E PONTO DE EBULIÇÃOEzequias Guimaraes
 
Substituição aromática eletrofilíca
Substituição aromática eletrofilícaSubstituição aromática eletrofilíca
Substituição aromática eletrofilícaAdrianne Mendonça
 
Relatorio de Química analítica Qualitativa cátions grupo II
Relatorio de Química analítica Qualitativa cátions grupo IIRelatorio de Química analítica Qualitativa cátions grupo II
Relatorio de Química analítica Qualitativa cátions grupo IIErica Souza
 
Lista - fenômenos de superfície
Lista - fenômenos de superfícieLista - fenômenos de superfície
Lista - fenômenos de superfícieMárcio Martins
 

Was ist angesagt? (20)

Ciências dos Materiais - Aula 16 e 17 - Apresentação dos Diagramas de fases
Ciências dos Materiais - Aula 16 e 17 - Apresentação dos Diagramas de fasesCiências dos Materiais - Aula 16 e 17 - Apresentação dos Diagramas de fases
Ciências dos Materiais - Aula 16 e 17 - Apresentação dos Diagramas de fases
 
Aula 2 diagrama de fases
Aula 2 diagrama de fasesAula 2 diagrama de fases
Aula 2 diagrama de fases
 
RELATÓRIO DE AULA PRÁTICA: EXTRAÇÃO LÍQUIDO - LÍQUIDO
 RELATÓRIO DE AULA PRÁTICA: EXTRAÇÃO LÍQUIDO - LÍQUIDO RELATÓRIO DE AULA PRÁTICA: EXTRAÇÃO LÍQUIDO - LÍQUIDO
RELATÓRIO DE AULA PRÁTICA: EXTRAÇÃO LÍQUIDO - LÍQUIDO
 
REATORES CONTINUOS, EM SÉRIE E PARELELO
REATORES CONTINUOS, EM SÉRIE E PARELELOREATORES CONTINUOS, EM SÉRIE E PARELELO
REATORES CONTINUOS, EM SÉRIE E PARELELO
 
Reações com carbonatos e bicarbonatos
Reações com carbonatos e bicarbonatosReações com carbonatos e bicarbonatos
Reações com carbonatos e bicarbonatos
 
Aula 3 ensaios mecânicos e end - ensaio de compressão
Aula 3   ensaios mecânicos e end - ensaio de compressãoAula 3   ensaios mecânicos e end - ensaio de compressão
Aula 3 ensaios mecânicos e end - ensaio de compressão
 
Aula 13 balanço de massa - prof. nelson (area 1) - 29.04.11
Aula 13   balanço de massa - prof. nelson (area 1) - 29.04.11Aula 13   balanço de massa - prof. nelson (area 1) - 29.04.11
Aula 13 balanço de massa - prof. nelson (area 1) - 29.04.11
 
Apostila técnica de mecânica dos fluidos
Apostila técnica de mecânica dos fluidosApostila técnica de mecânica dos fluidos
Apostila técnica de mecânica dos fluidos
 
Síntese e caracterização do cloreto de hexaamminníquel (ii)
Síntese e caracterização do cloreto de hexaamminníquel (ii)Síntese e caracterização do cloreto de hexaamminníquel (ii)
Síntese e caracterização do cloreto de hexaamminníquel (ii)
 
Industria Do Petr4óLeo
Industria Do Petr4óLeoIndustria Do Petr4óLeo
Industria Do Petr4óLeo
 
RELATÓRIO DE AULA PRÁTICA: DESTILAÇÃO FRACIONADA E PONTO DE EBULIÇÃO
RELATÓRIO DE AULA PRÁTICA: DESTILAÇÃO FRACIONADA E PONTO DE EBULIÇÃORELATÓRIO DE AULA PRÁTICA: DESTILAÇÃO FRACIONADA E PONTO DE EBULIÇÃO
RELATÓRIO DE AULA PRÁTICA: DESTILAÇÃO FRACIONADA E PONTO DE EBULIÇÃO
 
mecanica dos fluidos
mecanica dos fluidosmecanica dos fluidos
mecanica dos fluidos
 
Substituição aromática eletrofilíca
Substituição aromática eletrofilícaSubstituição aromática eletrofilíca
Substituição aromática eletrofilíca
 
Relatorio de Química analítica Qualitativa cátions grupo II
Relatorio de Química analítica Qualitativa cátions grupo IIRelatorio de Química analítica Qualitativa cátions grupo II
Relatorio de Química analítica Qualitativa cátions grupo II
 
Psicrometria
PsicrometriaPsicrometria
Psicrometria
 
Coeficiente de atividade
Coeficiente de atividadeCoeficiente de atividade
Coeficiente de atividade
 
Ifsp dinâmica dos fluidos
Ifsp dinâmica dos fluidosIfsp dinâmica dos fluidos
Ifsp dinâmica dos fluidos
 
Lista - fenômenos de superfície
Lista - fenômenos de superfícieLista - fenômenos de superfície
Lista - fenômenos de superfície
 
SEDIMENTAÇÃO
SEDIMENTAÇÃOSEDIMENTAÇÃO
SEDIMENTAÇÃO
 
Aula 6 __a_qu_mica_dos_organomet_licos_do_bloco_d
Aula 6 __a_qu_mica_dos_organomet_licos_do_bloco_dAula 6 __a_qu_mica_dos_organomet_licos_do_bloco_d
Aula 6 __a_qu_mica_dos_organomet_licos_do_bloco_d
 

Andere mochten auch

5 diagrama ferro carbono
5 diagrama ferro carbono5 diagrama ferro carbono
5 diagrama ferro carbonoThulio Cesar
 
Diagramas de equilíbrio de fases mg pb
Diagramas de equilíbrio de fases mg pbDiagramas de equilíbrio de fases mg pb
Diagramas de equilíbrio de fases mg pbLuma Marques
 
Diagrama de ferro carbono
Diagrama de ferro carbonoDiagrama de ferro carbono
Diagrama de ferro carbonoLukasSeize
 
Results 2012 Netriders LATAM Phase 3
Results 2012 Netriders LATAM Phase 3Results 2012 Netriders LATAM Phase 3
Results 2012 Netriders LATAM Phase 3guestNR
 
Ict phase 1 español
Ict phase 1   españolIct phase 1   español
Ict phase 1 españolsparky32
 
Music With Loans
Music  With LoansMusic  With Loans
Music With Loanssolalopes
 
Environmental assessment and control
Environmental assessment and controlEnvironmental assessment and control
Environmental assessment and controlJavier de Vicente
 
Diapositivas Interfases
Diapositivas InterfasesDiapositivas Interfases
Diapositivas Interfasesgueste9e8e9
 
Apresentação da iv formação sea luciana
Apresentação da iv formação   sea lucianaApresentação da iv formação   sea luciana
Apresentação da iv formação sea lucianaHeloiza Moura
 
GenéTica Bacteriana
GenéTica BacterianaGenéTica Bacteriana
GenéTica Bacterianarmoraga
 
Estratégias de leitura
Estratégias de leituraEstratégias de leitura
Estratégias de leituraAle0507
 
Robos Y Fraudes Informáticos
Robos Y Fraudes InformáticosRobos Y Fraudes Informáticos
Robos Y Fraudes Informáticosguest0b9717
 

Andere mochten auch (20)

5 diagrama ferro carbono
5 diagrama ferro carbono5 diagrama ferro carbono
5 diagrama ferro carbono
 
Diagramas de equilíbrio de fases mg pb
Diagramas de equilíbrio de fases mg pbDiagramas de equilíbrio de fases mg pb
Diagramas de equilíbrio de fases mg pb
 
Diagramas De Fase
Diagramas De FaseDiagramas De Fase
Diagramas De Fase
 
Diagrama de ferro carbono
Diagrama de ferro carbonoDiagrama de ferro carbono
Diagrama de ferro carbono
 
diagrama de fases
diagrama de fases diagrama de fases
diagrama de fases
 
Apostila cm
Apostila cmApostila cm
Apostila cm
 
Results 2012 Netriders LATAM Phase 3
Results 2012 Netriders LATAM Phase 3Results 2012 Netriders LATAM Phase 3
Results 2012 Netriders LATAM Phase 3
 
Phase 2 refuel
Phase 2   refuelPhase 2   refuel
Phase 2 refuel
 
Muscle tech phase 8
Muscle tech phase 8Muscle tech phase 8
Muscle tech phase 8
 
Ict phase 1 español
Ict phase 1   españolIct phase 1   español
Ict phase 1 español
 
Music With Loans
Music  With LoansMusic  With Loans
Music With Loans
 
Sessão 7 – Partilha de Reformas na Área do Comércio International SISTEMA D...
Sessão 7  – Partilha de Reformas na Área do Comércio International  SISTEMA D...Sessão 7  – Partilha de Reformas na Área do Comércio International  SISTEMA D...
Sessão 7 – Partilha de Reformas na Área do Comércio International SISTEMA D...
 
Environmental assessment and control
Environmental assessment and controlEnvironmental assessment and control
Environmental assessment and control
 
Diapositivas Interfases
Diapositivas InterfasesDiapositivas Interfases
Diapositivas Interfases
 
Apresentação da iv formação sea luciana
Apresentação da iv formação   sea lucianaApresentação da iv formação   sea luciana
Apresentação da iv formação sea luciana
 
GenéTica Bacteriana
GenéTica BacterianaGenéTica Bacteriana
GenéTica Bacteriana
 
Estratégias de leitura
Estratégias de leituraEstratégias de leitura
Estratégias de leitura
 
Artefactos en Resonancia Magnética
Artefactos en Resonancia MagnéticaArtefactos en Resonancia Magnética
Artefactos en Resonancia Magnética
 
Robos Y Fraudes Informáticos
Robos Y Fraudes InformáticosRobos Y Fraudes Informáticos
Robos Y Fraudes Informáticos
 
Cromatografia líquida moderna
Cromatografia líquida modernaCromatografia líquida moderna
Cromatografia líquida moderna
 

Ähnlich wie Diagramas de Equilibrio e Transformações

Phase diagram (Muda Ibrahim)
Phase diagram (Muda Ibrahim)Phase diagram (Muda Ibrahim)
Phase diagram (Muda Ibrahim)Muda Ibrahim
 
Diagramas de fase
Diagramas de faseDiagramas de fase
Diagramas de faseIncopin
 
unit 2 pdf on applied physics of enginnering
unit 2 pdf on applied physics of enginneringunit 2 pdf on applied physics of enginnering
unit 2 pdf on applied physics of enginneringShivangiGupta205186
 
Lab 2 - The Phase Rule , binary phase -new.ppt
Lab 2 - The Phase Rule , binary phase  -new.pptLab 2 - The Phase Rule , binary phase  -new.ppt
Lab 2 - The Phase Rule , binary phase -new.pptMihirMandal7
 
90780 2010 particles and thermochemistry
90780 2010 particles and thermochemistry90780 2010 particles and thermochemistry
90780 2010 particles and thermochemistryjohnwest
 
Phase Equilibrium
Phase EquilibriumPhase Equilibrium
Phase EquilibriumSHILPA JOY
 
Simulation of Steam Coal Gasifier
Simulation of Steam Coal GasifierSimulation of Steam Coal Gasifier
Simulation of Steam Coal Gasifieregepaul
 
5 phase rule and steels
5 phase rule and steels5 phase rule and steels
5 phase rule and steelsEkeeda
 
CHAPTER 9.1 - PHASE DIAGRAMS FOR METALLIC SYSTEMS.pdf
CHAPTER 9.1 - PHASE DIAGRAMS FOR METALLIC SYSTEMS.pdfCHAPTER 9.1 - PHASE DIAGRAMS FOR METALLIC SYSTEMS.pdf
CHAPTER 9.1 - PHASE DIAGRAMS FOR METALLIC SYSTEMS.pdfMuhammadMirwazi
 
AS 90780 2010 particles and thermochemistry
AS 90780 2010 particles and thermochemistryAS 90780 2010 particles and thermochemistry
AS 90780 2010 particles and thermochemistryjohnwest
 
HSC Chemistry Preparation Tips Part - I
HSC Chemistry Preparation Tips Part - IHSC Chemistry Preparation Tips Part - I
HSC Chemistry Preparation Tips Part - IEdnexa
 
Phase diagram of a one component system ( water system )
Phase diagram of a one component system ( water system )Phase diagram of a one component system ( water system )
Phase diagram of a one component system ( water system )ShahriarTipu1
 

Ähnlich wie Diagramas de Equilibrio e Transformações (20)

Phase diagram (Muda Ibrahim)
Phase diagram (Muda Ibrahim)Phase diagram (Muda Ibrahim)
Phase diagram (Muda Ibrahim)
 
Diagramas de fase
Diagramas de faseDiagramas de fase
Diagramas de fase
 
unit 2 pdf on applied physics of enginnering
unit 2 pdf on applied physics of enginneringunit 2 pdf on applied physics of enginnering
unit 2 pdf on applied physics of enginnering
 
Ch09 m
Ch09 mCh09 m
Ch09 m
 
Steam tables
Steam tablesSteam tables
Steam tables
 
Lecture 11.pdf
Lecture 11.pdfLecture 11.pdf
Lecture 11.pdf
 
Lab 2 - The Phase Rule , binary phase -new.ppt
Lab 2 - The Phase Rule , binary phase  -new.pptLab 2 - The Phase Rule , binary phase  -new.ppt
Lab 2 - The Phase Rule , binary phase -new.ppt
 
90780 2010 particles and thermochemistry
90780 2010 particles and thermochemistry90780 2010 particles and thermochemistry
90780 2010 particles and thermochemistry
 
Phase rule
Phase rulePhase rule
Phase rule
 
Phase Equilibrium
Phase EquilibriumPhase Equilibrium
Phase Equilibrium
 
Simulation of Steam Coal Gasifier
Simulation of Steam Coal GasifierSimulation of Steam Coal Gasifier
Simulation of Steam Coal Gasifier
 
5 phase rule and steels
5 phase rule and steels5 phase rule and steels
5 phase rule and steels
 
phase diagram2.pdf
phase diagram2.pdfphase diagram2.pdf
phase diagram2.pdf
 
CHAPTER 9.1 - PHASE DIAGRAMS FOR METALLIC SYSTEMS.pdf
CHAPTER 9.1 - PHASE DIAGRAMS FOR METALLIC SYSTEMS.pdfCHAPTER 9.1 - PHASE DIAGRAMS FOR METALLIC SYSTEMS.pdf
CHAPTER 9.1 - PHASE DIAGRAMS FOR METALLIC SYSTEMS.pdf
 
AS 90780 2010 particles and thermochemistry
AS 90780 2010 particles and thermochemistryAS 90780 2010 particles and thermochemistry
AS 90780 2010 particles and thermochemistry
 
HSC Chemistry Preparation Tips Part - I
HSC Chemistry Preparation Tips Part - IHSC Chemistry Preparation Tips Part - I
HSC Chemistry Preparation Tips Part - I
 
Phy351 ch 5
Phy351 ch 5Phy351 ch 5
Phy351 ch 5
 
Phy351 ch 5
Phy351 ch 5Phy351 ch 5
Phy351 ch 5
 
Phase diagram of a one component system ( water system )
Phase diagram of a one component system ( water system )Phase diagram of a one component system ( water system )
Phase diagram of a one component system ( water system )
 
E1 reaction
E1 reactionE1 reaction
E1 reaction
 

Mehr von Daphiny Pottmaier

MRS2015 - Integrating Education-Society-Technology through Engineering Educat...
MRS2015 - Integrating Education-Society-Technology through Engineering Educat...MRS2015 - Integrating Education-Society-Technology through Engineering Educat...
MRS2015 - Integrating Education-Society-Technology through Engineering Educat...Daphiny Pottmaier
 
Mobility & EURAXESS_Daphiny.pptx
Mobility & EURAXESS_Daphiny.pptxMobility & EURAXESS_Daphiny.pptx
Mobility & EURAXESS_Daphiny.pptxDaphiny Pottmaier
 
[Aplicacoes] Estrutura Cristalina de Solidos
[Aplicacoes] Estrutura Cristalina de Solidos[Aplicacoes] Estrutura Cristalina de Solidos
[Aplicacoes] Estrutura Cristalina de SolidosDaphiny Pottmaier
 
Ligas de Alumínio: Metalurgia Física, Propriedades Mecânicas e Aplicações na ...
Ligas de Alumínio: Metalurgia Física, Propriedades Mecânicas e Aplicações na ...Ligas de Alumínio: Metalurgia Física, Propriedades Mecânicas e Aplicações na ...
Ligas de Alumínio: Metalurgia Física, Propriedades Mecânicas e Aplicações na ...Daphiny Pottmaier
 
Metodo Rietveld: Passo a Passo
Metodo Rietveld: Passo a PassoMetodo Rietveld: Passo a Passo
Metodo Rietveld: Passo a PassoDaphiny Pottmaier
 
[INTRO] Estrutura cristalina
[INTRO] Estrutura cristalina[INTRO] Estrutura cristalina
[INTRO] Estrutura cristalinaDaphiny Pottmaier
 

Mehr von Daphiny Pottmaier (7)

A arte da pesquisa.pptx
A arte da pesquisa.pptxA arte da pesquisa.pptx
A arte da pesquisa.pptx
 
MRS2015 - Integrating Education-Society-Technology through Engineering Educat...
MRS2015 - Integrating Education-Society-Technology through Engineering Educat...MRS2015 - Integrating Education-Society-Technology through Engineering Educat...
MRS2015 - Integrating Education-Society-Technology through Engineering Educat...
 
Mobility & EURAXESS_Daphiny.pptx
Mobility & EURAXESS_Daphiny.pptxMobility & EURAXESS_Daphiny.pptx
Mobility & EURAXESS_Daphiny.pptx
 
[Aplicacoes] Estrutura Cristalina de Solidos
[Aplicacoes] Estrutura Cristalina de Solidos[Aplicacoes] Estrutura Cristalina de Solidos
[Aplicacoes] Estrutura Cristalina de Solidos
 
Ligas de Alumínio: Metalurgia Física, Propriedades Mecânicas e Aplicações na ...
Ligas de Alumínio: Metalurgia Física, Propriedades Mecânicas e Aplicações na ...Ligas de Alumínio: Metalurgia Física, Propriedades Mecânicas e Aplicações na ...
Ligas de Alumínio: Metalurgia Física, Propriedades Mecânicas e Aplicações na ...
 
Metodo Rietveld: Passo a Passo
Metodo Rietveld: Passo a PassoMetodo Rietveld: Passo a Passo
Metodo Rietveld: Passo a Passo
 
[INTRO] Estrutura cristalina
[INTRO] Estrutura cristalina[INTRO] Estrutura cristalina
[INTRO] Estrutura cristalina
 

Kürzlich hochgeladen

INTRODUCTION TO CATHOLIC CHRISTOLOGY.pptx
INTRODUCTION TO CATHOLIC CHRISTOLOGY.pptxINTRODUCTION TO CATHOLIC CHRISTOLOGY.pptx
INTRODUCTION TO CATHOLIC CHRISTOLOGY.pptxHumphrey A Beña
 
Inclusivity Essentials_ Creating Accessible Websites for Nonprofits .pdf
Inclusivity Essentials_ Creating Accessible Websites for Nonprofits .pdfInclusivity Essentials_ Creating Accessible Websites for Nonprofits .pdf
Inclusivity Essentials_ Creating Accessible Websites for Nonprofits .pdfTechSoup
 
4.16.24 Poverty and Precarity--Desmond.pptx
4.16.24 Poverty and Precarity--Desmond.pptx4.16.24 Poverty and Precarity--Desmond.pptx
4.16.24 Poverty and Precarity--Desmond.pptxmary850239
 
Difference Between Search & Browse Methods in Odoo 17
Difference Between Search & Browse Methods in Odoo 17Difference Between Search & Browse Methods in Odoo 17
Difference Between Search & Browse Methods in Odoo 17Celine George
 
Full Stack Web Development Course for Beginners
Full Stack Web Development Course  for BeginnersFull Stack Web Development Course  for Beginners
Full Stack Web Development Course for BeginnersSabitha Banu
 
Influencing policy (training slides from Fast Track Impact)
Influencing policy (training slides from Fast Track Impact)Influencing policy (training slides from Fast Track Impact)
Influencing policy (training slides from Fast Track Impact)Mark Reed
 
Karra SKD Conference Presentation Revised.pptx
Karra SKD Conference Presentation Revised.pptxKarra SKD Conference Presentation Revised.pptx
Karra SKD Conference Presentation Revised.pptxAshokKarra1
 
Q4-PPT-Music9_Lesson-1-Romantic-Opera.pptx
Q4-PPT-Music9_Lesson-1-Romantic-Opera.pptxQ4-PPT-Music9_Lesson-1-Romantic-Opera.pptx
Q4-PPT-Music9_Lesson-1-Romantic-Opera.pptxlancelewisportillo
 
USPS® Forced Meter Migration - How to Know if Your Postage Meter Will Soon be...
USPS® Forced Meter Migration - How to Know if Your Postage Meter Will Soon be...USPS® Forced Meter Migration - How to Know if Your Postage Meter Will Soon be...
USPS® Forced Meter Migration - How to Know if Your Postage Meter Will Soon be...Postal Advocate Inc.
 
Concurrency Control in Database Management system
Concurrency Control in Database Management systemConcurrency Control in Database Management system
Concurrency Control in Database Management systemChristalin Nelson
 
Music 9 - 4th quarter - Vocal Music of the Romantic Period.pptx
Music 9 - 4th quarter - Vocal Music of the Romantic Period.pptxMusic 9 - 4th quarter - Vocal Music of the Romantic Period.pptx
Music 9 - 4th quarter - Vocal Music of the Romantic Period.pptxleah joy valeriano
 
Earth Day Presentation wow hello nice great
Earth Day Presentation wow hello nice greatEarth Day Presentation wow hello nice great
Earth Day Presentation wow hello nice greatYousafMalik24
 
ISYU TUNGKOL SA SEKSWLADIDA (ISSUE ABOUT SEXUALITY
ISYU TUNGKOL SA SEKSWLADIDA (ISSUE ABOUT SEXUALITYISYU TUNGKOL SA SEKSWLADIDA (ISSUE ABOUT SEXUALITY
ISYU TUNGKOL SA SEKSWLADIDA (ISSUE ABOUT SEXUALITYKayeClaireEstoconing
 
4.16.24 21st Century Movements for Black Lives.pptx
4.16.24 21st Century Movements for Black Lives.pptx4.16.24 21st Century Movements for Black Lives.pptx
4.16.24 21st Century Movements for Black Lives.pptxmary850239
 
Daily Lesson Plan in Mathematics Quarter 4
Daily Lesson Plan in Mathematics Quarter 4Daily Lesson Plan in Mathematics Quarter 4
Daily Lesson Plan in Mathematics Quarter 4JOYLYNSAMANIEGO
 
Keynote by Prof. Wurzer at Nordex about IP-design
Keynote by Prof. Wurzer at Nordex about IP-designKeynote by Prof. Wurzer at Nordex about IP-design
Keynote by Prof. Wurzer at Nordex about IP-designMIPLM
 
AUDIENCE THEORY -CULTIVATION THEORY - GERBNER.pptx
AUDIENCE THEORY -CULTIVATION THEORY -  GERBNER.pptxAUDIENCE THEORY -CULTIVATION THEORY -  GERBNER.pptx
AUDIENCE THEORY -CULTIVATION THEORY - GERBNER.pptxiammrhaywood
 
Transaction Management in Database Management System
Transaction Management in Database Management SystemTransaction Management in Database Management System
Transaction Management in Database Management SystemChristalin Nelson
 

Kürzlich hochgeladen (20)

YOUVE_GOT_EMAIL_PRELIMS_EL_DORADO_2024.pptx
YOUVE_GOT_EMAIL_PRELIMS_EL_DORADO_2024.pptxYOUVE_GOT_EMAIL_PRELIMS_EL_DORADO_2024.pptx
YOUVE_GOT_EMAIL_PRELIMS_EL_DORADO_2024.pptx
 
INTRODUCTION TO CATHOLIC CHRISTOLOGY.pptx
INTRODUCTION TO CATHOLIC CHRISTOLOGY.pptxINTRODUCTION TO CATHOLIC CHRISTOLOGY.pptx
INTRODUCTION TO CATHOLIC CHRISTOLOGY.pptx
 
Inclusivity Essentials_ Creating Accessible Websites for Nonprofits .pdf
Inclusivity Essentials_ Creating Accessible Websites for Nonprofits .pdfInclusivity Essentials_ Creating Accessible Websites for Nonprofits .pdf
Inclusivity Essentials_ Creating Accessible Websites for Nonprofits .pdf
 
4.16.24 Poverty and Precarity--Desmond.pptx
4.16.24 Poverty and Precarity--Desmond.pptx4.16.24 Poverty and Precarity--Desmond.pptx
4.16.24 Poverty and Precarity--Desmond.pptx
 
Difference Between Search & Browse Methods in Odoo 17
Difference Between Search & Browse Methods in Odoo 17Difference Between Search & Browse Methods in Odoo 17
Difference Between Search & Browse Methods in Odoo 17
 
Full Stack Web Development Course for Beginners
Full Stack Web Development Course  for BeginnersFull Stack Web Development Course  for Beginners
Full Stack Web Development Course for Beginners
 
Influencing policy (training slides from Fast Track Impact)
Influencing policy (training slides from Fast Track Impact)Influencing policy (training slides from Fast Track Impact)
Influencing policy (training slides from Fast Track Impact)
 
Karra SKD Conference Presentation Revised.pptx
Karra SKD Conference Presentation Revised.pptxKarra SKD Conference Presentation Revised.pptx
Karra SKD Conference Presentation Revised.pptx
 
Q4-PPT-Music9_Lesson-1-Romantic-Opera.pptx
Q4-PPT-Music9_Lesson-1-Romantic-Opera.pptxQ4-PPT-Music9_Lesson-1-Romantic-Opera.pptx
Q4-PPT-Music9_Lesson-1-Romantic-Opera.pptx
 
USPS® Forced Meter Migration - How to Know if Your Postage Meter Will Soon be...
USPS® Forced Meter Migration - How to Know if Your Postage Meter Will Soon be...USPS® Forced Meter Migration - How to Know if Your Postage Meter Will Soon be...
USPS® Forced Meter Migration - How to Know if Your Postage Meter Will Soon be...
 
Concurrency Control in Database Management system
Concurrency Control in Database Management systemConcurrency Control in Database Management system
Concurrency Control in Database Management system
 
Music 9 - 4th quarter - Vocal Music of the Romantic Period.pptx
Music 9 - 4th quarter - Vocal Music of the Romantic Period.pptxMusic 9 - 4th quarter - Vocal Music of the Romantic Period.pptx
Music 9 - 4th quarter - Vocal Music of the Romantic Period.pptx
 
Earth Day Presentation wow hello nice great
Earth Day Presentation wow hello nice greatEarth Day Presentation wow hello nice great
Earth Day Presentation wow hello nice great
 
ISYU TUNGKOL SA SEKSWLADIDA (ISSUE ABOUT SEXUALITY
ISYU TUNGKOL SA SEKSWLADIDA (ISSUE ABOUT SEXUALITYISYU TUNGKOL SA SEKSWLADIDA (ISSUE ABOUT SEXUALITY
ISYU TUNGKOL SA SEKSWLADIDA (ISSUE ABOUT SEXUALITY
 
4.16.24 21st Century Movements for Black Lives.pptx
4.16.24 21st Century Movements for Black Lives.pptx4.16.24 21st Century Movements for Black Lives.pptx
4.16.24 21st Century Movements for Black Lives.pptx
 
LEFT_ON_C'N_ PRELIMS_EL_DORADO_2024.pptx
LEFT_ON_C'N_ PRELIMS_EL_DORADO_2024.pptxLEFT_ON_C'N_ PRELIMS_EL_DORADO_2024.pptx
LEFT_ON_C'N_ PRELIMS_EL_DORADO_2024.pptx
 
Daily Lesson Plan in Mathematics Quarter 4
Daily Lesson Plan in Mathematics Quarter 4Daily Lesson Plan in Mathematics Quarter 4
Daily Lesson Plan in Mathematics Quarter 4
 
Keynote by Prof. Wurzer at Nordex about IP-design
Keynote by Prof. Wurzer at Nordex about IP-designKeynote by Prof. Wurzer at Nordex about IP-design
Keynote by Prof. Wurzer at Nordex about IP-design
 
AUDIENCE THEORY -CULTIVATION THEORY - GERBNER.pptx
AUDIENCE THEORY -CULTIVATION THEORY -  GERBNER.pptxAUDIENCE THEORY -CULTIVATION THEORY -  GERBNER.pptx
AUDIENCE THEORY -CULTIVATION THEORY - GERBNER.pptx
 
Transaction Management in Database Management System
Transaction Management in Database Management SystemTransaction Management in Database Management System
Transaction Management in Database Management System
 

Diagramas de Equilibrio e Transformações

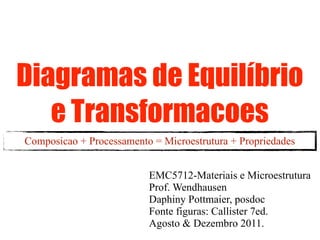
  • 1. Diagramas de Equilíbrio e Transformacoes Composicao + Processamento = Microestrutura + Propriedades EMC5712-Materiais e Microestrutura Prof. Wendhausen Daphiny Pottmaier, posdoc Fonte figuras: Callister 7ed. Agosto & Dezembro 2011.
  • 2. GOL • Esbocar diagramas de fases simples (isomorfos, euteticos e eutetoides); • Identificar as regioes de fases, linhas liquidus- solvus-solidus e pontos de coexistencia; • Calcular composicoes das fases (linha de amarracao) e fracoes massicas (regra da alavanca); • Localizar as temperaturas e composicoes das transformacoes (pontos/linhas); • Escrever as reacoes para as transformacoes e desenvolvimento das microestruturas.
  • 3. Sumario • Contextualizacao • Introducao (aplicacao, limitacao) • Diagramas de Fases/Equilibrio (X,T,P) • Conceitos (componente, fase, sistema, solucao) • Unario (H2O) • Isomorfo (Cu-Ni) • Eutetico (Pb-Sn) • Eutetoide (Fe-C) • Conceitos (difusiva/displaciva, cinetica) • Diagramas Tempo-Temperatura-Transformacao
  • 4. CONTEXTUALIZAÇÃO • Aplicacao: – Quimico-Fisica – Engenharia – Mineralogia – Ciencia dos Materiais • Limitacoes: – Taxa de Transformacao – TTT
  • 5. INTRODUÇÃO EXEMPLOS “PRÁTICOS” – Brasagem com ligas Pb-Sn
  • 6. INTRODUÇÃO EXEMPLOS “PRÁTICOS” - Brasagem de Chips de Si
  • 7. Diagramas de Fases/Equilibrio Mapas para Determinação da Microestrutura Representação gráfica de dados:  informações sobre os compostos puros  natureza das interações entre mais de um componente Informações disponíveis diretamente no diagrama:  Tf de cada componente puro  redução de Tf pela mistura de 2 ou mais componentes  interação de dois componentes (Fe + C) para formar um terceiro (Fe3C )  presença e grau de solubilidade sólida  efeito da temperatura na solubilidade sólida  temperatura de transformação polimórfica  quantidade e composição das fases líquidas e sólidas a temperatura e composição química global específica  presença de líquidos imiscíveis a altas temperaturas
  • 8. DIAGRAMAS DE EQUILIBRIO Representacoes graficas dos estados de equilibrio disponivel para um sistema e a influencia dos estados de equilibrio com a composicao (X), temperatura (T) e pressao (P). Equilibrio se X, T e p sao estaveis, nao muda com o tempo. Descrito termodinamicamente como o estado do sistema dado pela minima energia livre (G).
  • 9. CONCEITOS Componente: elementos quimicos e compostos estoiquiometricos (Al, H2O, Cu, Fe3C) 8 Chapter Sistema: categorizado pelo numero de componentes unario, binario, ternario, quaternario Chapter 8 Phase Diagrams Fase: caracteristicas fisicasae quimicas (solidos), A phase in a material is region that differ in its microstructure and miscibilidade (liquidos) another region (gases) or composition from e uniforme Phase Diagram Homogeneo x Heterogeneo in a material is a region that differ in its mic A phase or composition from another region Solucao: solvente e soluto Limite de Solubilidade Al2CuMg Al2CuMg H2O(solid, ice) in H2O Al (liquid) ! 2 phases H2O(so Al • homogeneous in crystal structure and atomic arrangement (liquid • have same chemicalhomogeneous in crystal structure and atomic arra • and physical properties throughout
  • 10. DIAGRAMA UNARIO composicao quimica fixa, T e P variaveis 100 fusao Liquido congelamento evaporacao H2O 3 fases: solido, condensacao liquido, gas. 1 Solido Pressao [atm] Ponto triplo: sublimacao Gas 0.0098 °C, deposicao 0.0063 atm. 0 100 Regiao: 1 fase Temperatura [°C] Linha: 2 fases SI: Kelvin, Pascal Ponto: 3 fases
  • 12. ALOTROPIA composicao quimica fixa, T e P variaveis I - XV: alotropos do gelo. H2O
  • 13. ENERGIA LIVRE Gsolido G [kJ/mol] G(T,p)= H - T.S H = Href + ∫CpdT Gliquido S = Sref + ∫CpdlnT Ggas H2O 0 100 Temperatura [°C] P=1 atm
  • 14. LEI DAS FASES DE GIBBS Graus de liberdade (F) de um sistema fechado em equilibrio, em termos de fases separadas (P) e componentes quimicos (C) e variaveis do processo (N). 100 Liquido F+P=C+N (i) H2O, C = 1 (ii) 1 Solido (iii) (i) P = 1, F = 2 (ii) P = 2, F = 1 Pressao [atm] Gas (iii) P = 3, F = 0 0 100 Temperatura [°C] F: freedom, P: phase
  • 15. Solubility Limit: Water-Sugar Solubilidade do Açúcar em Água • Changing T can change # of phases: path A to B. • Changing Co can change # of phases: path B to D B (100,70) D(100,90) 1 phase 2 phases 10 0 80 L (liquid) Temperature (°C) 60 + L S (liquid solution (solid 40 i.e., syrup) sugar) 20 A(70, 20 ) T : B-D 2 phases C : B-A 0 0 20 40 60 70 80 10 0 C o =Composition (wt% sugar) Adapted from Callister Chapter 8
  • 16. Sistemas Eutéticos Binários Concept Check 9.5 (SEM solubilidade no estadoO–NaClEx: NaCl-H2O) Below is a portion of the H2 sólido phase diagram: 10 50 Liquid (brine) 40 0 30 Salt Temperature (°C) Temperature (°C) ϩ Ice 20 Liquid ϩ (brine) Ϫ10 Liquid (brine) 10 0 Ϫ20 Ϫ10 Ice ϩ Salt Ϫ20 Ϫ30 NaCl 0 10 20 30 H2O 100 90 80 70 Composition (wt%)
  • 17. SOLUBILIDADE SÓLIDA ELEMENTOS PUROS Regra Hume-Rothery: •Razao raio atomico (± 15%) •Estrutura cristalina •Eletronegatividade (± 0.4 e.u.) •Mesma Valencia
  • 18. SOLUBILIDADE SÓLIDA INTERSTICIAIS
  • 19. DIAGRAMA - experimental "#!$%&'()*+!,-%!,)&%!./)0!1$'&!,-%!23$(%0!.*4!$%56. 23$(%0!)*4)2.,%!,-%!,%&5%$.,3$%0!'1!,-%!0'6)430!.*4!6 .66'70!,-%!0'6)430!.*4!6)93)430!,'!<%!56',,%4!,'!5$'43 ! ! )&%!./)0!1$'&!,-%!23$(%0!.*4!$%56.2)*+!),!7),-!2'&5'0),)'*8!,-%!2''6)*+! %!,%&5%$.,3$%0!'1!,-%!0'6)430!.*4!6)93)430!1'$!.!+)(%*!2'&5'0),)'*:!;-)0! !.*4!6)93)430!,'!<%!56',,%4!,'!5$'432%!,-%!5-.0%!4).+$.&=! ! -%!,)&%!./)0!1$'&!,-%!23$(%0!.*4!$%56.2)*+!),!7),-!2'&5'0),)'*8!,-%!2''6)*+! ! !,-%!,%&5%$.,3$%0!'1!,-%!0'6)430!.*4!6)93)430!1'$!.!+)(%*!2'&5'0),)'*:!;-)0! 430!.*4!6)93)430!,'!<%!56',,%4!,'!5$'432%!,-%!5-.0%!4).+$.&=! !"#$%&#'&(&)#)*'&# >1!.*!.66'#!2'*0)0,0!'1!&'$%!,-.*!'*%!5-.0%8!,-%!.&' 1'3*4!<#!.556#)*+!,-%!6%(%$!$36%!,'!,-%!5-.0%!4).+$.& ! ;-%!6%(%$!$36%!2.*!<%!%/56.)*%4!<#!2'*0)4%$)*+!.!0)& .66'#!)0!$%5$%0%*,%4!<#!,-%!1362$3&!.*4!,-%!2'&5'0) .!<.$:!;-%!5$'5'$,)'*0!'1!,-%!5-.0%0!5$%0%*,!.$%!4%,% <.6.*2%!,-%!0#0,%&:! ! ! !
  • 20. REGRA DA ALAVANCA R Co S α L Wα = S/(R+S) = Co - CL / Cα - CL WL = R/(R+S) = Cα - Co / Cα - CL
  • 21. SISTEMA ISOMORFO Cu-Ni 9.7 Binary Isomorphous Systems • 259 Figure 9.3 (a) The Composition (at% Ni) copper–nickel phase 0 20 40 60 80 100 diagram. (b) A 1600 portion of the copper–nickel phase 2800 diagram for which 1500 compositions and phase amounts are Liquid 1453°C determined at point 2600 B. (Adapted from 1400 Phase Diagrams of Temperature (°C) Temperature (°F) Binary Nickel Alloys, Solidus line P. Nash, Editor, 1991. Liquidus line 2400 1300 ␣ +L Reprinted by permission of ASM B International, Materials Park, OH.) 1200 ␣ 2200 1100 A 2000 1085°C 1000 0 20 40 60 80 100 (Cu) Composition (wt% Ni) (Ni) (a)
  • 22. 6T_c09_252-310 11/29/05 11:33 Page 265 REVISED PAGES DIAGRAMA Cu-Ni Composição9.9 Development das Fases -Isomorphous Alloys • 265 Química of Microstructure in Equilíbrio Figure 9.4 Schematic L representation of the L L development of (35 Ni) (35 Ni) microstructure ␣ (46 Ni) during the 1300 a ␣ equilibrium + L solidification of a 35 wt% Ni–65 wt% Cu alloy. L (32 Ni) b ␣ (46 Ni) c Temperature (°C) ␣ (43 Ni) ␣ (43 Ni) L (24 Ni) d ␣ ␣ L (32 Ni) ␣ ␣ 1200 ␣ e L (24 Ni) ␣ ␣ ␣ ␣ (35 Ni) ␣ ␣ ␣ ␣ ␣ ␣ ␣ ␣ ␣ ␣ ␣ ␣ ␣ (35 Ni) ␣ 1100 20 30 40 50 Composition (wt% Ni)
  • 23. DIAGRAMA BINÁRIO SOLUÇÃO SÓLIDA TOTAL
  • 24. MICROESTRUTURAS DE LIGAS COM SOLUÇÃO SÓLIDA TOTAL
  • 25. alloys are affected by composition as other structural variables (e.g., grain size) are Sistemas Isomorfos held constant. For all temperatures and compositions below the melting tempera- ture of the lowest-melting component, only a single solid phase will exist. There- fore, each component will experience solid-solution strengthening (Section 7.9), or (Propriedades Mecânicas) an increase in strength and hardness by additions of the other component. This effect is demonstrated in Figure 9.6a as tensile strength versus composition for the 60 Elongation (% in 50 mm [2 in.]) 60 400 Tensile strength (MPa) 50 Tensile strength (ksi) 50 40 300 40 30 200 30 20 0 20 40 60 80 100 0 20 40 60 80 100 (Cu) (Ni) (Cu) (Ni) Composition (wt% Ni) Composition (wt% Ni) (a) (b) Figure 9.6 For the copper–nickel system, (a) tensile strength versus composition, and (b) ductility (%EL) versus composition at room temperature. A solid solution exists over all compositions for this system.
  • 26. SISTEMA EUTÉTICO SEM SOLUÇÃO SÓLIDA
  • 27. MICROESTRUTURAS DE LIGAS SEM SOLUÇÃO SÓLIDA
  • 28. molten at about 185ЊC (365ЊF), which makes this material especially attractive as a SISTEMA EUTETICO Pb-Sn low-temperature solder, since it is easily melted. Composition (at% Sn) 0 20 40 60 80 100 327°C 600 300 Liquid 500 232°C ␣ +L Temperature (°C) Temperature (°F) 200 ␣ ␤ +L 400 183°C ␤ 18.3 61.9 97.8 300 100 ␣ + ␤ 200 100 0 0 20 40 60 80 100 (Pb) Composition (wt% Sn) (Sn)
  • 29. tion at the point where ww¿ crosses the solidus line. The resulting alloy is poly- crystalline with a uniform composition of C1, and no subsequent changes will occur DIAGRAMA Pb-Sn 400 Figure 9.11 Schematic L representations of the w (C1 wt% Sn) equilibrium microstructures for ␣ a lead–tin alloy of composition a L b L C1 as it is cooled from the liquid-phase region. 300 Liquidus c ␣ ␣ ␣ +L Temperature (°C) ␣ ␣ Solidus 200 (C1 wt% Sn) ␣ 100 ␣ +␤ wЈ 0 10 20 30 C1 Composition (wt% Sn)
  • 31. (C3 in Figure 9.13). Consider an alloy having this composition that is cooled from a temperature within the liquid-phase region (e.g., 250ЊC) down the vertical line yy¿ SISTEMA EUTETICO Pb-Sn Figure 9.12 Schematic representations of the x equilibrium microstructures L d L for a lead–tin alloy of (C2 wt% Sn) composition C2 as it is cooled from the liquid-phase region. 300 L ␣ e ␣ ␣ ␣ +L Temperature (°C) ␣ 200 ␣ ␣ C2 wt% Sn f ␤ Solvus line g ␣ 100 ␣ +␤ xЈ 0 10 20 30 40 50 C2 Composition (wt% Sn)
  • 32. 1496T_c09_252-310 1/9/06 13:00 Page 280 2nd REVISE PAG DIAGRAMA Pb-Sn 280 • Chapter 9 / Phase Diagrams (liga hipoeutética) L (C4 wt% Sn) z j ␣ 600 300 L ␣ +L L 500 ␣ (18.3 wt% Sn) k Temperature (°C) Temperature (°F) 200 400 ␤ +L ␣ l ␤ m L (61.9 wt% Sn) Eutectic structure 300 Primary ␣ ␣ + ␤ (18.3 wt% Sn) 100 200 ␤ (97.8 wt% Sn) Eutectic ␣ (18.3 wt% Sn) 100 zЈ 0 0 20 60 80 100 (Pb) C4 (Sn) (40) Composition (wt% Sn) Figure 9.16 Schematic representations of the equilibrium microstructures for a lead–tin
  • 33. DIAGRAMA Pb-Sn (liga hipoeutética)
  • 34. Representação Esquemática phase field. To distinguish one a from the other, that which resides in th eutectic phase structure is called eutectic a, while the other that formed prior to cro eutectic isotherm is termed primary a; both are labeled in Figure primary phase Reação Eutética photomicrograph in Figure 9.17 is of a lead–tin alloy in which both prim eutectic structures are shown. Figure 9.15 Schematic represen the formation of the eutectic str ␤ Pb the lead–tin system. Directions o of tin and lead atoms are indicat blue and red arrows, respectively ␣ Sn Liquid ␤ Pb ␣ Sn Eutectic growth direction ␤ Pb
  • 35. apter 9 / Phase Diagrams DIAGRAMA Pb-Sn gure 9.13 chematic ations of 600 300 y L uilibrium (61.9 wt% res for a Sn) n alloy of L 500 h mposition ␣ +L nd below Temperature (°C) Temperature (°F) eutectic 200 ␣ 183°C ␤+L ␤ 400 perature. 18.3 i 97.8 300 100 ␣+␤ 200 ␣ (18.3 wt% ␤ (97.8 wt% Sn) Sn) 100 yЈ 0 0 20 40 60 80 100 (Pb) C3 (Sn) (61.9) Composition (wt%Sn)
  • 37. ENERGIA LIVRE H = Href + ∫CpdT S = Sref + ∫CpdlnT γ 1400˚ G(T,p)= H - T.S Fe3C G [kJ/mol] L G Gccc Gliquido Eutetico 1147˚ Gcfc γ L Fe3C G Fe L T γ 912 1394 1538 γ + Fe3C α α + Fe3C Temperatura [°C] P=1 atm Fe C % Eutetico
  • 38. austenite 912ЊC (1674ЊF). This austenite persists to 1394ЊC (2541ЊF), at which tem SISTEMA EUTETOIDE Fe-C the FCC austenite reverts back to a BCC phase known as d ferrite, whic Composition (at% C) 0 5 10 15 20 25 1600 1538°C 1493°C ␦ L 1400 2500 1394°C ␥+L 1200 1147°C Temperature (°C) Temperature (°F) 2.14 4.30 ␥, Austenite 2000 1000 912°C ␥ + Fe3C 800 ␣ 1500 + 727°C ␥ 0.76 0.022 600 ␣ + Fe3C ␣, Ferrite Cementite (Fe3C) 1000 400 0 1 2 3 4 5 6 6.70 (Fe) Composition (wt% C)
  • 39. Microestruturas Fe-C 9.18 The Iron–Iron Carbide (Fe–Fe3C) Phase Diagram • 291 e 9.25 phs of (90ϫ) tenite yright nited Steel tion.) (a) (b) Microestrutura Ferrita α Microestrutura Austenita melts at 1538ЊC (2800ЊF). All these changes are apparent along the left vertical axis 1
  • 40. Section 9.12 and illustrated in Figure 9.16 for the eutectic system. Consider a com- DIAGRAMA Fe-C position C0 to the left of the eutectoid, between 0.022 and 0.76 wt% C; this is termed hypoeutectoid alloy a hypoeutectoid (less than eutectoid) alloy. Cooling an alloy of this composition is represented by moving down the vertical line yy¿ in Figure 9.29. At about 875ЊC , (liga hipoeutetoide) point c, the microstructure will consist entirely of grains of the g phase, as shown 1100 Figure 9.29 Schematic ␥ representations of the ␥ microstructures for an ␥ ␥ iron–carbon alloy of 1000 ␥ hypoeutectoid composition C0 ␥ + Fe3C (containing less than 0.76 wt% y ␥ M ␥ C) as it is cooled from within 900 the austenite phase region to ␥ ␣ c ␥ below the eutectoid temperature. Temperature (°C) ␥ 800 ␥ d ␥ ␥ e Te N f O 700 ␣ Pearlite 600 Fe3C Proeutectoid ␣ Eutectoid ␣ 500 ␣ + Fe3C yЈ 400 0 1.0 2.0 C0 Composition (wt% C)
  • 41. from grain to grain; some of the pearlite appears dark because the many close spaced layers are unresolved at the magnification of the photomicrograph. The MICROESTRUTURA HIPOEUTETOIDE 0 h C a e e d Proeutectoid ϫ. ferrite h c .) Pearlite
  • 42. Representação Esquemática Reação Eutetoide 9.19 Development of Microstructure in Iron–Carbo Austenite grain Figure 9.28 boundary representatio formation of austenite; dir ␣ diffusion ind Ferrite (␣) Austenite (␥ ) Austenite Ferrite (␣) (␥ ) Ferrite (␣) Cementite Growth direction (Fe3C) Ferrite (␣) of pearlite ␣ Carbon diffusion
  • 43. phase field (Figure 9.24) are relatively complex and similar to those described for the eutectic systems in Section 9.12. Consider, for example, an alloy of eutectoid DIAGRAMA Fe-C composition (0.76 wt% C) as it is cooled from a temperature within the g phase re- gion, say, 800ЊC—that is, beginning at point a in Figure 9.26 and moving down the 1100 Figure 9.26 Schematic representations of the microstructures for an iron–carbon alloy of eutectoid 1000 ␥ ␥ + Fe3C composition (0.76 wt% C) above and below the eutectoid temperature. 900 x ␥ ␥ Temperature (°C) ␥ 800 a ␥ ␣ +␥ 727°C b ␣ 700 ␣ 600 Fe3C 500 ␣ + Fe3C xЈ 400 0 1.0 2.0 Composition (wt% C)
  • 45. 2nd REVISE PAGE DIAGRAMA Fe-C 298 • Chapter 9 / Phase Diagrams (liga hipereutetoide) 1100 P Figure 9.32 Schematic representations of the ␥ + Fe3C microstructures for an iron–carbon alloy of 1000 ␥ z hypereutectoid composition ␥ ␥ C1 (containing between 0.76 ␥ g and 2.14 wt% C), as it is ␥ 900 cooled from within the Fe3C austenite phase region to ␥ below the eutectoid ␥ temperature. Temperature (°C) 800 ␥ h ␥ ␣ +␥ O i 700 ␣ Pearlite 600 ␣ Proeutectoid Fe3C Eutectoid Fe3C 500 ␣ + Fe3C z' 400 0 1.0 2.0 C1 Composition (wt% C)
  • 46. MICROESTRUTURA of Microstructure in Iron–Carbon A 9.19 Development HIPEREUTETOIDE gure 9.33 crograph 4 wt% C having a structure f a white eutectoid network nding the Proeutectoid cementite colonies. opyright y United tes Steel oration.) Pearlite
  • 47. REAÇÃO EUTETÓIDE Sistema Fe-C
  • 48. REAÇÃO EUTETÓIDE Sistema Fe-C MEV MO
  • 49. Sistema Ferro-Carbono Digrama de Equilíbrio
  • 50. Ferro-Fundido Branco Sistema Fe-C
  • 51. Sistema Ferro-Carbono Digrama de Equilíbrio
  • 52. Ferro-Fundido Cinzento Sistema Fe-C
  • 53. eutectoid reaction but also the relative fra Influencia de outros Elementos phase that form. Steels are normally alloy either to improve their corrosion resistan treatment (see Section 11.8). 9.20 The Influence of Other Alloying Elements • 301 Figure 9.34 The dependence of Figu Ti 2400 0.8 eutectoid temperature on alloy com Mo W Ni 1200 2200 concentration for several alloying for Eutectoid temperature (°C) Eutectoid temperature (°F) Eutectoid composition (wt% C) Si elements in steel. (From Edgar C. Edg 2000 0.6 Bain, Functions of the Alloying Elem 1000 American Society 1939 Elements in Steel,Cr 1800 Cr 1600 0.4 for Metals, 1939, p. 127.) 800 Si 1400 Mo Mn 0.2 W Mn 1200 Ti 600 Ni 1000 0 0 2 4 6 8 10 12 14 0 2 4 6 8 10 12 14 Concentration of alloying elements (wt%) Concentration of alloying elements (wt%) Temperatura Eutetoide Composicao Eutetoide existence at room temperature of nonequilibrium phases that do not appear on the
  • 54. required for the transformation to proceed halfway to completion, t0.5, or Transformation rate—reciprocal of 1 rate ϭ (10.18) the halfway-to- t0.5 TEMPO-TEMPERATURA-TRANSFORMAÇÃO completion transformation time Temperature will have a profound influence on the kinetics and thus on the 10_311-357 11/30/05 7:37 Page 323 rate of a transformation. This is PAGES REVISED demonstrated in Figure 10.11, where y-versus-log t 100 :37 Page 323 termodinamicamente REVISED PAGES Percent recrystallized 80 como o estado do sistema The Kinetics of Phase Transformations • 323 10.3 60 135ЊC 119ЊC 113ЊC 102ЊC 88ЊC 43ЊC dado pela minima energia 1.0 Figure 10.10 Plot of fraction reacted versus the logarithm of 40 time typical of many solid-state 20 livre (G). Fraction of transformation, y transformations in which temperature is held constant. 0 2 104 10.3 The Kinetics of Phase Transformations • 323 1 10 10 Time (min) 0.5 (Logarithmic scale) 1.0 Figure 10.11 Percent recrystallization as a function of time and at constant Figure 10.10 Plot of fraction temperature for pure copper. (Reprinted with permission from Metallurgical Representacoes graficas dos t0.5 reacted versus the logarithm of Transactions, Vol. 188, 1950, a publication of The Metallurgical Society of AIME, time typical of many solid-state Warrendale, PA. Adapted from B. F. Decker and D. Harker, “Recrystallization in Rolled Fraction of transformation, y 0 Nucleation estados da CINETICA de Growth transformations in which Copper,” Trans. AIME, 188, 1950, p. 888.) temperature is held constant. transformacao para um sistema Logarithm of heating time, t formed material versus the logarithm of time; an S-shaped emsimilar to that in do tempo (t). curve funcao 0.5 of which is distinctive of the new phase. Data are plotted as the fraction of trans- Figure 10.10 represents the typical kinetic behavior for most solid-state reactions. Nucleation and growth stages are also indicated in the figure. For solid-state transformations displaying the kinetic behavior in Figure 10.10, the fraction of transformation y is a function of time t as follows: t0.5 y ϭ 1 Ϫ exp1Ϫkt 2 Avrami equation— n dependence of (10.17) fraction 0 of transformation where k and n are time-independent constants for the particular reaction. The above on time Nucleation expression is often Growth to as the Avrami equation. referred By convention, the rate of a transformation is taken as the reciprocal of time required for the of heating time, tproceed halfway to completion, t0.5, or Logarithm transformation to Transformation rate—reciprocal of 1 rate ϭ (10.18)
  • 55. CONCEITOS Transformacao de fase: difusiva ou displaciva. Difusiva: solidificacao, alotropicas, recristalizacao, crescimento de grao, etc. Ponto de vista microestrutural: Nucleacao: Homogenea x Heterogenea Crescimento: Displaciva/martensitica: sem difusao, metaestavel. Cinetica: velocidade (tempo) - mecanismo.
  • 56. ters 10 and 11. system has been chosen because it is familiar and because a wide variety crostructures and mechanical properties are possible for iron–carbon (or steel) 9.18 THE IRON–IRON CARBIDE (Fe–Fe3C) Diagrama TTT Fe-C eutetoide PHASE DIAGRAM 10.5 ISOTHERMAL TRANSFORMATION DIAGRAMS diagram is presented in Figure A portion of the iron–carbon phase Pearlite upon heating, experiences two changes in crystal structure before it ferrite temperature the stable form, called ferrite, or a iron, has a BCC c ter 10 / Phase Transformations in Metals Consider again the austenite iron–iron carbide eutectoid reaction Ferrite experiences a polymorphic transformation to FCC austeni 912ЊC (1674ЊF). This austenite persists to 1394ЊC (2541ЊF), at whi Eutectoid reaction the FCC austenite reverts back to a BCC phase known as d ferrit cooling for the iron-iron 100 carbide system Figure 10.13 ∆ a10.022 wt% C2 ϩ Fe3C16.70 wt% C2 (1 g10.76 wt% C2 heating transformed to pearlite Demonstration of how Composition (at% C) Percent of austenite Transformation Transformation which is fundamental to the development of microstructure in steel alloys. an isothermal 5 0 10 15 20 25 temperature 675°C ends 1600 cooling, austenite, having an intermediate carbon concentration, transforms to 1538°C 50 transformation diagram1493°C rite phase, having a much lower carbon content, and also cementite, with a (bottom)␦ is generated L higher carbon concentration. Pearlite is one microstructural product of this 1400 2500 Transformation from percentage ␥ + L formation (Figure1394°C and the mechanism of pearlite formation was disc 9.27), begins previously (Section 9.19) and demonstrated in Figure 9.28. transformation-versus- 1147°C 1200 Temperature plays an important role in the rate of the austenite-to-pe 0 logarithm Austenite ␥, of time 105 transformation. The temperature dependence for an iron–carbon alloy of2000 eute Temperature (°C) 2.14 4.30 1 10 102 103 104 measurements (top). composition is indicated in Figure 10.12, which plots S-shaped curves of the 1000 Time (s) centage transformation versus the logarithm of time at three different tempera [Adapted from H. 912°C ␥ + Fe C 3 For each curve, data were collected after rapidly cooling a specimen compos Boyer, ␣ 800 (Editor), Atlas 100% austenite to the temperature indicated; that temperature was maintained + 1500 727°C of Isothermal ␥ stant throughout the course of the reaction. 0.76 1400 A more convenient way of representing both the time and temperatur Austenite (stable) Eutectoid temperature Transformation and 0.022 pendence of600 transformation is in the+ bottom portion of Figure 10.13. Her this ␣, Ferrite ␣ Fe C 3 Austenite Cooling Transformation vertical and horizontal axes are, respectively, temperature and the logarithm of Cementite (Fe C) 1000 3 700 (unstable) Diagrams, American Two solid curves are plotted; one represents the time required at each temper 400 initiation for Metals,21977, 3 0 1 4 1200 the Society or start of the transformation; C) other is for the transform for (Fe) Composition (wt% the 5 6 6.70 Pearlite conclusion. The dashed curve 9.24 The iron–iron carbide phase transformation compl Figure corresponds to 50% of diagram. [Adapted from Binary Temperature (°C) Temperature (°F) p. 369.] These curves were generated from a series of T. B. Massalski (Editor-in-Chief), 1990. Repr Diagrams, 2nd edition, Vol. 1, plots of the percentage transfo 600 permission of ASM International, Materials Park, OH.] tion versus the logarithm of time taken over a range of temperatures. The S-sh 50% Completion curve curve [for 675ЊC (1247ЊF)], in the upper portion of Figure 10.13, illustrates ho 1000 data transfer is made. In interpreting this diagram, note first that the eutectoid temperature [ 500 Completion curve (~100% pearlite) (1341ЊF)] is indicated by a horizontal line; at temperatures above the eutecto Begin curve 800 100 0 Figure 10.12 For (~ 0% pearlite) iron–carbon alloy 400 eutectoid composi (0.76 wt% C), isothermal fractio cent austenite 102 103 104 105 rcent pearlite 1 10 reacted versus the Time (s) 50 600°C 650°C 675°C 50 logarithm of time the austenite-to-p
  • 57. 2nd REVISE PAGES system has been chosen because it is familiar and because a wide variety crostructures and mechanical properties are possible for iron–carbon (or steel) Diagrama TTT Fe-C (perlita) 10.5 ISOTHERMAL TRANSFORMATION DIAGRAMS Pearlite Consider again the iron–iron carbide eutectoid reaction Eutectoid reaction 10.5 Isothermal Transformation Diagrams a10.022327C2 ϩ Fe3C16.70 wt% C2 for the iron-iron g10.76 wt% C2 ∆ • wt% cooling (1 carbide system heating 1s 1 min which is fundamental to the development of microstructure in steel alloys. 1h 1 day cooling, austenite, having an intermediate carbon concentration, transforms to rite phase, having a much lower carbon content, and also cementite, with a Eutectoid 1400 A ␥ Austenite (stable) higher carbon concentration. Pearlite is one microstructural product of this temperature 727°C formation (Figure 9.27), and the mechanism of pearlite formation was disc previously (Section 9.19) and demonstrated in Figure 9.28. Temperature plays an important role in the rate of the austenite-to-pe 700 ␥ ␥ ␥ ␥ transformation. The temperature dependence for an iron–carbon alloy of eute composition is indicated in Figure 10.12, which plots S-shaped curves of the ␥ ␥ ␣ Ferrite transformation versus the logarithm of time at three different tempera centage Coarse pearlite For each curve, data were collected after rapidly cooling a specimen compos 100% austenite to the temperature indicated; that temperature was maintained 1200 C stant throughout the course of the reaction. Temperature (°C) Temperature (°F) A more convenient way of representing both the time and temperatur B D pendence of this transformation is in the bottom portion of Figure 10.13. Her 600 Fe3C vertical and horizontal axes are, respectively, temperature and the logarithm of Two solid curves are plotted; one represents the time required at each temper for the initiation or start of the transformation; the other is for the transform Fine pearlite conclusion. The dashed curve corresponds to 50% of transformation compl These curves were generated from a series of plots of the percentage transfo tion versus the logarithm of time taken over a range of temperatures. The S-sh 1000 curve [for 675ЊC (1247ЊF)], in the upper portion of Figure 10.13, illustrates ho data transfer is made. Austenite → pearlite 500 transformation Denotes thatinterpreting this diagram, note first that the eutectoid temperature [ In a transformation (1341ЊF)] is indicated by a horizontal line; at temperatures above the eutecto is occurring 100 0 Figure 10.12 For iron–carbon alloy 800 eutectoid composi (0.76 wt% C), 1 10 102 103 104 105 isothermal fractio cent austenite rcent pearlite reacted versus the Time (s) 50 600°C 650°C 675°C 50 logarithm of time the austenite-to-p
  • 58. REAÇÃO EUTETÓIDE - Perlita 8 • Chapter 10 / Phase Transformations in Metals Sistema Fe-C Figure 10.15 otomicrographs of (a) coarse pearlite d (b) fine pearlite. 00ϫ. (From K. M. Ralls et al., An Introduction to terials Science and Engineering, p. 361. pyright © 1976 by ohn Wiley & Sons, w York. Reprinted by permission of ohn Wiley & Sons, Inc.) Perlita Grosseira Perlita Fina For iron–carbon alloys of other compositions, a proeutectoid phase (either ferrite or cementite) will coexist with pearlite, as discussed in Section 9.19. Thus additional curves corresponding to a proeutectoid transformation also must be in-