Cybersecurity Awareness Training Presentation v2024.03
Maurice House
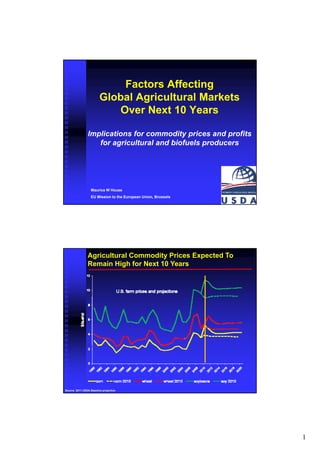
1. Factors Affecting
Global Agricultural Markets
Over Next 10 Years
Implications for commodity prices and profits
for agricultural and biofuels producers
Maurice W House
EU Mission to the European Union, Brussels 1
Agricultural Commodity Prices Expected To
Remain High for Next 10 Years
Source: 2011 USDA Baseline projection
1
2. 8 Factors That Will Impact Global Agricultural
Markets and Prices Over the Next Decade
Strong demand growth, especially from emerging markets, will be the central
megatrend over the next decade, boosting global prices and profitability
Global economic growth
Value of the U.S. dollar
Worldwide biofuels production
Role of trade and trade liberalization
Policy errors by g
y y governments
Energy prices
Biotech developments
Additional crop land
3
#1: The Global Economy Returning to Growth
Global economy emerging from worst recession in
decades. Developing countries doing better than
developed countries. This should continue.
Global recessions usually reduce commodity prices –
Not this time because of strength in emerging markets.
Consumer incomes are rising and middle class
households are expanding rapidly, especially in large
emerging markets like China, India, Russia and Brazil.
g g
Impact on global food demand is significant due to
higher income elasticities for food in emerging markets.
What could go wrong? Much depends on China.
4
2
3. “Middle Class” Outside the U.S. Expected to Double
By 2020 – To 1 Billion Households
Worldwide food consumption will be impacted
Foreign households w/real PPP incomes greater than $20,000 a year
(in millions of households)
Middle class in developing countries
projected to increase 104% by 2020 vs. just
9% in developed countries in 2009
Developing
countries
ti
Developed
countries (ex US)
5
Source: Global Insight’s Global Consumer Markets data as analyzed by OGA
“Middle Class” in Developing Countries Could Reach 730 Million
Households By 2020, Up 104% From 2009 Levels
20% of households in these countries are middle class. By 2020, this could
increase to 36% and the impact on food consumption will be large
Developing countries with fastest growing “middle class”
Source: Global Insight’s Global Consumer Markets data as analyzed by OGA 6
3
4. #2: Value of the Dollar Expected to Ease Further …
Putting Upward Pressure on Commodity Prices
Including prices of biofuels feedstocks, like palm oil and sugar
Prices of traded commodities are denominated in dollars.
Commodities are inversely related to the value of the dollar
– as the dollar falls, commodity prices tend to rise.
WHY? Falling dollar boosts purchasing power of foreign
buyers of dollar-denominated commodities, thereby
increasing demand and putting upward pressure on prices.
U.S. dollar has been trending down since 2002.
Most economists expect U.S. dollar to ease over the longer
term, particularly relative to emerging market currencies.
If true, this will put continued upward pressure on a wide
range of commodity prices as the dollar declines.
7
U.S. Dollar Projected Fall Another 14% by 2020
(Weighted against the currencies of major U.S. agricultural export markets
8
Source: USDA, Economic Research Service; Foreign Agricultural Service
4
5. #3: Biofuels Production Continues to Grow,
Boosting Feedstock Demand
Expansion of global biofuels production is boosting demand for
feedstocks, such as grains, vegetable oils, and sugar.
RFS-2 in the U.S.– rate of growth in corn-based ethanol mandate
slowing.
Renewable Energy Directive (RED) in the European Union. Will
boost demand for sugar and vegetable oils (like palm oil).
Continued growth in the number of countries adopting biofuels
mandates, particularly in Western Hemisphere
Don’t forget added revenues from by-products from biofuels
production. Lowers net costs of feedstock to refineries
What would be the impact of a “disruptive technology”
breakthrough in “new generation” biofuels (cellulosic, algae, etc)
9
#4: Trade Will Increase and Trade
Liberalization Will Continue
Global agricultural trade has grown sharply over the past decade
to an estimated $700 billion in 2011, up 150% since 2000 -- could
exceed $1 trillion by 2020.
Most countries ag imports have increased substantially but China
and East/Southeast Asia. U.S. and EU imports growing, too.
Almost all major agricultural exporters have seen sharp gains in
recent years.
Growth in global demand and trade is fuelling production gains
worldwide, as land harvested and yields increase.
FTAs have proliferated worldwide, boosting trade. This will
continue -- with or without the U.S.
10
5
6. U.S. Is Not Only Major Exporter Seeing Gains
Broad gains but South America and Southeast Asia increased the most
After relinquishing top spot to EU in 2005 and 2006, the U.S. has regained the No. 1 position
65.5
65 5
United St t
U it d States 115.8
67.3
EU-27 105.3
31.0
Brazil 62.6
19.1
China 34.6
21.6
Canada 34.5
18.1 CY 2005
Argentina 33.0
10.8
CY 2010
Indonesia 30.0
19.4
Australia 25.7
12.7
Thailand 27.3
0 10 20 30 40 50 60 70 80 90 100 110 120
Total Agricultural Exports (bil $)
11
Source: GTIS using Global Trade Atlas. Definition of ag differs somewhat from Bureau of Census so U.S. stats not same as reported by FAS in BICO reports
#5: Policy Errors Increase Price
Volatility and Distort Markets
What is a “policy error”?
Shrinking supplies and food security/inflation concerns have led
some countries to restrict exports.
Export bans distort markets and increase world prices. In the short
run, increases domestic availabilities and reduces local food
inflation. However, it also lowers local producer prices and profits
and negatively affects long-term domestic production.
This happened during food price crisis of 2008. It happened again in
2010/11. Will countries continue their use?
Use of these practices discourage foreign investors since their
profits will be affected by unpredictable government policy.
12
6
7. #6: Higher Energy Prices Are Likely,
Increasing Agricultural Production Costs
However, higher energy prices increase biofuels prices through
substitution effects, which partially offsets higher feedstock costs
Agriculture is an energy intensive industry – planting harvesting,
energy-intensive planting, harvesting
transportation and processing.
As energy prices increase, agricultural production costs increase.
This reduces farmer profits and output, and leads to higher long run
agricultural and food prices.
However, higher energy prices (particularly gasoline and diesel
prices) lead to higher biofuels prices through substitution effect.
This helps offset higher costs of biofuels feedstocks to biorefineries.
Net impacts on biofuels producers’ profitability? It depends since
feedstock costs are 75-85% of biofuels cost of production. 13
Higher Energy Prices Contribute to Higher
Food and Agricultural Commodity Prices
Increasing costs all along the supply chain plus increases demand for biofuels
which increases feedstock demand (grains, sugar, and oilseeds)
Source: International Monetary Fund: International Financial Statistics
7
8. #7: Role of Biotechnology Will Grow
U.S. position is biotech is not the problem – it is part of the solution
Those producers who use biotechnology have higher
yields and/or reduced input use than those who do not
not.
Producers’ pursuit of higher yields to capture higher
prices and incomes will lead to greater usage of
biotechnology. Will lead to new cycle of innovation.
Acceptance of this technology is not universal but
growing.
growing EU has been a major opponent and this has
affect others through trade linkages.
Sound science should be the only criteria used to review
the safety of biotechnology or any new technology.
15
Technology Is Key to Meeting Future Demand
Use of biotechnology and innovation is key to boosting yields and production
Source: USDA PS&D Database
8
9. #8: Planted Acreage Will Increase
How aggressively will producers around the world react to strong
commodity prices, especially in South America?
Most of the increased production will come from higher yields but
strong prices will encourage at l
t i ill t least some i
t increase i planted
in l t d
acreage.
Where will the gains occur? Transportation/storage infrastructure
and marketing costs to global markets will play a big role.
South America will likely lead in land expansion (largely Brazil) as
will the Former Soviet Union. Africa has more uncultivated land
that could be used but high marketing costs, p
g g poor infrastructure,
and long distances from markets will be a constraint.
Land tenure issues, laws governing foreign investment, and the
degree of price transmission will also play a big role.
17
Global Production Gains Since 1990 Due Largely to Yield Growth
Oilseeds (largely soybeans) are a notable exception – most of the production
gains are due to area expansion, primarily in South America
Area 118%
110%
Yield
Production
90%
70% 66%
% Change
50%
35%
28% 31% 34% 31%
30% 27% 25%
8%
10%
-1% -2%
-10%
Grains Oilseeds* Cotton Total
*Includes soybean, sunflow er, rape, and peanut
18
9
10. Potential Availability of Uncultivated Land
51 million ha
123 million ha 15 million ha
Share of Land With Travel
Time to Market < 6 Hours 3 million ha
Latin America & Car. 76% 201 million ha
Sub-Saharan Africa 47%
M. East & N. Africa 97%
E. Europe & C. Asia 86%
East & South Asia 22% 19
Data Source: World Bank
10