1. 42
wind energy b arometer
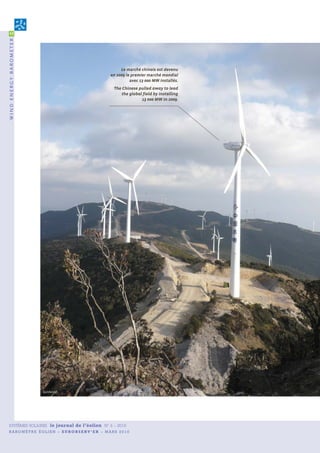
Le marché chinois est devenu
en 2009 le premier marché mondial
avec 13 000 MW installés.
The Chinese pulled away to lead
the global field by installing
13 000 MW in 2009.
Goldwind
SYSTÈMES SOLAIRES le journal de l’éolien N° 6 – 2010
BAROMÈTRE ÉOLIEN – E U RO B S E RV ’ E R – MARS 2010
2. + 13,3 %
43
b aromètre éolien
la croissance du marché éolien
de l’UE entre 2008 et 2009
EU wind turbine market growth
between 2008 and 2009
BAROMÈTRE ÉOLIEN
WIND POWER
BAROMETER
Une étude réalisée par EurObserv’ER. A study carried out by EurObserv’ER.
e marché mondial de l’éolien a fait mieux he global wind power market not only
Lque résister aux effets de la crise financière Trepelled the strictures of the financial cri-
avec, selon les premières estimations, l’instal- sis, but according to initial estimates, saw the
lation de 37 GW, soit près de 10 GW de puis- installation of 37 GW, which is almost 10 GW
sance supplémentaire par rapport à l’année up on 2008. China and the United States regis-
2008. La croissance a été particulièrement sou- tered particularly steady growth and the Euro-
tenue en Chine et aux États-Unis. L’Union euro- pean Union also picked up momentum to
péenne a également tiré son épingle du jeu en break its installation record.
établissant un nouveau record d’installations.
158 GW éoliens 74,8 GW éoliens
installés dans le monde fin 2009 installés dans l’UE fin 2009
of wind power installed across the world of wind power installed in EU at the end of 2009
SYSTÈMES SOLAIRES le journal de l’éolien N° 6 – 2010
BAROMÈTRE ÉOLIEN – E U RO B S E RV ’ E R – MARS 2010
3. 44
wind energy b arometer
Tabl. n° 1
Puissance éolienne installée dans le monde fin 2009* (en MW)
Wind power capacity installed worldwide at the end of 2009* (in MW)
Puissance installée en 2009 Mises hors service en 2009
2008 2009
Capacity installed in 2009 Decommissioned in 2009
European Union 65 172,3 74 800,2 9 739,1 111,2
Rest of Europe 1 022,0 1 385,0 363,0 0,0
Total Europe 66 194,3 76 185,2 10 102,1 111,2
United States 25 237,0 35 159,0 9 922,0 0,0
Canada 2 369,0 3 319,0 950,0 0,0
Total North America 27 606,0 38 478,0 10 872,0 0,0
China 12 104,0 25 104,0 13 000,0 0,0
India 9 655,0 10 926,0 1 271,0 0,0
Japan 1 880,0 2 056,0 178,0 2,0
Other Asian countries 633,0 823,0 190,0 0,0
Total Asia 24 272,0 38 909,0 14 639,0 2,0
Rest of the world 2 931,0 4360,0 1 429,0 0,0
Total world 121 003,3 157 932,2 37 042,1 113,2
*Estimation. Estimate. Les décimales sont séparées par une virgule. Decimals are written with a comma.
Sources: EurObserv’ER 2010 (European Union figures), AWEA 2010 for United States, GWEC 2010 (others)
Deuxième marché mondial
en 2009, les États-Unis
ont installé près de 10 000 MW.
The United States was
the number two global wind
power market in 2009,
installing almost
10 000 MW of capacity.
REI
L’
énergie éolienne a connu une crois- nouveaux mégawatts, soit une puissance du Nord (24,4 %) (graphique 2bis). Les autres
sance remarquable durant l’année cumulée de 38 478 MW fin 2009. Il devance régions du monde restent sous-représen-
2009. Les premières estimations dis- de peu le marché européen où 10 102,1 MW tées avec une part de 2,8 %.
ponibles établissent la puissance éolienne ont été installés, pour un parc cumulé de
mondiale à près de 158 GW, ce qui signifie 76 185,2 MW.
une puissance supplémentaire de l’ordre de Signe de l’internationalisation de la filière, 158 gw éoliens installés
37 GW en 2009 (tableau 1 et graphique 1). l’Europe ne représente plus en 2009 que dans le monde
Le marché asiatique est devenu en 2009 le 27,3 % du marché mondial de l’éolien, de-
premier marché au monde avec, selon l’as- vancée cette année à la fois par le marché installation record en chine
sociation GWEC (Global Wind Energy Coun- asiatique (39,5 %) et le marché américain
cil), 14 639 MW installés, portant la puis- (29,4 %) (graphique 2). L’Europe possède Les premières estimations du marché chinois,
sance éolienne de la région à 38 909 MW. La néanmoins encore près de la moitié (48,2 % rapportées par le GWEC, ont fait sensation.
croissance du marché nord-américain a en 2009) de la puissance éolienne mondiale
également été spectaculaire avec 10 872 installée, devant l’Asie (24,6 %) et l’Amérique
SYSTÈMES SOLAIRES le journal de l’éolien N° 6 – 2010
BAROMÈTRE ÉOLIEN – E U RO B S E RV ’ E R – MARS 2010
4. 45
b aromètre éolien
W
ind power’s expansion was outstanding in 2009. First other markets with 13 000 MW installed in 2009, more than dou-
available estimates put global wind power capacity at bling its 2008 installed capacity (by 109.9%) and bringing the
almost 158 GW, which means that around 37 GW of addi- nation’s capacity to 25 104 MW. China is thus the number three
tional capacity was installed in 2009 (table 1 and graph 1). wind power force, behind the United States and only a few hun-
The Asian market led the world in 2009 with, according to the GWEC dred megawatts behind Germany, relegating Spain into fourth
(Global Wind Energy Council), 14 639 MW installed, which raised place. According to the Secretary-General of the Chinese Renew-
the region’s wind power capacity to 38 909 MW. Growth in the able Energy Industries Association, the Chinese government is
North American market was also spectacular with the addition taking a firm, responsible stand on curbing the CO2 emissions
of 10 872 MW, bringing cumulated capacity by the end of 2009 to arising from the country’s economic expansion, for last year, it
38 478 MW… just ahead of the European market where 10 102.1 MW raised its 2020 goals from 30 000 to 50 000 MW. Given current
were installed, bringing the installed base to 76 185.2 MW. growth, the Chinese association is convinced that the turbine
Wind power has now gone global, as in 2009 Europe only base will triple by that dateline, in other words 150 000 MW
accounted for 27.3% of the global wind power market, having been installed by 2020.
outstripped by both the Asian (39.5%) and American (29.4%) mar-
kets over the course of the year (graph 2). Nonetheless Europe has obama relaunches the us market
almost half (48.2% in 2009) of the global installed wind power
capacity, ahead of Asia (24.6%) and North America (24.4%) (graph The United States was the number two global wind power mar-
2A). The world’s other regions are under-represented with just a ket in 2009, installing almost 10 000 MW of capacity (9 922 MW to
2.8% share. be precise), according to the AWEA (American Wind Energy Asso-
ciation) as against 8 425 MW in 2008 (>17.8% growth), which brings
the US wind turbine base to 35 159 MW. Over a quarter of this
158 gw of wind turbines installed capacity (9 410 MW) is installed in Texas and the AWEA claims
across the world that it is sufficient to supply 9.7 million American households
and save 62 million tonnes in CO2 emissions.
record installation in china The 2009 market easily outstripped the American wind power
industry’s early 2009 forecasts as it had forecast a 50% contrac-
First estimates of the Chinese market, reported by the GWEC,
created a sensation. The Chinese market pulled away from the
Graph. n° 1
Puissance éolienne cumulée dans le monde depuis 1993 (en MW)
Total wind power installed in the world since 1993 (in MW)
157 932
121 003
93 908
74 390
59 467
47 489
39 363
31 412
24 544
17 684
13 450
7 584 9 842
4 800 6 115
2 900 3 450
1993 1994 1995 1996 1997 1998 1999 2000 2001 2002 2003 2004 2005 2006 2007 2008 2009
* Estimation. Estimate. Source: EurObserv’ER 2010.
SYSTÈMES SOLAIRES le journal de l’éolien N° 6 – 2010
BAROMÈTRE ÉOLIEN – E U RO B S E RV ’ E R – MARS 2010
5. 46
wind energy b arometer
Graph. n° 2 général de l’Association chinoise des éner-
Répartition mondiale du marché éolien en 2009 gies renouvelables (Chinese Renewable
Worldwide breakdown of the 2009 wind market Energy Industries Association), le gouverne-
ment chinois prend sérieusement ses res-
3,9 % ponsabilités pour limiter les émissions de
Rest of the world CO2 dues à la croissance économique du
39,5 % pays. L’an dernier, ce dernier a réévalué ses
Asia objectifs pour 2020 de 30 000 à 50 000 MW.
Compte tenu de la croissance actuelle, l’as-
sociation chinoise estime que le parc sera
très certainement trois fois plus important
à cette échéance, soit 150 000 MW d’ici à
2020.
27,3 %
Europe obama relance le marché
étatsunien
Deuxième marché mondial en 2009, les
États-Unis ont installé, selon l’association
AWEA (American Wind Energy Association),
29,4 % près de 10 000 MW (9 922 MW exactement)
contre 8 425 MW en 2008 (+ 17,8 % de crois-
North America
sance). Cette puissance porte le parc éolien
des États-Unis à 35 159 MW. Plus du quart
Les décimales sont séparées par une virgule. Decimals are written with a comma. Source: EurObserv’ER 2010. de cette puissance (9 410 MW) est installé
au Texas. Selon l’AWEA, cette puissance est
suffisante pour alimenter 9,7 millions de
Graph. n° 2bis ménages américains et économiser 62 mil-
Répartition de la puissance éolienne mondiale fin 2009 lions de tonnes de CO2.
Breakdown of worldwide wind power at the end of 2009 Le marché 2009 dépasse largement les pré-
visions de l’industrie éolienne américaine
faites en début d’année, qui prévoyaient une
2,8 % baisse de 50 % par rapport au marché 2008.
Rest of the world La tendance s’est inversée durant l’été avec
24,6 %
l’engagement clair du président Obama de
Asia
créer des emplois dans les énergies propres,
conforté ensuite par la mise en place durant
l’été de la loi sur la reprise économique et le
réinvestissement (American Recovery and
Reinvestment Act, ARRA) qui a octroyé des
subventions aux investisseurs. Cette loi a
permis un rétablissement spectaculaire du
48,2 % marché américain avec plus de 4 GW instal-
Europe lés durant le dernier trimestre.
Hors Union européenne, les marchés les
plus importants sont situés en Inde (1 271
24,4 % MW installés en 2009), au Canada (950 MW),
North America en Australie (406 MW) et au Brésil (264 MW).
Les décimales sont séparées par une virgule. Decimals are written with a comma. Source: EurObserv’ER 2010. l’union européenne ajoute
près de 10 gw à son parc
Le marché chinois est devenu, et de loin, le devient ainsi le troisième pays de l’éolien, Le marché de l’Union a plutôt bien résisté à
premier marché mondial avec 13 000 MW derrière les États-Unis. Elle est toutefois la crise financière. Selon EurObserv’ER, il
installés. Il a donc plus que doublé par rap- devancée de quelques centaines de méga- augmente de 13,3 % en 2009 pour atteindre
port à 2008 (+ 109,9 %) portant la puissance watts par l’Allemagne, l’Espagne passant en
installée dans le pays à 25 104 MW. La Chine quatrième position. Selon le secrétaire
SYSTÈMES SOLAIRES le journal de l’éolien N° 6 – 2010
BAROMÈTRE ÉOLIEN – E U RO B S E RV ’ E R – MARS 2010
6. 47
b aromètre éolien
Tabl. n° 2
Puissance éolienne installée dans l’Union européenne fin 2009* (en MW)
Wind power installed capacities in European Union at the end of 2009* (in MW)
Puissance installée en 2009 Mise hors servive en 2009
2 008 2 009
Capacity installed in 2009 Decommissioned in 2009
Germany 23 896,9 25 777,0 1 916,8 36,7
Spain 16 689,4 19 148,8 2 459,4 0,0
Italy 3 736,5 4 850,0 1 113,5 0,0
France** 3 542,0 4 521,0 979,0 0,0
United Kingdom*** 3 406,2 4 050,9 645,2 0,5
Portugal 2 862,0 3 535,0 673,0 0,0
Denmark 3 162,8 3 480,6 350,7 32,8
Netherlands 2 216,0 2 220,7 39,1 34,4
Sweden 1 048,0 1 560,0 512,0 0,0
Ireland 1 027,0 1 260,0 233,0 0,0
Greece 985,0 1 087,0 102,0 0,0
Austria 994,9 994,9 0,0 0,0
Poland 451,1 705,3 259,4 5,2
Belgium 392,5 563,0 171,1 0,6
Hungary 127,0 201,0 74,0 0,0
Czech Republic 150,0 193,3 43,3 0,0
Bulgaria 120,0 177,0 57,0 0,0
Estonia 85,2 149,2 64,0 0,0
Finland 143,0 146,0 4,0 1,0
Lithuania 54,0 91,0 37,0 0,0
Luxembourg 43,3 43,3 0,0 0,0
Latvia 27,0 28,0 1,0 0,0
Romania 9,5 14,0 4,5 0,0
Slovakia 3,1 3,1 0,0 0,0
Slovenia 0,0 0,0 0,0 0,0
Cyprus 0,0 0,0 0,0 0,0
Malta 0,0 0,0 0,0 0,0
Total EU 27 65 172,3 74 800,2 9 739,1 111,2
* Estimation. Estimate. ** DOM COM inclus. French overseas departements and collectivities included. *** Concernant le Royaume-Uni, l’estimation du
parc fin 2008 est celle du ministère de l’Énergie et du Changement climatique, tandis que l’estimation du parc 2009 est celle du BWEA. The end of 2008
estimate for the United Kingdom wind turbine base was provided by the Ministry of Energy and Climate Change, whereas the estimate for the 2009 wind
turbine base came from the BWEA.
Les décimales sont séparées par une virgule. Decimals are written with a comma. Source: EurObserv’ER 2010.
tion on the 2008 market. The trend reversed during the summer the eu adds almost 10 gw to its base
when President Obama made a clear commitment to create jobs
in clean energies, further abetted by the implementation of the The European Union market was particularly resilient coping with
American Recovery and Reinvestment Act, ARRA, during the the financial crisis. According to EurObserv’ER, it grew by 13.3%
summer, which awarded grants to investors. The law triggered in 2009 with 9 739.1 MW (8 594.5 MW in 2008), which is a new record
the American market’s spectacular recovery with over 4 GW for annual installations (table 2). If we subtract the installations
installed in the last quarter. taken out of service, the European Union base rose to 74 800.2 MW
by the end of 2009. Spain and Germany confirmed their leadership
The biggest markets outside the European Union are India (1 271 of the wind power market in 2009. Most of the other mature mar-
MW installed in 2009), Canada (950 MW), Australia (406 MW) and
Brazil (264 MW).
SYSTÈMES SOLAIRES le journal de l’éolien N° 6 – 2010
BAROMÈTRE ÉOLIEN – E U RO B S E RV ’ E R – MARS 2010
7. 48
wind energy b arometer
Graph. n° 3
Puissance éolienne pour 1 000 habitants dans les pays de l’Union européenne en 2009 (kW/1 000 hab.)*
Wind capacity for 1,000 inhabitants in the European Countries in 2009 (kW/1 000 unhab.)*
627,5
Denmark
415,5
Spain
332,3
Portugal
315,3
Germany
283,1
Ireland
166,9
Sweden
134,0
Netherlands
118,8
Austria
111,3
Estonia
96,1
Greece
86,2
Luxembourg
80,3
Italy
69,9
France
65,3
United Kingdom
52,0
Belgium
27,3
Lithuania
27,3
Finland
23,4
Bulgaria
20,1
Hungary
18,5
Poland
18,4
Czech Rep.
12,5
Latvia
0,7
Romania
0,6
Slovakia
149,2
Total EU 27
* Estimation. Estimate. Les décimales sont séparées par une virgule. Decimals are written with a comma. Source: EurObserv’ER 2010.
9 739,1 MW (8 594,5 MW en 2008), soit un nou- sont restés très performants, avec un bémol l’Autriche, des Pays-Bas, de la Finlande et de
veau record d’installations (tableau 2). concernant la France et le Royaume-Uni. 2009 six autres pays de l’Union européenne.
Déduit des installations mises hors service, est également l’année de la renaissance du Si l’on tient compte de la puissance installée
le parc de l’Union européenne atteint donc marché danois grâce à l’offshore. Une autre par habitant, les cinq premiers pays impli-
74 800,2 MW fin 2009. L’Espagne et l’Alle- bonne nouvelle est la montée en puissance qués dans la filière éolienne sont le Dane-
magne ont confirmé en 2009 leur statut de de certains marchés d’Europe centrale mark, l’Espagne, le Portugal, l’Allemagne et
place forte du marché éolien. La plupart des comme la Pologne, la Hongrie, l’Estonie et la l’Irlande (graphique 3).
autres marchés matures comme l’Italie, le Bulgarie. D’autres marchés sont au point
Portugal, la Suède, l’Irlande et la Belgique mort ou presque. C’est notamment le cas de
SYSTÈMES SOLAIRES le journal de l’éolien N° 6 – 2010
BAROMÈTRE ÉOLIEN – E U RO B S E RV ’ E R – MARS 2010
8. 51
b aromètre éolien
Tabl. n° 3 low wind conditions limited production
Puissance éolienne offshore* installée dans l’Union over the year
européenne fin 2009 (en MW)**
Installed offshore* wind power capacities in the European The increase in electricity production was not proportional to the
Union at the end of 2009 (in MW)** increase in production capacities. First estimates put wind power
electricity generation at 128.5 TWh, equivalent to 8.6% growth over
2008 2009 2008 (table 4). The low prevailing wind conditions in Germany (see
further on), which in 2009 still accounted for over a third of Euro-
United Kingdom 586,0 688,2
pean Union installed capacity, are partly responsible for this lack-
Denmark 423,4 663,9 lustre increase. Another, albeit lesser factor, was the unhooking
Netherlands 246,8 246,8 of wind power energy due to temporary grid overload. The increase
Sweden 133,7 163,7 in the wind power share of the electricity mix of individual coun-
tries depends on the strengthening of a number of lines and invest-
Belgium 30,0 30,0
ments in new grid infrastructures. These investments – onshore
Ireland 25,2 25,2 or at sea – will shape the wind power sector’s growth potential for
Finland 24,0 24,0 years to come.
Germany 12,0 72,0
news from the main european markets
Italy 0,1 0,1
Total EU 27 1 481,1 1 913,8 Spain seeks to limit its market’s growth
* Inclues éoliennes situées à proximité des côtes et éoliennes tests. Included In 2009 Spain recaptured its top European wind power market slot
near-shore projects and offshore test of wind turbines. ** Estimation. by installing 2 459.4 MW to bring total capacity up to 19 148.8 MW,
Estimate. Les décimales sont séparées par une virgule. Decimals are written
with a comma. Source: EurObserv’ER 2010. according to the AEE (Spanish Wind Energy Association), which is
850.3 MW more than in 2008 (up 52.8%) when 1 609.1 MW was
installed. However the Spanish association is steeling itself for a
kets such as Italy, Portugal, Sweden, Ireland and Belgium were sharp slowdown in wind power activity in 2010 as Royal Decree
very buoyant; however France and the United Kingdom were 6/2009 creates a Registry of preliminary assignment. Under the
somewhat flat. Offshore wind power led to a Danish market terms of this new procedure, the central government must give
revival in 2009, while another good piece of news is the rising prior approval to wind power projects if they are to benefit from
capacity in a number of Central European markets such as Poland, the production aid system and thus removes the regional govern-
Hungary, Estonia and Bulgaria. Other markets, in particular Aus- ments’ prerogative to award operating licences. The government’s
tria, the Netherlands, Finland and six other EU member states are aim is to cope with the influx of new projects arising from the
more or less idling. forthcoming revision of the incentive system (which will run until
If the per capita installed capacity is the benchmark, Denmark, 2012) as stipulated in table 5 as there are already about 14 GW of
Spain, Portugal, Germany and Ireland are the top five countries projects in the pipeline. Its intention is to cap development of the
involved in wind power (graph 3). Spanish wind turbine base to a further 6 GW by 2012.
the 2-gw offshore threshold will soon German growth is back
be crossed The financial crisis has only been able to slow down the German
market’s return to growth. The DEWI (German Wind Energy Insti-
European Union offshore and nearshore wind power capacity is tute) claims that Germany installed 1 916.8 MW of capacity in 2009
nearing the 2-GW threshold with 1 913.8 MW installed in 2009, as against 1 667.1 MW in 2008 and 1 666.8 MW in 2007, equivalent
amounting to 432.7 MW more than in 2008 (table 3). Six new offshore to 15%. The repowering market, namely the replacement of first-
wind farms turbines were connected in generation wind turbines rose to 136.2 MW.
2 459 MW
2009 – Alpha Ventus off Germany (60 MW), Growth would have been even higher if it
Gasslingegrund off Sweden (30 MW), had not been for military radar issues.
Horns Rev 2 (see picture p.53) (209.3 MW), Almost 1 500 MW of projects (2 billion euros
Sprogo (21 MW), Hvidrove (7.2 MW) off Den- of investments) are currently held up wait-
the capacity installed in Spain
mark and Rhyl Flats (90 MW) off the United- during the year 2009 ing for military authorisations.
Kingdom. All the wind turbines of the Lynn la puissance installée en Espagne The German offshore market kicked off
and Inner Dowsing farms have been on durant l’année 2009 properly last year with the connection of
stream since March 2009, bringing the final the 60-MW Alpha Ventus farm (see picture
capacity of these two farms to 194.4 MW (97.2 MW each). p.56). The farm, with its six Repower 5 M and six Multibrid M5000
EurObserv’ER has not taken into account the capacity of two (5 MW) turbines was commissioned 45 km off the coast by a con-
other farms currently being installed off the United-Kingdom – sortium comprising RWE, E.ON and Vattenfall, and should be fol-
Gunfleet Sands and Robin Rigg (see further on) on the basis of lowed by many other projects, as the government gave the green
the questionnaire sent by the BWEA (British Wind Energy Asso-
ciation).
SYSTÈMES SOLAIRES le journal de l’éolien N° 6 – 2010
BAROMÈTRE ÉOLIEN – E U RO B S E RV ’ E R – MARS 2010
9. 52
wind energy b arometer
Tabl. n° 4 les premières estimations, la production
Production d’électricité d’origine éolienne dans les pays de l’Union européenne d’électricité éolienne devrait atteindre 128,5
en 2008 et 2009 (en TWh)* TWh, soit une croissance de 8,6 % par rap-
Electricity production from wind power in European Union in 2008 and 2009 port à 2008 (tableau 4). Cette faible aug-
(in TWh)* mentation s’explique en partie par une
année faiblement ventée en Allemagne (voir
2008 2009 plus loin), qui représentait encore en 2009
Germany 40,600 37,500 plus du tiers de la puissance installée de
l’Union. Autre facteur, plus limité cette fois,
Spain 32,200 36,188
le décrochage de l’énergie éolienne, dû à des
United Kingdom 7,097 9,259 situations de surcharge temporaire du
Denmark 6,976 6,716 réseau. Le renforcement de certaines lignes
Portugal 5,695 6,639 et les investissements dans de nouvelles
infrastructures réseaux sont des éléments
France 5,689 7,800
indispensables à l’augmentation de la part
Italy 5,055 6,087 de l’éolien dans le mix électrique de chaque
Netherlands 4,256 4,800 pays. Ces investissements conditionneront
Ireland 2,473 2,955 les capacités de croissance de la filière dans
les prochaines années, que ce soit sur le mar-
Austria 2,000 2,100
ché éolien terrestre ou maritime.
Sweden 1,996 2,519
Greece 1,700 2,107 actualités des principaux
Poland 0,790 1,250 marchés européens
Belgium 0,622 0,834
L’Espagne veut limiter la croissance
Finland 0,262 0,275 de son marché
Czech Republic 0,244 0,300 L’Espagne est redevenue en 2009 le premier
Hungary 0,204 0,352 marché éolien européen avec, selon l’AEE
(Association espagnole de l’énergie éo-
Bulgaria 0,122 0,361
lienne), 2 459,4 MW installés pour un parc
Estonia 0,133 0,172 cumulé de 19 148,8 MW. C’est 850,3 MW de
Lithuania 0,123 0,145 plus qu’en 2008 (+ 52,8 %) où 1 609,1 MW
Luxembourg 0,061 0,065 avaient été installés. Toutefois, l’association
espagnole s’attend à un fort ralentissement
Latvia 0,055 0,056
de l’activité éolienne en 2010. Cette situa-
Romania 0,011 0,017 tion est due, selon elle, à la création d’un
Slovakia 0,008 0,008 Registre des pré-affectations mis en place
Total EU 27 118,373 128,504 par le décret royal 6/2009. Dans cette nou-
velle procédure, le gouvernement central
* Estimation. Estimate. Les décimales sont séparées par une virgule. Decimals are written with a
comma. Source: EurObserv’ER 2010. doit préalablement donner son aval au pro-
jet éolien pour qu’il puisse bénéficier du sys-
tème d’aide à la production. Il retire ainsi
le seuil des 2 gw offshore ment opérationnelles depuis mars 2009 por- aux gouvernements régionaux la préroga-
bientôt franchi tant la puissance finale de ces deux parcs à tive d’accorder des licences d’exploitation.
194,4 MW (97,2 MW chacun). L’objectif du gouvernement est de faire face
La puissance éolienne offshore et “near- Se basant sur le questionnaire envoyé par à l’afflux de nouveaux projets liés à la révi-
shore” (proche des côtes) de l’Union euro- le BWEA (British Wind Energy Association), sion prochaine du système d’incitation
péenne s’approche du seuil des 2 GW avec EurObserv’ER n’a pas pris en compte la puis- (valable jusqu’en 2012) décrit dans le ta-
1 913,8 MW installés en 2009, soit 432,7 MW sance de deux autres parcs en cours d’ins- bleau 5, le nombre de projets en attente
de plus qu’en 2008 (tableau 3). L’année 2009 tallation au Royaume-Uni, celui de Gunfleet étant déjà de l’ordre de 14 GW. Son intention
aura vu la connexion de six nouvelles fermes Sands et celui de Robin Rigg (voir plus loin). est de limiter la progression du parc espa-
éoliennes offshore : Alpha Ventus en Alle- gnol à 6 GW supplémentaires d’ici à 2012.
magne (60 MW), Gasslingegrund en Suède une année faiblement ventée
(30 MW), Horns Rev 2 (voir photo p. 53) (209,3 limite la production Le retour de la croissance allemande
MW), Sprogo (21 MW), Hvidrove (7,2 MW) La crise financière n’a pu que ralentir le
au Danemark et Rhyl Flats (90 MW) au L’augmentation de la production d’électri- retour à la croissance du marché allemand.
Royaume-Uni. La totalité des éoliennes des cité n’a pas été proportionnelle à l’augmen-
parcs de Lynn et Inner Dowsing sont égale- tation des capacités de production. Selon
SYSTÈMES SOLAIRES le journal de l’éolien N° 6 – 2010
BAROMÈTRE ÉOLIEN – E U RO B S E RV ’ E R – MARS 2010
10. 53
b aromètre éolien
Horns Rev 2, au large des côtes danoises,
le plus grand parc éolien offshore en service
dans le monde.
Horns Rev 2, off the Danish coast – the biggest
offshore wind farm in service in the worldwide.
Medwind/Bent Sørensen
light for the installation of 40 offshore farms in the North and finalise the legislative framework governing wind power (elec-
Baltic Seas last September. The aim is to connect about thirty wind tricity infrastructure orientations and adjustment, a single licens-
farms by 2020 for total capacity of 25 000 MW. ing system, compulsory distribution of installations per region).
However as the wind conditions were particularly poor in 2009, There was one minor hiccough in that about 10% of wind power
the additional capacity did nothing to spur electricity production. electricity production could not be utilised because of temporary
According to the BDEW (Bundesverbad der Energie- und Wasser- grid overload issues. The grid operator (Terna) therefore identi-
wirtschaft e.V.), production dropped over 3 TWh (from 40.6 TWh in fied production of 6.1 TWh for 6.7 TWh of effective production.
2008 to 37.5 TWh in 2009). Nonetheless wind power provides the
most renewable energy in Germany with a 6.4% share of total The French market is becoming increasingly regulated
gross electricity consumption (of a total renewable share of 16%). The French wind power market had a mediocre year in 2009, con-
The industry is quite confident that Germany has the capacity to tracting by 8.6% in relation to 2008. According to Ademe, French
achieve its national targets (45 000 MW by 2020). The sector’s capacity (including overseas departments and communities) rose
future appears assured by the stability of the renewable energy to 4 521 MW in 2009. This installation performance of 979 MW is
act (EEG), which revised the wind power feed-in tariff upwards in slightly down on 2008 when 1 060 MW of additional capacity was
2009 to reflect the increase in the price of turbines. installed. These figures, which dashed expectations, can be partly
put down to the Council of State’s cancellation, in August 2008, of
Italy chalks up a new record for installations the decree setting the feed-in tariff conditions for wind turbine
Italian market growth is back in the black and in line with the power due to formal reasons. The ministry redressed the situation
industry’s forecast. ANEV (the Italian national Wind Energy Asso- when it published a new order in December 2008 reworking the
ciation) reports that in 2008 Italy installed substance of the terms of the initial order dated
1 113.5 MW nudging about one hundred MW The industry is quite confident 10 July 2006.
up on 2008 (1 010.4 MW). The country has thus that Germany has the capacity The prospects for French market growth in 2010
consolidated its number three rank in Europe to achieve its national targets are uncertain, as the government announced its
for installed capacity with a cumulated wind Les professionnels de la filière intention to amend the wind turbine licensing
power base of 4 850 MW. The sector’s actors sont très confiants dans la system as of 1st January 2010, and include it
are satisfied with this positive result despite capacité du pays à atteindre within the scope of classified installations for
the tight economic context and reckon that ses objectifs nationaux the protection of the environment (ICPE) on the
the current pace of growth puts them on grounds that the perceived and foreseeable
course to meet the European Union’s national goals for 2020. Their expansion of wind farms calls for it to set up a tougher adminis-
communiqué states that the steady expansion of the Italian mar- trative regime together with a special administrative policy.
ket has resulted in a well-structured sector, the creation of jobs The inclusion of wind turbines in the ICPE regime throws into the
and given them a role in the country’s industrial and economic
development. They are also lobbying the public authorities to
SYSTÈMES SOLAIRES le journal de l’éolien N° 6 – 2010
BAROMÈTRE ÉOLIEN – E U RO B S E RV ’ E R – MARS 2010
11. 54
wind energy b arometer
L’Espagne est redevenue en 2009 le premier
marché éolien européen avec 2 459 MW
installés.
In 2009 Spain regained its top European
wind power market slot by installing
2 459 MW.
Javier Campos/Tryon
Selon le DEWI, l’Institut allemand de l’éner- 2009 ayant été particulièrement peu ventée. durant l’année 2009, soit une centaine de
gie éolienne, l’Allemagne a installé 1 916,8 Selon l’association allemande BDEW (Bun- mégawatts de plus qu’en 2008 (1 010,4 MW).
MW durant l’année 2009 contre 1 667,1 MW desverbad der Energie- und Wasserwirt- Le pays conforte ainsi sa troisième place
durant l’année 2008 (et schaft e.V.), la production européenne sur le plan de la puissance ins-
6,4 %
1 666,8 MW en 2007), soit a chuté de plus de 3 TWh tallée avec un parc éolien cumulé de 4 850
une croissance de 15 %. (de 40,6 TWh en 2008 à MW. Les acteurs de la filière se félicitent de
Le marché du “repowe- 37,5 TWh en 2009). L’éo- ce bon résultat malgré le contexte écono-
ring” c’est-à-dire du rem- lien reste cependant la mique difficile lié à la crise financière. Il consi-
la part de l’éolien dans
placement d’éoliennes première énergie renou- dère que le rythme de croissance actuel est
la consommation d’électricité
obsolètes, a atteint 136,2 velable du pays avec une en ligne avec les objectifs nationaux de 2020
brute en Allemagne
MW. Cette croissance the wind power share of gross part de 6,4 % de la con- de l’Union européenne. Selon le communi-
aurait pu être plus im- electricity consumption in Germany sommation d’électricité qué, la croissance régulière du marché italien
portante sans les pro- brute totale (sur une a permis de bien structurer la filière, de créer
blèmes liés aux radars militaires, près de part renouvelable totale de 16 %). de l’emploi et de participer au développe-
1 500 MW de projets (2 milliards d’euros d’in- Les professionnels de la filière sont con- ment industriel et économique du pays. Ces
vestissements) sont actuellement bloqués fiants dans la capacité du pays à atteindre organismes encouragent également les pou-
en attente des autorisations militaires. ses objectifs nationaux (45 000 MW d’ici à voirs publics à achever le cadre réglemen-
Le marché offshore allemand a véritable- 2020). L’avenir de la filière semble sécurisé taire de l’éolien (orientations et ajustement
ment démarré l’an dernier avec la connexion par la stabilité de la loi des infrastructures élec-
du parc Alpha Ventus (voir photo p. 56). Cette énergies renouvelables L’Italie conforte sa troisième triques, régime unique
ferme de 60 MW, équipée de six Repower 5 M (EEG) avec un tarif d’achat place européenne sur le plan d’autorisation, réparti-
et de six Multibrid M5000 (5 MW), a été mise éolien qui a été réévalué de la puissance installée tion de l’obligation d’ins-
en exploitation à 45 km des côtes par un en 2009 du fait de l’aug- Italy consolidates its number tallations par région).
consortium composé de RWE, E.ON et Vat- mentation du prix des three rank for installed Petit souci, environ 10 %
tenfall. Ce parc devrait être suivi de nom- turbines. power in Europe de la production d’élec-
breux autres projets, le gouvernement ayant tricité éolienne n’a pas
donné en septembre dernier son accord pour Nouveau record d’installations pu être utilisée du fait de problème de sur-
l’installation de 40 fermes offshore en mer en Italie charge temporaire du réseau, soit une pro-
du Nord et en mer Baltique. L’objectif est la La croissance du marché italien est une nou- duction recensée de 6,1 TWh par le ges-
connexion d’une trentaine de parcs d’ici à velle fois positive et conforme aux prévi- tionnaire de réseau (Terna) pour une
2020 totalisant une puissance de 25 000 MW. sions des professionnels du secteur. Selon production effective de 6,7 TWh.
La croissance du marché n’a cependant pas l’ANEV (Association italienne de l’énergie
profité à la production d’électricité, l’année éolienne), le pays a installé 1 113,5 MW
SYSTÈMES SOLAIRES le journal de l’éolien N° 6 – 2010
BAROMÈTRE ÉOLIEN – E U RO B S E RV ’ E R – MARS 2010
12. 55
b aromètre éolien
Tabl. n° 5
Tarifs d’achat éolien ou autres systèmes d’incitations dans une sélection de pays (en c€/kWh)
Feed-in tariffs for wind electricity or other support schemes in selected countries (in c€/kWh)
Éolien terrestre Éolien maritime Prix de
Onshore wind power Offshore wind power marché
Durée Durée à ajouter
Types de systèmes du contrat du contract Market
2009 2010 2009 2010 prices
Support schemes Contract Contract
duration duration to add
5 premières 12 premières
Tarif d’achat
années 9,2 9,11 années 13 13 no
Feed-in Tariff
Germany1 5 first years 12 first years
Tarif d’achat année 6 à 20 année 13 à 20
5,02 4,97 3,5 3,5 no
Feed-in Tariff year 6 to 20 year 13 to 20
Tarif d’achat Année 1 à 20
7,32 7,32 no
Feed-in Tariff year 1 to 20
Tarif d’achat/ Après 20 ans
6,12 6,12 no
Spain2 Feed-in Tariff after 20 years
Prime d’entrée + prix 7,13 (min.) 7,13 (min.) 8,43 (min.) 8,43 (min.)
20 ans 20 ans Inclus
du marché/Feed-in to 8,49 to 8,49 to 16,4 to 16,4
20 years 20 years Included
premium + market price (max.) (max.) (max.) (max.)
8,89 (Valeur d’un
Certificat vert (CV)
Italy Green certificate (GC)
CV/GC value n.a. – – yes
88,91€/MWh)
Tarif d’achat année 1 à 10 année 1 à 10
8,2 8,2 13 13 no
Feed-in Tariff year 1 to 10 year 1 to 10
année 11 à 15 année 11 à 20
France (dépendant du (dépendant du
Tarif d’achat facteur charge) facteur charge)
2,8-8,2 2,8-8,2 3,0-13 3,0-13 no
Feed-in Tariff year 11 to 15 year 11 to 20
(depending (depending
the load factor) the load factor)
Certificat d’obligation
d’achat (prix de marché
United moyen)/Renewable 5,9-5,23 11,8-10,433
n.a. n.a. yes
Kingdom Obligation Certificate (1 ROCs/MWh) (2ROCs/MWh)
ROCs (average
market price)
Tarif d’achat (valeurs
15 ans
Portugal 2008)/Feed-in Tariff
15 years
7,4 - 7,5 7,4 - 7,5 n.a. n.a. no
(values 2008)
22 000 heures
Prime ajoutée au prix Appel Appel
(environ 10 ans)
Denmark d’achat/Purchase
22 000 hours
3,3 3,3 d’offres d’offres yes
price subsidy Tender Tender
(around 10 years)
Tarif d’achat
Austria Feed-in Tariff
10+24 7,53 n.a. – – no
Appel Appel
Prix de référence SDE5
15 9,41 9,41 d’offres d’offres no
SDE5 reference price
Tender Tender
Netherlands Prix de référence SDE5
Appel Appel
(turbines > 6 MW)
15 – 9,61 d’offres d’offres no
SDE5 reference price
Tender Tender
(> 6 MW turbines)
n.a. : Non disponible. Not available. = Ne s’applique pas (pas de politique ou pas de potentiel). Does not apply (i.e. in the case of no policy or no potential).
1
En Allemagne, les tarifs d’achat peuvent être modulés durant les premières années d’exploitation (5 ans pour le terrestre et 12 ans pour l’offshore), pour les installa-
tions à faible rendement (éolien terrestre) ou selon la distance à la côte et de la profondeur de l’eau (éolien offshore). La nouvelle loi EEG 2009 valorise également la
rémunération des turbines équipées de système fournissant un service pour le réseau. Les nouvelles turbines équipées de ce système peuvent prétendre à un tarif
d’achat augmenté de 0,5 c€ /kWh. Les turbines déjà installées peuvent prétendre à une augmentation de 0,7c€/kWh, à condition que l’équipement soit opérationnel
avant 2011. In Germany the first years of operation (5 years for onshore and 12 years for offshore) can have a different level of FIT, depending on lower yield (onshore
wind) or distance to coast or water depth (offshore wind). The new feature of the 2009 EEG is that wind turbines should be able to provide system services to
the electricity grid in case of congestion. The initial fee for new turbines has been increased by €0.05/kWh. Existing turbines equipped with the system services
equipment, attract a bonus of €0.07/kWh (provided that the equipment is operational before 2011). 2En Espagne, les opérateurs peuvent choisir entre deux systèmes,
un système de tarif d’achat ou un bonus ajouté au prix de marché, le total étant encadré. Spain: operators can choose between a set feed-in tariff and a bonus added
to the market price, within a fixed ceiling. 3La valeur d’un ROCs sur le marché a varié durant l’année 2009 entre 51,81 £ et 45,52£. The ROCs market value varied
between £51.81 and £45.52 during 2009. 4En Autriche, l’année 11 et l’année 12 ont des tarifs d’achats réduit. Austria: Year 11 and year 12 have reduced FIT. 5À corriger
rétroactivement en fonction du prix de vente de l’électricité sur le marché de gros. Adjusted retroactively to the wholesale price. Source: EurObserv’ER 2010.
SYSTÈMES SOLAIRES le journal de l’éolien N° 6 – 2010
BAROMÈTRE ÉOLIEN – E U RO B S E RV ’ E R – MARS 2010
14. 59
b aromètre éolien
Parc éolien de Champfleury
dans l’Aude (France).
Champfleury wind farm
in the Aude (France).
Repower
balance installations that already been granted a construction tender in three 2 000-MW phases. The first phase should be announ-
permits. The law covering the national commitment to the envi- ced early in 2011, for farms of at least 300 MW (see Systèmes
ronment, known as the “Grenelle 2 law”, which will be submitted to Solaires, Le Journal des Énergies Renouvelables No.195. p.78).
Parliament at the beginning of February 2010, should define whether
or not the developers of these farms will have to file their applica- The British offshore challenge
tions from scratch under the classified installations regime, leaving According to the BWEA (British Wind Energy Association), British
many new wind turbine projects on hold at local prefecture level, wind power capacity passed the 4 GW mark in 2009 with 4 050.9
awaiting the make-or-break vote (see p.14). MW installed including 688.2 MW offshore. If these figures are
The government views that the implemen- compared with those of the previous year
tation of this new mechanism should stream- published by the DECC (Department of
line wind power project applications and
curb the possibilities of redress. Furthermore
the State departments are fully conversant
4 050.9 MW
British wind power capacity passed
Energy and Climate Change), the additional
capacity is of the order of 645 MW. How-
ever the figure for the British wind farm
with ICPE procedures, making for faster pro- the 4 GW mark in 2009 base could be revised upwards as the
cessing of applications… La puissance éolienne britannique BWEA did not include in its estimates the
This new procedure should soon be up and a franchi le cap des 4 GW en 2009 partial connection of two offshore farms
running, if the schedule that has been set avec 4 050,9 MW installés nearing completion. This is because accor-
for multiyear electricity production invest- ding to a recent EWEA (European Wind
ment planning (order dated 15 December 2009) is to be met. The Energy Association) study, 30 of the 60 turbines (i.e. 90 MW) were
31 December 2012 goals of 11 500 MW (10 500 MW onshore and already operating on the Robin Rigg site and 29 of the 48 turbines
1 000 MW for offshore wind farms) already seem to be compro- (i.e. 104.4 MW) on the Gunfleet Sands site at the end of 2009. If the
mised, which leaves the target of 25 000 MW (19 000 MW onshore operating capacity of UK’s offshore capacity was around 882.8
and 6 000 MW for offshore wind farms), considered as the country’s MW at the end of 2009. The BWEA reckons that 4 598 MW of off-
real target for 31 December 2020 as viable. As for the offshore mar- shore projects are either under construction off the United King-
ket, the feed-in tariff is too low to make wind farm construction a
going concern. Therefore the Ministry of Ecology intends to issue a
SYSTÈMES SOLAIRES le journal de l’éolien N° 6 – 2010
BAROMÈTRE ÉOLIEN – E U RO B S E RV ’ E R – MARS 2010
16. 61
b aromètre éolien
Tabl. n° 6
Top dix des constructeurs en 2008
Top ten of suppliers in 2008
MW fournis Part de marché Chiffre d’affaires MW fournis
Entreprise Pays Salariés en 2009
en 2008 en 2008 2008 en M€ en 2009*
Company Country Employees 2009
Supplied MW 2008 Market share in 2008 Turnover 2008 in M€ Supplied MW 2009*
Vestas Denmark 6 160 19,2% 6 035 6 131 20 730
GE Wind United States 5 239 16,4% n.a. n.a. 3 000
Gamesa Spain 3 684 11,5% 3 651 3 300-3 600 7 200
Enercon Germany 2 806 8,8% 2 800 3 100-3 300 12 000
Suzlon India 2 311 7,2% 2 113 1 900-2 100 14 000
Siemens Germany 1 947 6,1% 2 092 2 500 5 500
Wind Power
Sinovel China 1 403 4,4% n.a. 3 300 2 000
Acciona Spain 1 290 4,0% 1 784** n.a. 629
Goldwind China 1 132 3,5% n.a. n.a. 1 130
Nordex Germany 1 075 3,4% 1 136 n.a. 2 200
Others 4 955 15,5%
Total 32 002 100,0%
* Données préliminaires ou attendues./Preliminary or expected data. ** Division Énergie d’Acciona (pas seulement l’éolien)./Entire Acciona Energy Division
(not only wind power). Les décimales sont séparées par une virgule. Decimals are written with a comma. Source: EurObserv’ER 2010.
dom or approved and that offshore capacity could reasonably reckons that the development of these small installations will meet
rise to 20 000 MW by 2020. 2% of the country’s electricity demand by 2020.
Last December’s publication of the 2010 draft Finance Bill relieved
offshore wind farm developers. The bill upholds the value of off-
shore electricity at 2 ROCs (Renewable Obligation Certificates) per the wind power industry takes
megawatt-hour for accredited wind farms until 2014. The cost of a on the crisis
ROC in 2009 averaged at about fifty pounds and tended to drop
towards the end of the year (from £51.81 on 13 January 2009 to £46.25 adaptation to a new environment required
on 19 January 2010). The value of an offshore megawatt-hour was
raised from 1.5 to 2 ROCs in the 2009 budget passed last April, for all As it stands, the global wind power industry, whose leading players
projects that ordered turbines during financial year 2009-2010. The are listed in table 6, is relatively unscathed by the economic crisis-
industry was highly enthusiastic about the Ministry’s decision to induced credit squeeze. The industry is also attracting increasing
award 50 million pounds’ worth of aid to finance offshore wind tur- political support, through national commitments to reduce green-
bines manufacturing and equipment testing plants. The BWEA con- house gases and through job creation prospects. Investors and
firms that with an active support policy, the wind power sector banks are coming round to viewing wind power as a hedge against
could account for 60 000 jobs and 30% of the United Kingdom’s elec- inflation because incentive systems have been set up in many coun-
tricity. tries mitigating the associated financial risks. In contrast, lending
The DECC announced another new development early in February packages and project profitability are more harshly assessed, result-
– the introduction of a specific feed-in tariff system for households ing in the shelving of less profitable or higher-risk ventures, so some
and local authorities wishing to produce their own renewable elec- projects have had to be cancelled, playing havoc with manufactu-
tricity starting in April 2010. The electricity produced entitles the rers’ order books.
supplier to pecuniary compensation, including the own-account Another market trend is that the wind power market has gradu-
consumption part. The feed-in tariff for wind power modulates ally slipped into the clutches of major investors (utilities, oil com-
every year to keep pace with inflation and varies from 34.5 panies and major independent producers) over the last four to five
pence/kWh (€0.394 per kWh) for capacities below 1.5 kW to 4.5 years. The credit squeeze has primarily cushioned the European
pence/kWh (€0.051 per kWh) for capacities in the range 1.5-5 MWh. energy majors (RWE, Dong Energy, Vattenfall, Statkraft, Iberdrola,
A similar mechanism will be set up for investments in renewable Enel, EDF, EDP and E.ON) at the expense of independent produc-
energy-fuelled heating appliances as of April 2011. The idea is to ers who have had to relinquish some of their assets to them.
enable householders and low wage earners (via council housing One of the crisis-beating solutions the European manufacturers have
authorities) to reduce their energy bills (or earn additional revenue)
and actively participate in achieving the country’s goals. The DECC
SYSTÈMES SOLAIRES le journal de l’éolien N° 6 – 2010
BAROMÈTRE ÉOLIEN – E U RO B S E RV ’ E R – MARS 2010