1. Q3 2011 | OFFICE MARKET
HOUSTON OFFICE MARKET
RESEARCH & FORECAST REPORT
Large Blocks of Class A Office Space Continues to Shrink in
Popular Suburban Submarkets – Developers Respond to Demand
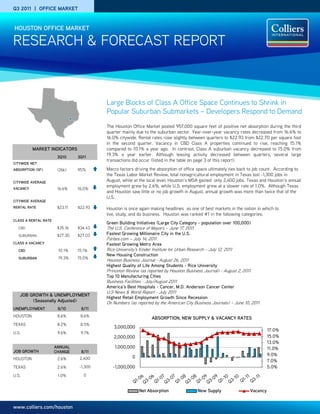
The Houston Office Market posted 957,000 square feet of positive net absorption during the third
quarter mainly due to the suburban sector. Year-over-year vacancy rates decreased from 16.6% to
16.0% citywide. Rental rates rose slightly between quarters to $22.93 from $22.70 per square foot
in the second quarter. Vacancy in CBD Class A properties continued to rise, reaching 15.1%
MARKET INDICATORS compared to 10.1% a year ago. In contrast, Class A suburban vacancy decreased to 15.0% from
3Q10 3Q11
19.3% a year earlier. Although leasing activity decreased between quarters, several large
transactions did occur (listed in the table on page 3 of this report).
CITYWIDE NET
ABSORPTION (SF) (26k) 957k Macro factors driving the absorption of office space ultimately ties back to job count. According to
)
the Texas Labor Market Review, total nonagricultural employment in Texas lost -1,300 jobs in
CITYWIDE AVERAGE August, while at the local level, Houston’s MSA gained only 2,400 jobs. Texas and Houston’s annual
employment grew by 2.6%, while U.S. employment grew at a slower rate of 1.0%. Although Texas
VACANCY 16.6% 16.0%
and Houston saw little or no job growth in August, annual growth was more than twice that of the
U.S.
CITYWIDE AVERAGE
RENTAL RATE $23.11 $22.93 Houston is once again making headlines as one of best markets in the nation in which to
live, study, and do business. Houston was ranked #1 in the following categories:
CLASS A RENTAL RATE
Green Building Initiatives (Large City Category - population over 100,000)
CBD $35.16 $34.43 The U.S. Conference of Mayors – June 17, 2011
SUBURBAN $27.30 $27.03 Fastest Growing Millionaire City in the U.S.
Forbes.com – July 14, 2011
CLASS A VACANCY Fastest Growing Metro Area
CBD 10.1% 15.1% Rice University's Kinder Institute for Urban Research – July 12, 2011
New Housing Construction
SUBURBAN 19.3% 15.0%
Houston Business Journal - August 26, 2011
Highest Quality of Life Among Students - Rice University
Princeton Review (as reported by Houston Business Journal) - August 2, 2011
Top 10 Manufacturing Cities
Business Facilities - July/August 2011
America's Best Hospitals - Cancer, M.D. Anderson Cancer Center
U.S News & World Report - July 2011
JOB GROWTH & UNEMPLOYMENT
Highest Retail Employment Growth Since Recession
(Seasonally Adjusted) On Numbers (as reported by the American City Business Journals) – June 10, 2011
UNEMPLOYMENT 8/10 8/11
HOUSTON 8.6% 8.6%
ABSORPTION, NEW SUPPLY & VACANCY RATES
TEXAS 8.2% 8.5%
3,000,000
17.0%
U.S. 9.6% 9.1%
2,000,000 15.0%
13.0%
ANNUAL 1,000,000 11.0%
JOB GROWTH CHANGE 8/11
0 9.0%
HOUSTON 2.6% 2,400
7.0%
TEXAS 2.6% -1,300 -1,000,000 5.0%
U.S. 1.0% 0
Net Absorption New Supply Vacancy
www.colliers.com/houston
2. RESEARCH & FORECAST REPORT | Q3 2011 | HOUSTON OFFICE MARKET
VACANCY & AVAILABILITY largest suburban contiguous block of sublease
Overall vacancy levels increased by 10 basis space available, 146,392 SF.
points between quarters to 16.0% from 15.9%.
ABSORPTION & DEMAND
CBD VS. SUBURBAN The average suburban vacancy decreased by
Houston recorded positive net absorption of
30 basis points to 15.6% from 15.9% the
CLASS A OFFICE VACANCY 956,939 SF in the third quarter, compared to
previous quarter, while CBD vacancy remained
25,586 SF of negative net absorption at the
20.0% the same at 16.0%. On a year-over-year
18.0% same time last year. Contributing to the
basis, city-wide vacancy decreased by 60
16.0% quarter’s positive gain was suburban Class A
basis points to 16.0% from 16.6%, suburban
14.0% space with a positive net absorption of 432,224
12.0%
vacancy decreased 140 basis points to 15.6%
SF, followed by suburban Class B space with
10.0% from 17.0%, and CBD increased 270 basis
positive net absorption of 393,730 SF, and CBD
8.0% points to 17.6% from 14.9%.
6.0%
Class A space with positive net absorption of
Vacancy in CBD Class A properties continued 275,027 SF. The majority of the CBD positive
4.0%
to rise, reaching 15.1% compared to 10.1% a net absorption was due to Hess moving out of
year ago. In contrast, vacancy rates in CBD One Allen Center and into their new building
Cass B properties decreased to 19.5% from where they almost double their space.
CBD VACANCY SUBURBAN VACANCY 23.1% 12 months earlier.
RENTAL RATES
Although suburban vacancy rates remained in
double-digits, Class A vacancy actually dropped Citywide rental rates rose slightly between
between quarters to 15.0% from 16.2%. By quarters to $22.93 from $22.70 per square
CLASS A OFFICE RENTS comparison, suburban Class B vacancy foot. On a year-over-year basis, CBD Class A
remained unchanged between quarters at average quoted rental rates dropped $0.73 to
$40.00
16.7% . $34.43 per square foot (from $35.16), while
$38.00
suburban Class A rates dropped $0.27 to
$36.00 Citywide, a total of 50 office properties had a $27.03 per square foot (from $27.30). The
$34.00 minimum of 100,000 SF available for lease in average CBD Class B asking rate decreased by
$32.00
both direct and sublease space, and 11 of those $0.18 to $23.69 per square foot (from
properties have over 200,000 SF $23.87), while suburban Class B rates rose
$30.00
available, down from 14 the previous quarter. $0.34 to $18.22 per square foot (from $17.88)
$28.00
Available sublease space totaled 3.1 million on a year-over-year basis. Until demand
$26.00
SF, including 1.7 million SF of vacant space and outpaces supply, rental rates are expected to
1.4 million SF of subleases available for remain flat.
occupancy over the next 18 months. The largest
sublease space being marketed is Devon
CBD RENTS SUBURBAN RENTS Energy’s 198,478 SF space in Two Allen Center
in the CBD. Braeswood Tower II has the
QUOTED GROSS RENTAL RATES FOR TOP PERFORMING OFFICE BUILDINGS
YEAR AVAIL. RENT
BUILDING NAME ADDRESS SUBMARKET RBA (SF) LEASED OWNER
BUILT SF ($/SF)
Metropolitan Life Insurance Co. &
Wells Fargo Plaza 1000 Louisiana CBD 1,721,242 1982 94.5% 357,683 $41.10
N.Y. State Retirement Fund
Heritage Plaza 1111 Bagby CBD 1,089,266 1986 90.8% 205,612 $40.50 Brookfield Office Properties
1100 Louisiana 1100 Louisiana CBD 1,265,332 1980 98.0% 89,153 $38.64 Enterprise Products Partners
Minute Maid Building 2150 Town Square Place E. Fort Bend 185,000 2008 76.2% 44,109 $30.00 Planned Community Developers
Wells Fargo Bank Tower 1300 Post Oak Blvd. Galleria 491,254 1983 93.8% 58,217 $36.15 TIAA-CREF
Williams Tower 2800 Post Oak Blvd Galleria 1,476,973 1983 88.3% 244,514 $32.17 Hines
9 Greenway Plaza 9 Greenway Greenway 746,824 1978 90.0% 102,823 $30.00 Crescent Real Estate Equities
One BriarLake Plaza 2000 W. Sam Houston Westchase 550,000 2000 98.5% 7,507 $39.15 Behringer Harvard
Waterway Plaza II 10001 Woodloch Forest Woodlands 142,560 2001 84.7% 69,759 $34.30 Triple Net Properties
Waterway Square 4 Waterway Ave. Woodlands 232,364 2009 98.9% 2,539 $36.00 The Woodlands Development
Note: Avail. SF includes direct and sublet space.
Source: CoStar Property
COLLIERS INTERNATIONAL | P. 2
3. RESEARCH & FORECAST REPORT | Q3 2011 | HOUSTON OFFICE MARKET
SALES ACTIVITY
Houston’s Office Investment sales activity decreased between quarters with only 15 properties changing hands, compared to 25 in the
previous quarter. According to CoStar, office sale transactions had a total dollar volume of $164.7 million, averaging $75/SF with a
8.3% capitalization rate.
Most of the transactions were mid-rise Class B properties. The most significant transactions that closed during the third quarter are
listed in the table below.
Q3 2011 SIGNIFICANT SALES TRANSACTIONS
YEAR SALE
BUILDING NAME SUBMARKET RBA (SF) BUYER SELLER $/SF CLOSED
BUILT PRICE
North Belt
Intercontinental Center 196,895 1983 Laurus Corporation Bresler & Reiner, Inc. $23.4M $119 8/2011
/Greenspoint
4601 Westway Park Blvd Northwest Far 88,000 2006 Cameron International Baker Hughes Inc. $14.2M $161 7/2011
San Felipe/
7700 San Felipe 100,716 1978 Velocis Partners Unilev Capital Corp $10.5M $104 9/2011
Voss
Houston Club Building CBD 348,429 1938 Skanska USA Wells Fargo & Co $13.0M $37 9/2011
LEASING ACTIVITY
Houston’s office leasing activity reached 2.8 million SF in the second quarter, compared to 3.2 million SF in the same quarter last year.
Leasing activity is still below levels prior to the economic downturn, with many tenants relocating to buildings/submarkets offering more
attractive terms.
Some of the more significant leases signed during the third quarter are listed in the table below.
Q3 2011 TOP OFFICE LEASES
BUILDING NAME/ADDRESS SUBMARKET SF TENANT LEASE DATE
Westway III Northwest Far 181,814 GE Oil & Gas 7/2011
Three Eldridge Katy Freeway 166,452 BP 6/2011
CityWestPlace 3 Westchase 115,056 ION Geophysical Corp* 6/2011
One Allen Center CBD 110,816 Carrizo Oil & Gas, Inc. 8/2011
Williams Tower Galleria/West Loop 75,000 Rowan Companies* 6/2011
1177 W Loop S Post Oak Park 49,574 Cornerstone Mortgage* 7/2011
Two Riverway Riverway 44,818 Gainer, Donnelly, & Desroches 7/2011
*Renewal and/or Expansion;
HOUSTON OFFICE SUBMARKET MAP
COLLIERS INTERNATIONAL | P. 3
7. RESEARCH & FORECAST REPORT | Q3 2011 | HOUSTON OFFICE MARKET
HOUSTON SUBURBAN OFFICE MARKET SUMMARY - CONTINUED
Inventory Direct Vacancy Sublease Vacancy Vacancy Vacancy Rate (%) Net Absorption (SF) Rental Rate
# of
Class Total (SF) (SF) Rate (%) (SF) Rate (%) Total (SF) Q3-2011 Q2-2011 Q3-2011 YTD 2011 AVG ($/SF)
Bldgs.
West Loop/Galleria
A 38 15,619,230 1,563,499 10.0% 83,094 0.5% 1,646,593 10.5% 9.9% 38,983 -116,703 $28.65
B 56 6,371,937 1,402,453 22.0% 5,482 0.1% 1,407,935 22.1% 21.6% 56,703 -5,541 $21.02
C 4 240,656 0 0.0% 0 0.0% 0 0.0% 0.0% 0 940 $16.75
Total 98 22,231,823 2,965,952 13.3% 88,576 0.4% 3,054,528 13.7% 12.7% 95,686 -121,304 $26.02
Westchase
A 27 7,861,857 972,654 12.4% 71,828 0.9% 1,044,482 13.3% 14.2% 1,004 242,957 $26.59
B 53 5,041,513 913,985 18.1% 9,819 0.2% 923,804 18.3% 19.3% 8,905 -113,580 $18.18
C 7 339,118 50,923 15.0% 0 0.0% 50,923 15.0% 8.3% 11,485 1,954 $15.65
Total 87 13,242,488 1,937,562 14.6% 81,647 0.6% 2,019,209 15.2% 15.9% 21,394 131,331 $22.32
The Woodlands
A 19 3,623,349 305,699 8.4% 5,664 0.2% 311,363 8.6% 20.1% 183,649 216,549 $28.24
B 59 3,101,648 458,680 14.8% 22,601 0.7% 481,281 15.5% 16.3% 9,157 157,301 $19.83
C 6 398,110 26,430 6.6% 0 0.0% 26,430 6.6% 7.1% -1,311 7,437 -
Total 84 7,123,107 790,809 11.1% 28,265 0.4% 819,074 11.5% 17.2% 191,495 381,287 $22.22
OFFICE DEVELOPMENT PIPELINE
Houston’s development activity increased slightly during the third quarter, with eight projects under construction. Large blocks of quality
Class A space in the more popular suburban submarkets has become harder to find. Office developers have slowly taken notice of the
demand and have begun building in those select areas. The following table is a summary of the projects currently in the construction
pipeline.
SELECT OFFICE BUILDINGS UNDER CONSTRUCTION
BUILDING NAME ADDRESS SUBMARKET SF PRE-LEASED DEVELOPER EST. DELIVERY
Nexen Building 945 Bunker Hill Katy Freeway 331,513 57.2% MetroNational Corp 8/2012
BBVA Compass/2200 Post Oak 2200 Post Oak Blvd. Galleria/Uptown 306,012 51.1% Redstone and Stream 4/2013
Saturn Three 1800 Space Park Dr. Nasa/Clear Lake 264,000 0.0% Nassau Development Co 12/2012
CityCentre Three 842 W Sam Houston Pky N Katy Freeway 120,228 25.1% Midway Companies 9/2012
CityCentre Four 840 W Sam Houston Pky N Katy Freeway 120,000 0.0% Midway Companies 12/2012
Halliburton North Belt Campus Milner Road North Belt/Greenspoint 100,000 100.0% D. E. Harvey Builders 1/2013
High Street 4410 Westheimer Rd Post Oak Park 78,966 0.0% Trademark Property 3/2012
Technology Forest Professional 4055 Technology Forest Woodlands 50,000 50.0% Woodlands Land Dev 12/2011
COLLIERS INTERNATIONAL | P. 7
8. RESEARCH & FORECAST REPORT | Q3 2011 | HOUSTON OFFICE MARKET
Colliers International Statistics
Revenues: $1.5 Billion
Countries: 61
Offices: 512
Professionals & Staff: 12,509
Brokers: 4,387
Square Feet Managed: 979 Million*
Lease/Sale Transactions: 73,972
Total Transaction Value: $59.6 Billion
(Based on 2010 results.)
*The combination of Colliers International and FirstService results in 2.2
Billion under management (2nd largest in the world.
COLLIERS INTERNATIONAL | HOUSTON
1300 Post Oak Boulevard
Suite 200
Houston, Texas 77056
Main +1 713 222 2111
Accelerating success.
COLLIERS INTERNATIONAL | P. 8