Ebullient Investments Limited specializes in Building contractor
Houston Office Market Report 4Q 2011
1. Q4 2011 | OFFICE MARKET
HOUSTON OFFICE MARKET
RESEARCH & FORECAST REPORT
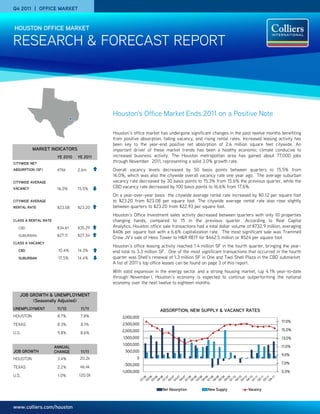
Houston’s Office Market Ends 2011 on a Positive Note
Houston’s office market has undergone significant changes in the past twelve months benefiting
from positive absorption, falling vacancy, and rising rental rates. Increased leasing activity has
been key to the year-end positive net absorption of 2.6 million square feet citywide. An
MARKET INDICATORS important driver of these market trends has been a healthy economic climate conducive to
YE 2010 YE 2011 increased business activity. The Houston metropolitan area has gained about 77,000 jobs
CITYWIDE NET
through November 2011, representing a solid 3.0% growth rate.
ABSORPTION (SF) 476k 2.6m Overall vacancy levels decreased by 50 basis points between quarters to 15.5% from
)
16.0%, which was also the citywide overall vacancy rate one year ago. The average suburban
CITYWIDE AVERAGE vacancy rate decreased by 30 basis points to 15.3% from 15.6% the previous quarter, while the
VACANCY 16.0% 15.5% CBD vacancy rate decreased by 100 basis points to 16.6% from 17.6%.
On a year-over-year basis the citywide average rental rate increased by $0.12 per square foot
CITYWIDE AVERAGE to $23.20 from $23.08 per square foot. The citywide average rental rate also rose slightly
RENTAL RATE $23.08 $23.20 between quarters to $23.20 from $22.93 per square foot.
Houston’s Office Investment sales activity decreased between quarters with only 10 properties
CLASS A RENTAL RATE changing hands, compared to 15 in the previous quarter. According to Real Capital
CBD $34.61 $35.29 Analytics, Houston office sale transactions had a total dollar volume of $732.9 million, averaging
$406 per square foot with a 6.6% capitalization rate. The most significant sale was Trammell
SUBURBAN $27.11 $27.34
Crow JV’s sale of Hess Tower to H&R REIT for $442.5 million or $524 per square foot.
CLASS A VACANCY
Houston’s office leasing activity reached 1.4 million SF in the fourth quarter, bringing the year-
CBD 10.4% 14.3% end total to 3.3 million SF. One of the most significant transactions that occurred in the fourth
SUBURBAN 17.5% 14.4% quarter was Shell’s renewal of 1.3 million SF in One and Two Shell Plaza in the CBD submarket.
A list of 2011’s top office leases can be found on page 3 of this report.
With solid expansion in the energy sector and a strong housing market, (up 4.1% year-to-date
through November), Houston’s economy is expected to continue outperforming the national
economy over the next twelve to eighteen months.
JOB GROWTH & UNEMPLOYMENT
(Seasonally Adjusted)
UNEMPLOYMENT 11/10 11/11 ABSORPTION, NEW SUPPLY & VACANCY RATES
HOUSTON 8.7% 7.8% 3,000,000
17.0%
TEXAS 8.3% 8.1% 2,500,000
2,000,000 15.0%
U.S. 9.8% 8.6%
1,500,000 13.0%
1,000,000
ANNUAL 11.0%
JOB GROWTH CHANGE 11/11 500,000
9.0%
HOUSTON 3.4% 20.2k 0
-500,000 7.0%
TEXAS 2.2% 46.4k
-1,000,000 5.0%
U.S. 1.0% 120.0k
Net Absorption New Supply Vacancy
www.colliers.com/houston
2. RESEARCH & FORECAST REPORT | Q4 2011 | HOUSTON OFFICE MARKET
VACANCY & AVAILABILITY suburban contiguous block of sublease space
CBD VS. SUBURBAN Overall vacancy levels decreased by 50 basis available, 146,392 SF.
CLASS A OFFICE VACANCY points between quarters to 15.5% from 16.0%.
ABSORPTION & DEMAND
The average suburban vacancy rate decreased
20.0% Houston recorded positive net absorption of
18.0% by 30 basis points to 15.3% from 15.6% the
1,226,000 SF in the fourth quarter, bringing the
16.0% previous quarter, while CBD vacancy decreased
year-end total to 2,643,000 SF. Contributing to
14.0% by 100 basis points to 16.6% from 17.6%. On a
the quarter’s positive gain was suburban Class
12.0% year-over-year basis the city-wide vacancy
A space with a positive net absorption of
10.0% rate decreased by 50 basis points to 15.5%
8.0% 631,000 SF, followed by suburban Class B
from 16.0%. The suburban vacancy rate
6.0% space with positive net absorption of 269,000
decreased 130 basis points to 15.3% from
4.0% SF, and CBD Class A space with positive net
16.2%, and the CBD vacancy rate increased 170
absorption of 175,000 SF. The majority of the
basis points to 16.6% from 14.9%.
CBD positive absorption was due to company
Vacancy in CBD Class A properties decreased expansions including Carrizo Oil & Gas, Burns &
CBD VACANCY SUBURBAN VACANCY to 14.3% from 15.1% between quarters, while McDonnell and Eagle Rock Energy Partners.
CBD Class B vacancy rates decreased to 18.0%
from 19.5%. RENTAL RATES
Although suburban vacancy rates remained in Citywide rental rates rose between quarters to
CLASS A OFFICE RENTS double-digits, Class A vacancy actually dropped $23.20 from $22.93 per square foot. The CBD
$40.00 between quarters to 14.4% from 15.0%. The Class A average quoted rental rate increased by
suburban Class B vacancy rate decreased $0.86 to $35.29 per square foot from
$38.00
between quarters to 16.6% from 16.7%. $34.43, while the suburban Class A average
$36.00
rate increased $0.31 to $27.34 per square foot
$34.00 Citywide, a total of 46 office properties had a from $27.03. The CBD Class B average rate
$32.00 minimum of 100,000 SF available for lease in decreased by $0.04 to $23.65 per square foot
both direct and sublease space, and 13 of those from $23.69, while the suburban Class B
$30.00
properties have over 200,000 SF available. average rate rose $0.08 to $18.30 per square
$28.00
Available sublease space totaled 3.1 million foot from $18.22 between quarters.
$26.00
SF, including 1.7 million SF of vacant space and On a year-over-year basis the citywide average
1.4 million SF of subleases available for rental rate increased by $0.12 per square foot.
occupancy over the next 18 months. The largest
available sublease space is Devon Energy’s
CBD RENTS SUBURBAN RENTS 198,478 SF space in Two Allen Center in the
CBD. Braeswood Tower II has the largest
QUOTED GROSS RENTAL RATES FOR TOP PERFORMING OFFICE BUILDINGS
YEAR AVAIL. RENT
BUILDING NAME ADDRESS SUBMARKET RBA (SF) LEASED OWNER
BUILT SF ($/SF)
Metropolitan Life Insurance Co. &
Wells Fargo Plaza 1000 Louisiana CBD 1,721,242 1982 96.0% 324,156 $41.10
N.Y. State Retirement Fund
Heritage Plaza 1111 Bagby CBD 1,089,266 1986 89.0% 194,407 $40.50 Brookfield Office Properties
BG Group Place 811 Main CBD 972,474 2011 62.3% 366,608 $42.00 CalPERS
Minute Maid Building 2150 Town Square Place E. Fort Bend 185,000 2008 77.6% 41,489 $30.00 Planned Community Developers
Wells Fargo Bank Tower 1300 Post Oak Blvd. Galleria 491,254 1983 93.8% 55,155 $36.15 TIAA-CREF
Williams Tower 2800 Post Oak Blvd Galleria 1,476,973 1983 88.3% 251,024 $35.17 Hines
9 Greenway Plaza 9 Greenway Greenway 746,824 1978 93.6% 71,503 $32.22 Crescent Real Estate Equities
One BriarLake Plaza 2000 W. Sam Houston Westchase 550,000 2000 100% 47,332 $39.15 Behringer Harvard
Waterway Plaza II 10001 Woodloch Forest Woodlands 142,560 2001 83.8% 77,906 $34.30 Triple Net Properties
Waterway Square 4 Waterway Ave. Woodlands 232,364 2009 98.9% 2,539 $36.00 The Woodlands Development
Note: Avail. SF includes direct and sublet space.
Source: CoStar Property
COLLIERS INTERNATIONAL | P. 2
3. RESEARCH & FORECAST REPORT | Q4 2011 | HOUSTON OFFICE MARKET
SALES ACTIVITY
Houston’s Office Investment sales activity decreased between quarters with only 10 properties changing hands, compared to 15 in the
previous quarter. According to Real Capital Analytics, Houston office sale transactions had a total dollar volume of $732.9
million, averaging $406/SF with a 6.6% capitalization rate.
The most significant transactions that closed during the fourth quarter are listed in the table below.
Q4 2011 SIGNIFICANT SALES TRANSACTIONS
YEAR
BUILDING NAME SUBMARKET RBA (SF) BUYER SELLER SALE PRICE $/SF CLOSED
BUILT
Hess Tower CBD 844,763 2010 H&R REIT Trammell Crow JV $442.5M $524 12/2011
2500 CityWest Westchase 578,284 1982 Crimson R E Fund JV Thomas Properties JV $132.5M $231 11/2011
LEASING ACTIVITY
Houston’s office leasing activity reached 1.4 million SF in the fourth quarter, bringing the year-end total to 3.3 million SF. Below is a list
of the significant 2011 lease transactions.
2011 TOP OFFICE LEASES
BUILDING NAME/ADDRESS SUBMARKET SF TENANT LEASE DATE
One Shell Plaza CBD 804,491 Shell* 11/2011
Two Shell Plaza CBD 471,934 Shell* 11/2011
1600 Smith CBD 311,000 Chevron* 5/2011
Fulbright Tower CBD 229,676 Fulbright & Jaworski* 1/2011
Westway III Northwest Far 181,814 GE Oil & Gas 6/2011
Three Eldridge Katy Freeway West 166,452 BP 7/2011
1325 Dairy Ashford Katy Freeway West 155,324 Schlumberger* 2/2011
Eldridge Oaks Katy Freeway West 138,000 KBR* 4/2011
Galleria Plaza I West Loop/Galleria 120,458 Telecheck Services* 2/2011
CityWestPlace 3 Westchase 115,056 ION Geophysical* 6/2011
One Allen Center CBD 110,816 Carrizo Oil & Gas, Inc. 8/2011
Waterway Square Woodlands 103,200 Newfield Exploration 3/2011
12 Greenway Plaza Greenway Plaza 93,594 Direct Energy* 3/2011
Five Post Oak Park Post Oak Park 87,212 Willbros United States Holdings, Inc.* 3/2011
5 Greenway Plaza Greenway Plaza 81,565 Occidental Oil & Gas Corporation* 1/2011
One Westchase Center Westchase 80,033 EDG* 1/2011
1330 Enclave Parkway Katy Freeway West 75,000 Lloyd’s Register 3/2011
Williams Tower West Loop/ Galleria 75,000 Rowan Companies* 6/2011
America Tower Allen Parkway 70,000 BBS Technologies** 2/2011
Offices at Park 10 Katy Freeway West 68,205 MODEC International, Inc. 1/2011
First City Tower CBD 68,201 Black Stone Minerals* 1/2011
Ashford V Katy Freeway West 62,026 FloaTEC Solutions 3/2011
Sage Plaza West Loop/Galleria 55,000 Columbia Gas Transmission 5/2011
8847 W Sam Houston Parkway Northwest 50,201 Twin Eagle Resource Management 7/2011
5959 Corporate Drive Southwest 50,000 Amerigroup Corp 4/2011
1177 W Loop S Post Oak Park 49,574 Cornerstone Mortgage* 6/2011
Two Riverway Riverway 44,818 Gainer, Donnelly, & Desroches 7/2011
Remington Square Northwest 42,364 Seawell 6/2011
Chase Tower CBD 42,136 Breitburn Energy* 4/2011
*Renewal and/or Expansion
** Sublease
COLLIERS INTERNATIONAL | P. 3
4. RESEARCH & FORECAST REPORT | Q4 2011 | HOUSTON OFFICE MARKET
HOUSTON OFFICE MARKET SUMMARY (CBD, SUBURBAN & CITYWIDE)
Rental
Inventory Direct Vacancy Sublease Vacancy Vacancy Vacancy Rate (%) Net Absorption (SF) Rate
# of AVG
Class Total (SF) (SF) Rate (%) (SF) Rate (%) Total (SF) Q4-2011 Q3-2011 Q4-2011 YE 2011
Bldgs. ($/SF)
CBD
A 28 26,123,539 2,913,485 11.2% 826,722 3.2% 3,740,207 14.3% 15.1% 174,827 448,442 $35.29
B 35 9,885,553 1,750,213 17.7% 27,068 0.3% 1,777,281 18.0% 19.5% 87,259 117,998 $23.65
C 19 1,704,299 748,233 43.9% 0 0.0% 748,233 43.9% 44.6% 11,791 -16,755 $18.28
Total 82 37,713,391 5,411,931 14.4% 853,790 2.3% 6,265,721 16.6% 17.6% 273,877 549,685 $31.02
SUBURBAN
A 241 65,436,537 9,058,008 13.8% 337,738 0.5% 9,395,746 14.4% 15.0% 631,143 1,862,194 $27.34
B 915 76,206,180 12,176,556 16.0% 454,156 0.6% 12,630,712 16.6% 16.7% 269,402 400,505 $18.30
C 442 18,331,332 2,380,988 13.0% 49,168 0.3% 2,430,156 13.3% 13.5% 52,057 -169,659 $14.91
Total 1598 159,974,049 23,615,552 14.8% 841,062 0.5% 24,456,614 15.3% 15.6% 952,602 2,093,040 $21.41
OVERALL
A 269 91,560,076 11,971,493 13.1% 1,164,460 1.3% 13,135,953 14.3% 15.0% 805,970 2,310,636 $29.61
B 950 86,091,733 13,926,769 16.2% 481,224 0.6% 14,407,993 16.7% 17.0% 356,661 518,503 $18.92
C 461 20,035,631 3,129,221 15.6% 49,168 0.2% 3,178,389 15.9% 16.2% 63,848 -186,414 $15.24
Total 1680 197,687,440 29,027,483 14.7% 1,694,852 0.9% 30,722,335 15.5% 16.0% 1,226,479 2,642,725 $23.20
HOUSTON SUBURBAN OFFICE MARKET SUMMARY
Rental
Inventory Direct Vacancy Sublease Vacancy Vacancy Vacancy Rate (%) Net Absorption (SF) Rate
# of AVG
Class Total (SF) (SF) Rate (%) (SF) Rate (%) Total (SF) Q4-2011 Q3-2011 Q4-2011 YE 2011
Bldgs. ($/SF)
Allen Parkway
A 2 1,198,654 189,590 15.8% 0 0.0% 189,590 15.8% 16.2% 4,198 54,685 $28.74
B 30 2,866,922 223,012 7.8% 3,348 0.1% 226,360 7.9% 6.5% -37,199 -62,204 $22.78
C 25 1,141,150 406,251 35.6% 0 0.0% 406,251 35.6% 35.8% 3,434 21,727 $19.67
Total 57 5,206,726 818,853 15.7% 3,348 0.1% 822,201 15.8% 15.2% -29,567 14,208 $25.49
Baytown
B 4 244,544 6,802 2.8% 0 0.0% 6,802 2.8% 2.8% 0 0 $14.53
C 4 201,358 7,083 3.5% 0 0.0% 7,083 3.5% 3.2% -1,496 -456 $16.25
Total 8 445,902 13,885 3.1% 0 0.0% 13,885 3.1% 3.0% -1,496 -456 $14.99
Bellaire
A 6 1,086,526 107,990 9.9% 0 0.0% 107,990 9.9% 8.2% -19,296 -26,945 $24.08
B 13 1,714,873 239,097 13.9% 8,381 0.5% 247,478 14.4% 13.8% -10,895 -4,270 $20.93
C 7 604,738 143,190 23.7% 10,454 1.7% 153,644 25.4% 24.8% -3,428 -20,048 $14.01
Total 26 3,406,137 490,277 14.4% 18,835 0.6% 509,112 14.9% 14.0% -33,619 -51,263 $21.22
Conroe
A 1 60,000 0 0.0% 0 0.0% 0 0.0% 0.0% 0 0 -
B 3 129,475 34,730 26.8% 0 0.0% 34,730 26.8% 26.8% 0 -18,022 $15.77
C 7 354,307 2875 0.8% 0 0.0% 2,875 0.8% 0.9% 0 0 $13.40
Total 11 543,782 37,605 6.9% 0 0.0% 37,605 6.9% 7.2% 0 -18,022 $15.32
E. Fort Bend
A 18 3,416,217 899,956 26.3% 18,679 0.5% 918,635 26.9% 27.6% 34,232 67,650 $27.48
B 37 2,122,313 187,271 8.8% 79,566 3.7% 266,837 12.6% 15.9% 57,705 46,321 $18.47
C 5 216,013 1,668 0.8% 0 0.0% 1,668 0.8% 1.2% 0 1,587 $18.50
Total 60 5,754,543 1,088,895 18.9% 98,245 1.7% 1,187,140 20.6% 22.6% 91,937 115,558 $23.86
COLLIERS INTERNATIONAL | P. 4
6. RESEARCH & FORECAST REPORT | Q4 2011 | HOUSTON OFFICE MARKET
HOUSTON SUBURBAN OFFICE MARKET SUMMARY - CONTINUED
Rental
Inventory Direct Vacancy Sublease Vacancy Vacancy Vacancy Rate (%) Net Absorption (SF) Rate
# of AVG
Class Total (SF) (SF) Rate (%) (SF) Rate (%) Total (SF) Q4-2011 Q3-2011 Q4-2011 YE 2011
Bldgs. ($/SF)
Northwest/Outlier
A 18 3,351,796 800,878 23.9% 27,713 0.8% 828,591 24.7% 29.2% 75,618 235,696 $23.89
B 71 6,529,176 1,551,153 23.8% 33,696 0.5% 1,584,849 24.3% 22.9% 23,913 56,298 $16.19
C 39 1,473,170 161,287 10.9% 0 0.0% 161,287 10.9% 11.4% 7,072 -34,367 $12.45
Total 128 11,354,142 2,513,318 22.1% 61,409 0.5% 2,574,727 22.7% 23.4% 106,603 257,627 $17.98
Richmond/Fountainview
B 14 781,369 93,451 12.0% 0 0.0% 93,451 12.0% 10.4% -12,426 -9,555 $15.59
C 16 598,633 80,663 13.5% 0 0.0% 80,663 13.5% 13.4% -534 -36,643 $14.06
Total 30 1,380,002 174,114 12.6% 0 0.0% 174,114 12.6% 11.7% -12,960 -46,198 $15.19
San Felipe/Voss
A 3 1,714,930 310,509 18.1% 0 0.0% 310,509 18.1% 14.6% -60,221 -49,570 $31.58
B 31 3,279,441 306,381 9.3% 22,026 0.7% 328,407 10.0% 9.6% -18,158 -12,362 $19.80
C 4 239,680 48,067 20.1% 0 0.0% 48,067 20.1% 19.4% -1,735 -10,489 $14.72
Total 38 5,234,051 664,957 12.7% 22,026 0.4% 686,983 13.1% 11.6% -80,114 -72,421 $23.70
South
A 1 80,000 19,000 23.8% 1702 2.1% 20,702 25.9% 23.8% -1,702 -202 $28.36
B 13 479,107 92,230 19.3% 0 0.0% 92,230 19.3% 18.4% 2,394 -8,494 $18.44
C 4 223,029 42,056 18.9% 0 0.0% 42,056 18.9% 18.7% 237 -2,472 $14.91
Total 18 782,136 153,286 19.6% 1702 0.2% 154,988 19.8% 19.0% 929 -11,168 $19.21
South Main/Med Center
A 14 4,474,422 376,413 8.4% 0 0.0% 376,413 8.4% 10.7% 138,704 72,963 $29.74
B 35 4,055,197 261,901 6.5% 0 0.0% 261,901 6.5% 6.9% 16,179 59,679 $23.91
C 32 2,486,810 140,622 5.7% 0 0.0% 140,622 5.7% 5.1% 17,577 -693 $18.33
Total 81 11,016,429 778,936 7.1% 0 0.0% 778,936 7.1% 7.8% 172,460 131,949 $25.13
Southeast/Outlier
A 1 159,304 0 0.0% 0 0.0% 0 0.0% 0.0% 0 0 -
B 9 477,658 112,908 23.6% 0 0.0% 112,908 23.6% 20.5% -6,275 -28,631 $20.21
C 2 118,772 12,533 10.6% 0 0.0% 12,533 10.6% 10.6% 0 0 $24.00
Total 12 755,734 125,441 16.6% 0 0.0% 125,441 16.6% 14.9% -6,275 -28,631 $20.65
Southwest
A 6 1,583,702 283,482 17.9% 0 0.0% 283,482 17.9% 20.6% 7,400 164,906 $16.04
B 58 5,856,602 1,462,328 25.0% 34,083 0.6% 1,496,411 25.6% 21.3% -150,490 -213,022 $15.77
C 41 2,300,174 199,560 8.7% 832 0.0% 200,392 8.7% 10.5% 64,813 29,929 $12.92
Total 105 9,740,478 1,945,370 20.0% 34,915 0.4% 1,980,285 20.3% 18.6% -78,277 -18,187 $15.44
Southwest Far and Outlier
A 1 57,710 7,779 13.5% 0 0.0% 7,779 13.5% 10.3% -1,832 1,562 $23.00
B 14 610,117 76,028 12.5% 0 0.0% 76,028 12.5% 21.3% 12,567 154,904 $26.28
C 3 128,735 1,000 0.8% 0 0.0% 1,000 0.8% 0.8% 0 0 $16.00
Total 18 796,562 84,807 10.6% 0 0.0% 84,807 10.6% 17.5% 10,735 156,466 $25.78
COLLIERS INTERNATIONAL | P. 6
7. RESEARCH & FORECAST REPORT | Q4 2011 | HOUSTON OFFICE MARKET
HOUSTON SUBURBAN OFFICE MARKET SUMMARY - CONTINUED
Rental
Inventory Direct Vacancy Sublease Vacancy Vacancy Vacancy Rate (%) Net Absorption (SF) Rate
# of Total AVG
Class Total (SF) (SF) Rate (%) (SF) Rate (%) Q4-2011 Q3-2011 Q4-2011 YE 2011
Bldgs. (SF) ($/SF)
West Loop/Galleria
A 35 14,629,698 1,525,354 10.4% 74,463 0.5% 1,599,817 10.9% 10.5% 50,604 -66,099 $29.30
B 59 7,372,003 1,386,869 18.8% 8,683 0.1% 1,395,552 18.9% 22.1% 20,408 14,867 $21.30
C 4 240,656 0 0.0% 0 0.0% 0 0.0% 0.0% 0 940 $16.75
Total 98 22,242,357 2,912,223 13.1% 83,146 0.4% 2,995,369 13.5% 13.7% 71,012 -50,292 $26.49
Westchase
A 21 6,636,105 783,017 11.8% 16,384 0.2% 799,401 12.0% 13.3% 162,360 405,317 $27.71
B 59 6,256,422 1,011,374 16.2% 9,819 0.2% 1,021,193 16.3% 18.3% -22,508 -136,088 $18.04
C 7 339,118 62,224 18.3% 0 0.0% 62,224 18.3% 15.0% -11,301 -9,347 $15.40
Total 87 13,231,645 1,856,615 14.0% 26,203 0.2% 1,882,818 14.2% 15.2% 128,551 259,882 $21.83
The Woodlands
A 17 3,311,365 199,262 6.0% 13,630 0.4% 212,892 6.4% 8.6% 29,972 246,521 $28.92
B 61 3,221,636 426,329 13.2% 26,311 0.8% 452,640 14.1% 15.5% 155,778 313,079 $19.74
C 6 398,110 24,320 6.1% 0 0.0% 24,320 6.1% 6.6% 2,110 9,547 -
Total 84 6,931,111 649,911 9.4% 39,941 0.6% 689,852 10.0% 11.5% 187,860 569,147 $22.87
OFFICE DEVELOPMENT PIPELINE
Currently, there are six buildings in Houston’s construction pipeline. The following table is a summary of those projects.
SELECT OFFICE BUILDINGS UNDER CONSTRUCTION
BUILDING NAME ADDRESS SUBMARKET SF PRE-LEASED DEVELOPER EST. DELIVERY
Nexen Building 945 Bunker Hill Katy Freeway 331,513 57.2% MetroNational Corp 8/2012
BBVA Compass/2200 Post Oak 2200 Post Oak Blvd. Galleria/Uptown 306,012 51.1% Redstone and Stream 4/2013
Skanska Commercial
3009 Post Oak Blvd. 3009 Post Oak Blvd. Galleria/Uptown 302,539 0.0% 7/2013
Development
CityCentre Three (Nexen) 842 W Sam Houston Pky N Katy Freeway 120,228 44.7% Midway Companies 9/2012
Halliburton North Belt Campus Milner Road North Belt/Greenspoint 100,000 100.0% D. E. Harvey Builders 1/2013
Technology Forest Professional 4055 Technology Forest Woodlands 50,000 50.0% D’Agostino Companies 1/2012
HOUSTON OFFICE SUBMARKET MAP
COLLIERS INTERNATIONAL | P. 7
8. RESEARCH & FORECAST REPORT | Q4 2011 | HOUSTON OFFICE MARKET
Colliers International Statistics
Revenues: $1.5 Billion
Countries: 61
Offices: 512
Professionals & Staff: 12,509
Brokers: 4,387
Square Feet Managed: 979 Million*
Lease/Sale Transactions: 73,972
Total Transaction Value: $59.6 Billion
(Based on 2010 results.)
*The combination of Colliers International and FirstService results in 2.2
Billion under management (2nd largest in the world).
COLLIERS INTERNATIONAL | HOUSTON
1300 Post Oak Boulevard
Suite 200
Houston, Texas 77056
Main +1 713 222 2111
Accelerating success.
COLLIERS INTERNATIONAL | P. 8