SlideShare a Scribd company logo
1 of 7
Evapotranspiration
Review Of Current Chapter

25” of PET annually (approx. 83% of annual ppt)

35” of Evaporation annually (UM value)

Growing Season:
     Operating deficit of 8.9” (2.7” PET + 6.2” EC)
TREND ANALYSIS
EVAPOTRANSPIRATION
                                                                            Thornthwaite


Excess has                             18
                                       16
                                                                                                                 y = -0.5259x + 9.0047
decreased over                         14


                  Excess Precip (in)
                                       12

the past decade                        10
                                       8
                                       6
                                       4
                                       2
                                       0
                                       -2
                                            2000       2001     2002    2003     2004       2005      2006     2007       2008   2009
                                                                                         Year
                                                   Yearly Thornthwaite Excess                      Period of Record Avg
                                                   Linear (Yearly Thornthwaite Excess)
TREND ANALYSIS
EVAPORATION
                                                                      Evaporation Coefficient


Evaporation                             8
                                        6
                                                                                                             y = -0.5259x - 1.2353
excess has                              4


                  Excess Precip (in)
                                        2

decreased over                          0
                                        -2
                                        -4
the past decade                         -6
                                        -8
                                       -10
                                       -12
                                             2000      2001    2002     2003   2004     2005      2006   2007     2008    2009
                                                                                    Year

                                                    Yearly Excess          Period of Record Avg          Linear (Yearly Excess)
Implications

Coefficients for the District are “published”
values but should be monitored


Excess precipitation is dependent on volume of
precipitation received
Expectations
Less Excess Precipitation
         = Less Natural Recharge


Less Excess Precipitation
         = Losing Lakes and Wetlands
Questions?


 Thank You


 Coon Creek Watershed District

More Related Content

More from Coon Creek Watershed District

More from Coon Creek Watershed District (20)

Crooked lake public input workshop
Crooked lake public input  workshopCrooked lake public input  workshop
Crooked lake public input workshop
 
2013 winter meeting crooked lake management plan
2013 winter meeting crooked lake management plan2013 winter meeting crooked lake management plan
2013 winter meeting crooked lake management plan
 
Obstr hearing only
Obstr hearing onlyObstr hearing only
Obstr hearing only
 
Crooked lake plot study 2011
Crooked lake plot study 2011Crooked lake plot study 2011
Crooked lake plot study 2011
 
Z claa2011 fall meeting planupdatev 2.0
Z claa2011 fall meeting planupdatev 2.0Z claa2011 fall meeting planupdatev 2.0
Z claa2011 fall meeting planupdatev 2.0
 
Rolling meadows ccwd general presentation
Rolling meadows ccwd general presentationRolling meadows ccwd general presentation
Rolling meadows ccwd general presentation
 
Ccwd nsc pervious pavement- for meca
Ccwd nsc pervious pavement- for mecaCcwd nsc pervious pavement- for meca
Ccwd nsc pervious pavement- for meca
 
2011 Crooked Lake Plant Study
2011 Crooked Lake Plant Study2011 Crooked Lake Plant Study
2011 Crooked Lake Plant Study
 
2011 Winter Meeting Lake Comp Plan update
2011 Winter Meeting Lake Comp Plan update2011 Winter Meeting Lake Comp Plan update
2011 Winter Meeting Lake Comp Plan update
 
7 14-2010 cp resource assessment
7 14-2010 cp resource assessment7 14-2010 cp resource assessment
7 14-2010 cp resource assessment
 
Comp Plan 2020 Public Input Summary
Comp Plan 2020 Public Input SummaryComp Plan 2020 Public Input Summary
Comp Plan 2020 Public Input Summary
 
#13 - Comp Plan - Trends & Implications -continued
#13 - Comp Plan - Trends & Implications -continued#13 - Comp Plan - Trends & Implications -continued
#13 - Comp Plan - Trends & Implications -continued
 
#12 - Comp Plan - Trends & Implications
#12 - Comp Plan - Trends & Implications#12 - Comp Plan - Trends & Implications
#12 - Comp Plan - Trends & Implications
 
#11 - Comp Plan - Wetland Management
#11 - Comp Plan - Wetland Management#11 - Comp Plan - Wetland Management
#11 - Comp Plan - Wetland Management
 
#10 - Comp Plan - Wildlife Management
#10 - Comp Plan - Wildlife Management#10 - Comp Plan - Wildlife Management
#10 - Comp Plan - Wildlife Management
 
#9 Comp Plan Mission & Commitments Review
#9 Comp Plan  Mission & Commitments Review #9 Comp Plan  Mission & Commitments Review
#9 Comp Plan Mission & Commitments Review
 
#8- Comp Plan - Water Quality
#8- Comp Plan - Water Quality#8- Comp Plan - Water Quality
#8- Comp Plan - Water Quality
 
#7 - Comp Plan - Lakes
#7 - Comp Plan - Lakes#7 - Comp Plan - Lakes
#7 - Comp Plan - Lakes
 
#6 - Comp Plan - Surface Water
#6 - Comp Plan - Surface Water#6 - Comp Plan - Surface Water
#6 - Comp Plan - Surface Water
 
#2- Comp Plan - Issues input
#2- Comp Plan - Issues input#2- Comp Plan - Issues input
#2- Comp Plan - Issues input
 

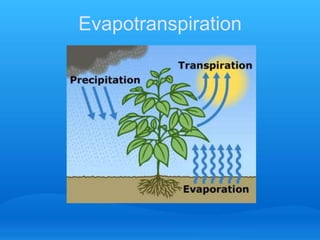
#4- Comp Plan - Evaporation & Evapotranspiration

  • 2. Review Of Current Chapter 25” of PET annually (approx. 83% of annual ppt) 35” of Evaporation annually (UM value) Growing Season: Operating deficit of 8.9” (2.7” PET + 6.2” EC)
  • 3. TREND ANALYSIS EVAPOTRANSPIRATION Thornthwaite Excess has 18 16 y = -0.5259x + 9.0047 decreased over 14 Excess Precip (in) 12 the past decade 10 8 6 4 2 0 -2 2000 2001 2002 2003 2004 2005 2006 2007 2008 2009 Year Yearly Thornthwaite Excess Period of Record Avg Linear (Yearly Thornthwaite Excess)
  • 4. TREND ANALYSIS EVAPORATION Evaporation Coefficient Evaporation 8 6 y = -0.5259x - 1.2353 excess has 4 Excess Precip (in) 2 decreased over 0 -2 -4 the past decade -6 -8 -10 -12 2000 2001 2002 2003 2004 2005 2006 2007 2008 2009 Year Yearly Excess Period of Record Avg Linear (Yearly Excess)
  • 5. Implications Coefficients for the District are “published” values but should be monitored Excess precipitation is dependent on volume of precipitation received
  • 6. Expectations Less Excess Precipitation = Less Natural Recharge Less Excess Precipitation = Losing Lakes and Wetlands
  • 7. Questions? Thank You Coon Creek Watershed District