1. MULTIFAMILY INVESTMENT TrendS
Greater Columbus Region
www.colliers.com/ohio
Slow Start to 2013, But Buyer Demand
Accelerating
ApARTMENT Sales MARKET OVERVIEW
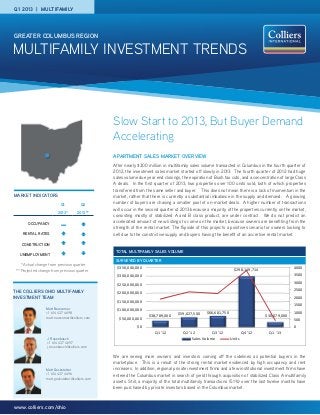
After nearly $300 million in multifamily sales volume transacted in Columbus in the fourth quarter of
2012, the investment sales market started off slowly in 2013. The fourth quarter of 2012 had huge
sales volume due year end closings, the expiration of Bush tax cuts, and a concentration of large Class
A deals. In the first quarter of 2013, two properties over 100 units sold; both of which properties
transferred from the same seller and buyer. This does not mean there is a lack of momentum in the
market, rather that there is currently a substantial imbalance in the supply and demand. A growing
number of buyers are chasing a smaller pool of on-market deals. A higher number of transactions
will occur in the second quarter of 2013 because a majority of the properties currently on the market,
consisting mostly of stabilized A and B class product, are under contract. We do not predict an
accelerated amount of new listings to come on the market, because owners are benefiting from the
strength of the rental market. The flipside of this projects a positive scenario for owners looking to
sell due to the constrictive supply and buyers having the benefit of an accretive rental market.
Q1 2013 | MULTIFAMILY
Total MultiFamily Sales Volume
SURVEYED BY Quarter
$38,789,000 $59,027,500 $66,681,750
$298,149,714
$30,079,000
0
500
1000
1500
2000
2500
3000
3500
4000
$0
$50,000,000
$100,000,000
$150,000,000
$200,000,000
$250,000,000
$300,000,000
$350,000,000
Q1 '12 Q2 '12 Q3 '12 Q4 '12 Q1 '13
Sales Volume Units
THE COLLIERS OHIO MULTIFAMILY
INVESTMENT TEAM
Matt Gockstetter
+1 614 437 4496
matt.gockstetter@colliers.com
J Rosenbusch
+1 614 437 4697
j.rosenbusch@colliers.com
Matt Newcomer
+1 614 437 4698
matt.newcomer@colliers.com
Market indicators
Q1
2013*
Q2
2013**
OCCUPANCY
RENTAL RATES
CONSTRUCTION
UNEMPLOYMENT — —
*Actual change from previous quarter
** Projected change from previous quarter
We are seeing more owners and investors coming off the sidelines as potential buyers in the
marketplace. This is a result of the strong rental market evidenced by high occupancy and rent
increases. In addition, regional private investment firms and a few institutional investment firms have
entered the Columbus market in search of yield through acquisition of stabilized Class A multifamily
assets. Still, a majority of the total multifamily transactions (51%) over the last twelve months have
been purchased by private investors based in the Columbus market.
2. ApARTMENT SAles MARKET OVERVIEW
(CONTINUED)
Buyers’ demand in the Columbus marketplace has been
strongest for stabilized Class A and B properties. The handful
of properties on the market during the first quarter in this
property class garnered a large amount of interest and strong
marketing activity from prospective buyers both locally and
regionally. Buyers are expecting to find value in these
properties by pushing revenue, which is achievable in the
current rental environment, or through improved management
efficiencies. This rush to Class A and B properties is also
fueled by attainable non-recourse debt with historically low
interest rates. This causes cap rate compression, and in turn
Capital Markets
SIgnificant Loan Issuances
522 offices in
62 countries on
6 continents
United States: 147
Canada: 37
Latin America: 19
Asia Pacific: 201
EMEA: 118
• $1.8 billion in annual revenue
• 1.25 billion square feet under
management
• Over 12,300 professionals
Accelerating success.
This document/email has been prepared by Colliers
International for advertising purposes. Colliers
International statistics and data are audited annually and
may result in revisions to previously reported quarterly
and final year-end figures. Sources include Columbus
Dispatch, Business First, Xceligent, CoStar, Bureau of
Labor Statistics, Bureau of Economic Analysis, Gallup
and the Cleveland Federal Reserve.
IN CONTRACT
Name Date Units Year Built Occupancy Type AMount
Tall Oaks 1/17/13 160 1972 91% Fannie Refinance $3,500,000
Lakeview Square 1/22/13 470 1986 91% Fannie Refinance $19,500,000
The Elms 1/31/13 304 1976 97% Fannie Refinance $11,000,000
Waterstone Landing 3/8/13 56 2012 95% Fannie Refinance $4,800,000
Buyer Profiles
Trailing 12 Months
Types Q1 2013
Local Private Investor 51%
Regional Investment Firm 24%
National Private Investor 7%
National Investment Firm 9%
Institutional/REIT 9%
improves pricing for owners looking to sell. For this reason, owners of well located, Class A and B
multifamily product should reexamine the disposition value of their properties to capitalize on buyers’
increasingly aggressive pricing and the overall supply and demand imbalance in the Columbus market.
The amount of distressed property acquisition opportunities in the marketplace has greatly diminished
because banks have shaken out a majority of their bad assets by this point. We are seeing a fair amount
of properties that were bought distressed between 2009 and 2012 returning to stabilized levels. A major-
ity of those distressed properties had significant deferred maintenance that needed addressed for both
exterior and interior items, and their respective new owner’s capital infusion for renovations has helped to
attract new tenants and improve occupancy. As these value add projects stabilize, owners will be placing
permanent financing to amplify cash flow or look to sell.
Source: US Census Bureau Data
196
241
389
35
430
88 104
256
569
131
828
284
0
100
200
300
400
500
600
700
800
900
Trailing 12 Month Building Permits: 5+ Unit Multifamily
Franklin County
Source: Fannie Mae Data
COLLIERS OHIO
MULTIFAMILY 2012
PERFORMANCE RESULTS:
• 1,171 Total Units Sold
• 10 Multifamily Products
Sold In Columbus, Ohio
TRAILING 8 YEAR
TEAM SALES HISTORY:
• 12,284 Units Sold
• A Total Sales Volume of
$300,000,000+
• 97 Transactions
Completed
p. 2 | Colliers International
research & forecast report | Q1 2013 | MULTIFAMILY | Greater Columbus Region