Marriage Marijuana Crosstabs
•
0 gefällt mir•347 views

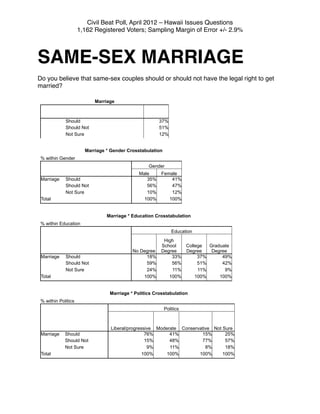
The Civil Beat Poll crosstabs and results for questions about same-sex marriage and marijuana legalizations. April 2012.

Empfohlen
Empfohlen
Weitere ähnliche Inhalte
Was ist angesagt?
Was ist angesagt? (7)
Andere mochten auch
Ähnlich wie Marriage Marijuana Crosstabs
Ähnlich wie Marriage Marijuana Crosstabs (20)
Mehr von Honolulu Civil Beat
Mehr von Honolulu Civil Beat (20)
Kürzlich hochgeladen
Kürzlich hochgeladen (20)
Marriage Marijuana Crosstabs
- 1. Civil Beat Poll, April 2012 – Hawaii Issues Questions 1,162 Registered Voters; Sampling Margin of Error +/- 2.9% SAME-SEX MARRIAGE Do you believe that same-sex couples should or should not have the legal right to get married? Marriage Should 37% Should Not 51% Not Sure 12% Marriage * Gender Crosstabulation % within Gender Gender Male Female Marriage Should 35% 41% Should Not 56% 47% Not Sure 10% 12% Total 100% 100% Marriage * Education Crosstabulation % within Education Education High School College Graduate No Degree Degree Degree Degree Marriage Should 18% 33% 37% 49% Should Not 59% 56% 51% 42% Not Sure 24% 11% 11% 9% Total 100% 100% 100% 100% Marriage * Politics Crosstabulation % within Politics Politics Liberal/progressive Moderate Conservative Not Sure Marriage Should 76% 41% 15% 25% Should Not 15% 48% 77% 57% Not Sure 9% 11% 8% 18% Total 100% 100% 100% 100%
- 2. Civil Beat Poll, April 2012 – Hawaii Issues Questions 1,162 Registered Voters; Sampling Margin of Error +/- 2.9% Marriage * Ethnicity Crosstabulation % within Ethnicity Ethnicity Hispanic/ Caucasian Japanese Filipino Hawaiian Chinese Latino Other/Mixed Marriage Should 44% 43% 19% 33% 21% 57% 39% Should Not 50% 40% 68% 60% 62% 36% 44% Not Sure 6% 17% 13% 8% 17% 7% 17% Total 100% 100% 100% 100% 100% 100% 100% Marriage * Party Crosstabulation % within Party Party Democrat Republican Independent Not Sure Marriage Should 53% 18% 37% 20% Should Not 37% 77% 52% 60% Not Sure 10% 6% 12% 21% Total 100% 100% 100% 100% Marriage * Income Crosstabulation % within Income Income $50,000 or $50,000- $100,000 less $100,000 or more Marriage Should 36% 36% 49% Should Not 50% 55% 42% Not Sure 14% 8% 10% Total 100% 100% 100% Marriage * Military_Family Crosstabulation % within Military_Family Military_Family Should Should Not Marriage Should 36% 39% Should Not 56% 50% Not Sure 8% 11% Total 100% 100%
- 3. Civil Beat Poll, April 2012 – Hawaii Issues Questions 1,162 Registered Voters; Sampling Margin of Error +/- 2.9% Marriage * County Crosstabulation % within County County Oahu Hawaii Maui Kauai Marriage Should 36% 40% 46% 30% Should Not 52% 49% 43% 50% Not Sure 12% 11% 11% 20% Total 100% 100% 100% 100% Marriage * Age Crosstabulation % within Age Age 18-49 50-64 65+ Marriage Yes 50% 40% 35% No 43% 48% 54% Not Sure 8% 12% 11% Total 100% 100% 100%
- 4. Civil Beat Poll, April 2012 – Hawaii Issues Questions 1,162 Registered Voters; Sampling Margin of Error +/- 2.9% MARIJUANA Do you think that Hawaii should make it legal to possess and use of small amounts of marijuana? Marijuana Support 34% Oppose 57% Not Sure 10% Marijuana * Gender Crosstabulation % within Gender Gender Male Female Marijuana Support 41% 29% Oppose 51% 61% Not Sure 8% 9% Total 100% 100% Marijuana * Education Crosstabulation % within Education Education High School College Graduate No Degree Degree Degree Degree Marijuana Support 29% 35% 31% 41% Oppose 56% 56% 60% 54% Not Sure 15% 9% 8% 6% Total 100% 100% 100% 100% Marijuana * Politics Crosstabulation % within Politics Politics Liberal/progressive Moderate Conservative Not Sure Marijuana Support 57% 39% 17% 27% Oppose 37% 53% 76% 58% Not Sure 6% 8% 7% 15% Total 100% 100% 100% 100%
- 5. Civil Beat Poll, April 2012 – Hawaii Issues Questions 1,162 Registered Voters; Sampling Margin of Error +/- 2.9% Marijuana * Ethnicity Crosstabulation % within Ethnicity Ethnicity Hispanic/ Caucasian Japanese Filipino Hawaiian Chinese Latino Other/Mixed Marijuana Support 45% 28% 16% 38% 15% 46% 29% Oppose 49% 66% 75% 51% 71% 46% 58% Not Sure 7% 6% 9% 11% 13% 8% 13% Total 100% 100% 100% 100% 100% 100% 100% Marijuana * Party Crosstabulation % within Party Party Democrat Republican Independent Not Sure Marijuana Support 42% 18% 41% 23% Oppose 51% 73% 53% 55% Not Sure 7% 9% 6% 22% Total 100% 100% 100% 100% Marijuana * Income Crosstabulation % within Income Income $50,000 or $50,000- $100,000 less $100,000 or more Marijuana Support 35% 34% 40% Oppose 55% 57% 54% Not Sure 10% 8% 6% Total 100% 100% 100% Marijuana * Military_Family Crosstabulation % within Military_Family Military_Family Yes No Marijuana Support 27% 37% Oppose 61% 55% Not Sure 12% 8% Total 100% 100%
- 6. Civil Beat Poll, April 2012 – Hawaii Issues Questions 1,162 Registered Voters; Sampling Margin of Error +/- 2.9% Marijuana * County Crosstabulation % within County County Oahu Hawaii Maui Kauai Marijuana Support 30% 47% 51% 30% Oppose 60% 47% 41% 64% Not Sure 11% 6% 8% 7% Total 100% 100% 100% 100% Marijuana * Age Crosstabulation % within Age Age 18-49 50-64 65+ Marijuana Support 44% 42% 29% Oppose 42% 51% 64% Not Sure 14% 7% 8% Total 100% 100% 100%