1. INVESTMENT MARKET REPORT
HAWAII MID-YEAR 2014
www.colliers.com/honolulu
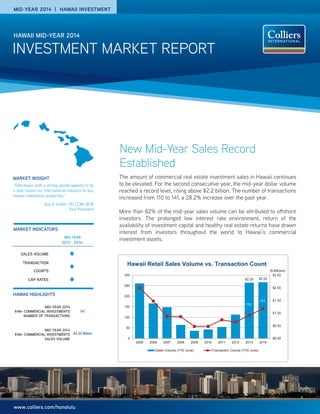
The amount of commercial real estate investment sales in Hawaii continues
to be elevated. For the second consecutive year, the mid-year dollar volume
reached a record level, rising above $2.2 billion. The number of transactions
increased from 110 to 141, a 28.2% increase over the past year.
More than 82% of the mid-year sales volume can be attributed to offshore
investors. The prolonged low interest rate environment, return of the
availability of investment capital and healthy real estate returns have drawn
interest from investors throughout the world to Hawaii’s commercial
investment assets.
MARKET INDICATORS
HAWAII HIGHLIGHTS
2013 - 2014
SALES VOLUME
TRANSACTION
COUNTS
CAP RATES
MID-YEAR 2014 | HAWAII INVESTMENT
MID-YEAR
MID-YEAR 2014
$1M+ COMMERCIAL INVESTMENTS
NUMBER OF TRANSACTIONS
141
MID-YEAR 2014
$1M+ COMMERCIAL INVESTMENTS
SALES VOLUME
$2.22 Billion
“Safe haven with a strong upside appears to be
a new reason for international investors to buy
Hawaii investment properties.”
- Guy V. Kidder (B) CCIM SIOR
Vice President
MARKET INSIGHT
$2.20 $2.22
110
141
$0.00
$0.50
$1.00
$1.50
$2.00
$2.50
0
50
100
150
200
250
300
2005 2006 2007 2008 2009 2010 2011 2012 2013 2014
Sales Volume (YTD June) Transaction Counts (YTD June)
Hawaii Retail Sales Volume vs. Transaction Count
($ Billions)
New Mid-Year Sales Record
Established
4. P. 4 | COLLIERS INTERNATIONAL
RESEARCH & FORECAST REPORT | MID-YEAR 2014 | HAWAII | INVESTMENT
Not Out of the Woods… Yet
Real Capital Analytics, a firm that monitors commercial
real estate transactions over $2.5 million in sales price,
pegs the U.S. year-to-date June investment sales volume
at $184.1 billion. Year-end 2014 sales volume is projected
at $450 billion, a 25% jump over the year-end 2013 sales
volume of $361 billion.
The strengthened investor demand combined with low
interest rates has drawn increased lender interest. Last
year, the boost in commercial real estate loan origination
was primarily due to the loan placement by Commercial
Mortgage Backed Securities (“CMBS”) lenders. For 2014,
CMBS loan origination has slowed, but other lenders are
being drawn to the healthy risk adjusted returns from
mortgages. According to Mortgage Bankers Association,
life insurance companies and banks have posted healthy
jumps in commercial real estate loans of 18% and 55%,
respectively.
The Federal Reserve Board, which had cut short-term
interest rates to near zero, is now faced with a tough
balancing act. Inflationary risks are increasing with the
steady improvement of the U.S. economy. A way to
dampen inflation has been to increase interest rates.
Unfortunately, a sharp rise in interest rates would likely
correspond to a boost in commercial real estate loan
defaults. A 150 basis point increase to interest rates on
mortgaged properties with a debt service coverage ratio
of 1.2 is projected to result in a 6.7% to 15.7% jump in
problem loans for CMBS mortgagees. Trepp, a CMBS
market monitoring service, estimated that nearly $330
billion in CMBS loan maturities can be expected by 2017.
This surge in maturing loans is likely to create a difficult
challenge for borrowers seeking to refinance should
interest rates increase.
The Federal Reserve is anticipated to reduce its bond
buying economic stimulus package from a current $35
billion per month to zero by Fall 2014. Should the
economy continue to post positive gains, it is highly likely
that the Federal Reserve will begin raising interest rates.
In a Reuters’ survey of economists, the median outlook
anticipates that the first interest rate increase will likely
begin by the second quarter 2015. The Federal Reserve
could react sooner should inflationary fears become
more widespread, but most economists believe that they
will allow considerable time to elapse between the end of
its bond buying program and an increase to interest
rates.
$574.7
$67.9
$360.6
$184.1
$0.0
$100.0
$200.0
$300.0
$400.0
$500.0
$600.0
$700.0
U.S. Transaction Volume
Source: Real Capital Analytics
($ Billions)
U.S. Chartered
Depository
Institutions:
$1,547.80;
48%
CMBS Issuers;
$705.80;
22%
Life Companies;
$342.30;
11%
GSE's; $238.90;
7%
Others; $398.30;
12%
Commercial Real Estate Loan Mortgage
Placement ($ Billions)
Source: Mortgage Bankers Association
$52.07
$77.85
$95.59
$166.50
$198.38
$228.56
$12.15
$2.74
$11.63
$32.71
$48.37
$86.14
$40.45
$0.00
$50.00
$100.00
$150.00
$200.00
$250.00
CMBS Issuance
Source: Commercial Mortgage Alert
7. RESEARCH & FORECAST REPORT | MID-YEAR 2014 | HAWAII | INVESTMENT
COLLIERS INTERNATIONAL | P. 7
Industrial Land SaleIndustrial Land Sale
Notable Colliers Transactions
*Bratton Realty Advisers, Ltd.
Haseko & Ocean View Center
820 Mililani Street, Hononlulu, Hawaii 96813 (Haseko)
707 Richards Street, Honolulu, Hawaii 96813 (Ocean View)
Sales Price: $22,750,000 (combined)
Tenure: Leasehold
Zoning: BMX4
Building SF: 184,000 SF (combined)
Buyer: 820 Mililani Holdings, LLC
Agents: Mark D. Bratton (R) CCIM*
Karen Birkett (S)
Brandon Bera (S)
Kapolei Business Park West & Kapolei Business Park Phase 2
Kapolei, Hawaii 96707
Sales Price: $84 Million
Tenure: Fee Simple
Zoning: I-2 Industrial Intensive
Land Area: 176.6 Acres
Agents: Scott L. Mitchell (B) SIOR
Guy V. Kidder (B) CCIM SIOR
Office Building SaleOffice Building Sale