Civil BeatJjanuary 2016 Ige-Caldwell Poll
•
0 gefällt mir•1,692 views

Survey of Hawaii voters on the governor and Honolulu's mayor.

Empfohlen
Weitere ähnliche Inhalte
Was ist angesagt?
Was ist angesagt? (20)
Ähnlich wie Civil BeatJjanuary 2016 Ige-Caldwell Poll
Ähnlich wie Civil BeatJjanuary 2016 Ige-Caldwell Poll (20)
Mehr von Honolulu Civil Beat
Mehr von Honolulu Civil Beat (20)
Kürzlich hochgeladen
Kürzlich hochgeladen (10)
Civil BeatJjanuary 2016 Ige-Caldwell Poll
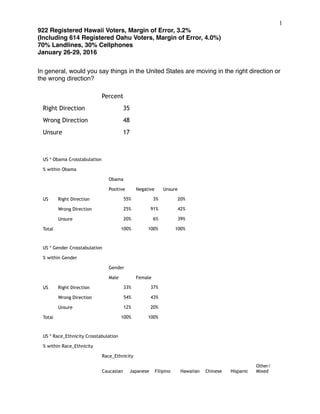
- 1. !1 922 Registered Hawaii Voters, Margin of Error, 3.2% (Including 614 Registered Oahu Voters, Margin of Error, 4.0%) 70% Landlines, 30% Cellphones January 26-29, 2016 In general, would you say things in the United States are moving in the right direction or the wrong direction? Percent Right Direction 35 Wrong Direction 48 Unsure 17 US * Obama Crosstabulation % within Obama Obama Positive Negative Unsure US Right Direction 55% 3% 20% Wrong Direction 25% 91% 42% Unsure 20% 6% 39% Total 100% 100% 100% US * Gender Crosstabulation % within Gender Gender Male Female US Right Direction 33% 37% Wrong Direction 54% 43% Unsure 12% 20% Total 100% 100% US * Race_Ethnicity Crosstabulation % within Race_Ethnicity Race_Ethnicity Caucasian Japanese Filipino Hawaiian Chinese Hispanic Other/ Mixed
- 2. !2 922 Registered Hawaii Voters, Margin of Error, 3.2% (Including 614 Registered Oahu Voters, Margin of Error, 4.0%) 70% Landlines, 30% Cellphones January 26-29, 2016 US Right Direction 38% 39% 23% 28% 29% 46% 34% Wrong Direction 51% 44% 45% 55% 41% 46% 55% Unsure 11% 17% 32% 17% 31% 9% 11% Tota l 100% 100% 100% 100% 100% 100% 100% US * Age_Group Crosstabulation % within Age_Group Age_Grou p Under 50 50 or older US Right Direction 33% 36% Wrong Direction 49% 49% Unsure 19% 15% Total 100% 100%
- 3. !3 922 Registered Hawaii Voters, Margin of Error, 3.2% (Including 614 Registered Oahu Voters, Margin of Error, 4.0%) 70% Landlines, 30% Cellphones January 26-29, 2016 US * County_CD Crosstabulation % within County_CD County_CD Oahu_1 Oahu_2 Hawaii Maui Kauai US Right Direction 33% 30% 44% 35% 38% Wrong Direction 48% 55% 45% 44% 45% Unsure 19% 15% 11% 21% 18% Total 100% 100% 100% 100% 100% US * Politics Crosstabulation % within Politics Politics Liberal Moderate Conservativ e Unsure US Right Direction 55% 46% 10% 23% Wrong Direction 32% 39% 81% 45% Unsure 14% 16% 10% 32% Total 100% 100% 100% 100% US * Party Crosstabulation % within Party Party Democrat Republica n Independen t Unsure US Right Direction 53% 13% 18% 19% Wrong Direction 29% 79% 65% 58% Unsure 19% 8% 18% 23% Total 100% 100% 100% 100% US * Income Crosstabulation % within Income
- 4. !4 922 Registered Hawaii Voters, Margin of Error, 3.2% (Including 614 Registered Oahu Voters, Margin of Error, 4.0%) 70% Landlines, 30% Cellphones January 26-29, 2016 Income Less than $50,000 $50,000- $100,000 More than $100,000 Refused US Right Direction 39% 35% 34% 29% Wrong Direction 40% 53% 57% 45% Unsure 21% 12% 9% 26% Total 100% 100% 100% 100%
- 5. !5 922 Registered Hawaii Voters, Margin of Error, 3.2% (Including 614 Registered Oahu Voters, Margin of Error, 4.0%) 70% Landlines, 30% Cellphones January 26-29, 2016 And how about in Hawaii? Would you say things in the state are moving in the right direction or the wrong direction? Percent Right Direction 33 Wrong Direction 50 Unsure 17 Hawaii * Ige Crosstabulation % within Ige Ige Positive Negative Unsure Hawaii Right Direction 63% 12% 21% Wrong Direction 25% 79% 48% Unsure 13% 9% 31% Total 100% 100% 100% Hawaii * Gender Crosstabulation % within Gender Gender Male Female Hawaii Right Direction 30% 37% Wrong Direction 53% 47% Unsure 17% 17% Total 100% 100% Hawaii * Race_Ethnicity Crosstabulation % within Race_Ethnicity
- 6. !6 922 Registered Hawaii Voters, Margin of Error, 3.2% (Including 614 Registered Oahu Voters, Margin of Error, 4.0%) 70% Landlines, 30% Cellphones January 26-29, 2016 Race_Ethnicity Caucasian Japanese Filipino Hawaiian Chinese Hispanic Other/ Mixed Hawai i Right Direction 34% 34% 27% 32% 34% 55% 33% Wrong Direction 49% 44% 58% 61% 48% 36% 55% Unsure 17% 23% 15% 7% 18% 9% 12% Total 100% 100% 100% 100% 100% 100% 100% Hawaii * Age_Group Crosstabulation % within Age_Group Age_Group Under 50 50 or older Hawai i Right Direction 30% 34% Wrong Direction 48% 51% Unsure 22% 15% Total 100% 100% Hawaii * County_CD Crosstabulation % within County_CD County_CD Oahu_1 Oahu_2 Hawaii Maui Kauai Hawai i Right Direction 29% 28% 40% 43% 42% Wrong Direction 53% 59% 48% 36% 36% Unsure 19% 13% 12% 21% 22% Total 100% 100% 100% 100% 100% Hawaii * Politics Crosstabulation % within Politics
- 7. !7 922 Registered Hawaii Voters, Margin of Error, 3.2% (Including 614 Registered Oahu Voters, Margin of Error, 4.0%) 70% Landlines, 30% Cellphones January 26-29, 2016 Politics Liberal Moderate Conservativ e Unsure Hawaii Right Direction 45% 41% 14% 28% Wrong Direction 37% 43% 73% 50% Unsure 18% 16% 13% 22% Total 100% 100% 100% 100% Hawaii * Party Crosstabulation % within Party Party Democrat Republica n Independen t Unsure Hawaii Right Direction 47% 22% 14% 25% Wrong Direction 35% 68% 65% 57% Unsure 18% 9% 20% 18% Total 100% 100% 100% 100% Hawaii * Income Crosstabulation % within Income Income Less than $50,000 $50,000- $100,000 More than $100,000 Refused Hawaii Right Direction 36% 32% 29% 36% Wrong Direction 42% 55% 55% 47% Unsure 22% 13% 16% 17% Total 100% 100% 100% 100%
- 8. !8 922 Registered Hawaii Voters, Margin of Error, 3.2% (Including 614 Registered Oahu Voters, Margin of Error, 4.0%) 70% Landlines, 30% Cellphones January 26-29, 2016 Do you generally have a positive opinion or negative opinion of President Barack Obama, or are you not sure? Percent Positive 57 Negative 33 Unsure 10 Obama * Gender Crosstabulation % within Gender Gender Male Female Obama Positive 51% 63% Negative 39% 28% Unsure 10% 10% Total 100% 100% Obama * Race_Ethnicity Crosstabulation % within Race_Ethnicity Race_Ethnicity Caucasian Japanese Filipino Hawaiian Chinese Hispanic Other/ Mixed Obama Positive 60% 58% 45% 61% 54% 64% 55% Negative 35% 34% 33% 30% 28% 36% 34% Unsure 5% 9% 22% 10% 18% 11% Total 100% 100% 100% 100% 100% 100% 100% Obama * Age_Group Crosstabulation % within Age_Group
- 9. !9 922 Registered Hawaii Voters, Margin of Error, 3.2% (Including 614 Registered Oahu Voters, Margin of Error, 4.0%) 70% Landlines, 30% Cellphones January 26-29, 2016 Age_Group Under 50 50 or older Obama Positive 59% 58% Negative 27% 35% Unsure 14% 7% Total 100% 100% Obama * County_CD Crosstabulation % within County_CD County_CD Oahu_1 Oahu_2 Hawaii Maui Kauai Obama Positive 55% 54% 63% 61% 63% Negative 36% 37% 25% 28% 29% Unsure 9% 10% 12% 11% 9% Total 100% 100% 100% 100% 100%
- 10. !10 922 Registered Hawaii Voters, Margin of Error, 3.2% (Including 614 Registered Oahu Voters, Margin of Error, 4.0%) 70% Landlines, 30% Cellphones January 26-29, 2016 Obama * Politics Crosstabulation % within Politics Politics Liberal Moderate Conservativ e Unsure Obama Positive 87% 64% 19% 59% Negative 7% 28% 76% 22% Unsure 6% 9% 6% 19% Total 100% 100% 100% 100% Obama * Party Crosstabulation % within Party Party Democrat Republica n Independen t Unsure Obama Positive 84% 19% 39% 32% Negative 7% 76% 51% 47% Unsure 9% 5% 10% 21% Total 100% 100% 100% 100% Obama * Income Crosstabulation % within Income Income Less than $50,000 $50,000- $100,000 More than $100,000 Refused Obama Positive 61% 59% 55% 52% Negative 27% 34% 42% 33% Unsure 12% 7% 3% 14% Total 100% 100% 100% 100%
- 11. !11 922 Registered Hawaii Voters, Margin of Error, 3.2% (Including 614 Registered Oahu Voters, Margin of Error, 4.0%) 70% Landlines, 30% Cellphones January 26-29, 2016 Do you generally have a positive opinion or negative opinion of Governor David Ige, or are you not sure? Percent Positive 36 Negative 33 Unsure 32 Ige * Gender Crosstabulation % within Gender Gender Male Female Ige Positive 32% 39% Negative 38% 28% Unsure 30% 33% Total 100% 100% Ige * Race_Ethnicity Crosstabulation % within Race_Ethnicity Race_Ethnicity Caucasian Japanese Filipino Hawaiian Chinese Hispanic Other/ Mixed Ige Positive 33% 44% 25% 31% 40% 55% 33% Negative 34% 28% 30% 51% 16% 36% 41% Unsure 32% 28% 45% 19% 44% 9% 27% Total 100% 100% 100% 100% 100% 100% 100% Ige * Age_Group Crosstabulation % within Age_Group
- 12. !12 922 Registered Hawaii Voters, Margin of Error, 3.2% (Including 614 Registered Oahu Voters, Margin of Error, 4.0%) 70% Landlines, 30% Cellphones January 26-29, 2016 Age_Grou p Under 50 50 or older Ige Positive 28% 39% Negative 35% 33% Unsure 36% 29% Total 100% 100% Ige * County_CD Crosstabulation % within County_CD County_CD Oahu_1 Oahu_2 Hawaii Maui Kauai Ige Positive 35% 35% 33% 42% 42% Negative 34% 33% 34% 31% 26% Unsure 32% 32% 33% 27% 33% Total 100% 100% 100% 100% 100%
- 13. !13 922 Registered Hawaii Voters, Margin of Error, 3.2% (Including 614 Registered Oahu Voters, Margin of Error, 4.0%) 70% Landlines, 30% Cellphones January 26-29, 2016 Ige * Politics Crosstabulation % within Politics Politics Liberal Moderate Conservativ e Unsure Ige Positive 41% 43% 23% 35% Negative 27% 28% 51% 25% Unsure 32% 28% 26% 40% Total 100% 100% 100% 100% Ige * Party Crosstabulation % within Party Party Democrat Republica n Independen t Unsure Ige Positive 47% 25% 25% 23% Negative 25% 47% 41% 29% Unsure 28% 28% 34% 48% Total 100% 100% 100% 100% Ige * Income Crosstabulation % within Income Income Less than $50,000 $50,000- $100,000 More than $100,000 Refused Ige Positive 38% 38% 26% 41% Negative 31% 34% 43% 26% Unsure 31% 29% 30% 33% Total 100% 100% 100% 100%
- 14. !14 922 Registered Hawaii Voters, Margin of Error, 3.2% (Including 614 Registered Oahu Voters, Margin of Error, 4.0%) 70% Landlines, 30% Cellphones January 26-29, 2016 Do you generally have a positive opinion or negative opinion of Honolulu Mayor Kirk Caldwell or are you not sure? Full state Oahu only Percent Positive 39 Negative 31 Unsure 30 Percent Positive 40 Negative 38 Unsure 22
- 15. !15 922 Registered Hawaii Voters, Margin of Error, 3.2% (Including 614 Registered Oahu Voters, Margin of Error, 4.0%) 70% Landlines, 30% Cellphones January 26-29, 2016 Full state Caldwell * Gender Crosstabulation % within Gender Gender Male Female Caldwell Positive 39% 40% Negative 37% 26% Unsure 24% 34% Total 100% 100% Caldwell * Race_Ethnicity Crosstabulation % within Race_Ethnicity Race_Ethnicity Caucasian Japanese Filipino Hawaiian Chinese Hispanic Other/ Mixed Caldwell Positive 36% 43% 33% 51% 42% 64% 36% Negative 30% 30% 29% 27% 44% 27% 32% Unsure 34% 27% 38% 22% 14% 9% 32% Total 100% 100% 100% 100% 100% 100% 100% Caldwell * Age_Group Crosstabulation % within Age_Group Age_Group Under 50 50 or older Caldwell Positive 28% 44% Negative 31% 32% Unsure 41% 24% Total 100% 100% Caldwell * County_CD Crosstabulation % within County_CD
- 16. !16 922 Registered Hawaii Voters, Margin of Error, 3.2% (Including 614 Registered Oahu Voters, Margin of Error, 4.0%) 70% Landlines, 30% Cellphones January 26-29, 2016 County_CD Oahu_1 Oahu_2 Hawaii Maui Kauai Caldwell Positive 40% 42% 34% 42% 36% Negative 38% 39% 14% 20% 18% Unsure 22% 20% 52% 39% 46% Total 100% 100% 100% 100% 100% Caldwell * Politics Crosstabulation % within Politics Politics Liberal Moderate Conservativ e Unsure Caldwell Positive 38% 51% 35% 27% Negative 29% 23% 44% 29% Unsure 34% 25% 22% 44% Total 100% 100% 100% 100%
- 17. !17 922 Registered Hawaii Voters, Margin of Error, 3.2% (Including 614 Registered Oahu Voters, Margin of Error, 4.0%) 70% Landlines, 30% Cellphones January 26-29, 2016 Caldwell * Party Crosstabulation % within Party Party Democrat Republica n Independen t Unsure Caldwell Positive 45% 38% 32% 23% Negative 23% 37% 46% 29% Unsure 32% 25% 22% 48% Total 100% 100% 100% 100% Caldwell * Income Crosstabulation % within Income Income Less than $50,000 $50,000- $100,000 More than $100,000 Refused Caldwel l Positive 40% 41% 42% 31% Negative 27% 33% 32% 30% Unsure 33% 26% 26% 39% Total 100% 100% 100% 100%
- 18. !18 922 Registered Hawaii Voters, Margin of Error, 3.2% (Including 614 Registered Oahu Voters, Margin of Error, 4.0%) 70% Landlines, 30% Cellphones January 26-29, 2016 Demographics Gender Age Group Race/Ethnicity Percent Male 48 Female 52 Percent Under 50 27 50 or older 73 Percent Caucasian 37 Japanese 28 Filipino 9 Hawaiian 10 Chinese 6 Hispanic 1 Other/Mixed 10
- 19. !19 922 Registered Hawaii Voters, Margin of Error, 3.2% (Including 614 Registered Oahu Voters, Margin of Error, 4.0%) 70% Landlines, 30% Cellphones January 26-29, 2016 Political Ideology Party I.D. Household Income Percent Liberal 25 Moderate 34 Conservative 25 Unsure 17 Percent Democrat 52 Republican 21 Independent 22 Unsure 6 Percent Less than $50,000 27 $50,000-$100,000 33 More than $100,000 22 Refused 19