Civil beat january 2012 u.s. senate primary toplines and crosstabs
•Download as PAGES, PDF•
1 like•570 views

Civil Beat Poll conduct

Recommended
Recommended
More Related Content
What's hot
What's hot (8)
Viewers also liked
Similar to Civil beat january 2012 u.s. senate primary toplines and crosstabs
Similar to Civil beat january 2012 u.s. senate primary toplines and crosstabs (10)
More from Honolulu Civil Beat
More from Honolulu Civil Beat (20)
Recently uploaded
Recently uploaded (20)
Civil beat january 2012 u.s. senate primary toplines and crosstabs
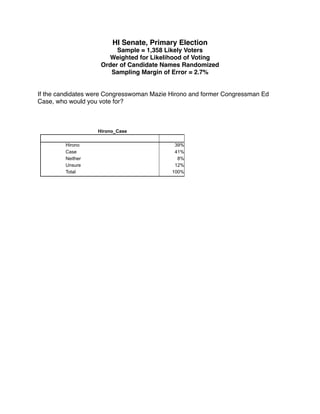
- 1. HI Senate, Primary Election Sample = 1,358 Likely Voters Weighted for Likelihood of Voting Order of Candidate Names Randomized Sampling Margin of Error = 2.7% If the candidates were Congresswoman Mazie Hirono and former Congressman Ed Case, who would you vote for? Hirono_Case Hirono 39% Case 41% Neither 8% Unsure 12% Total 100%
- 2. Hirono_Case * Gender Crosstabulation % within Gender Gender Male Female Hirono_Case Hirono 36% 41% Case 46% 38% Neither 8% 7% Unsure 10% 14% Total 100% 100% * Gender * Hirono_Case Crosstabulation % within Hirono_Case Hirono_Case Hirono Case Neither Unsure Gender Male 41% 48% 48% 35% Female 59% 52% 52% 65% Total 100% 100% 100% 100% Hirono_Case * Age Crosstabulation % within Age Age 18-34 35-49 50-64 65+ Hirono_Case Hirono 26% 35% 41% 42% Case 54% 42% 38% 42% Neither 10% 9% 8% 6% Unsure 10% 14% 13% 10% Total 100% 100% 100% 100% * Age * Hirono_Case Crosstabulation % within Hirono_Case Hirono_Case Hirono Case Neither Unsure Age 18-34 6% 11% 11% 7% 35-49 14% 16% 20% 19% 50-64 40% 35% 39% 42% 65+ 39% 37% 30% 32% Total 100% 100% 100% 100%
- 3. Hirono_Case * Party Crosstabulation % within Party Party Democrat Republican Independent Unsure Hirono_Case Hirono 51% 19% 36% 27% Case 34% 55% 47% 31% Neither 3% 16% 7% 16% Unsure 12% 10% 9% 27% Total 100% 100% 100% 100% * Party * Hirono_Case Crosstabulation % within Hirono_Case Hirono_Case Hirono Case Neither Unsure Party Democrat 54% 33% 14% 42% Republican 8% 20% 32% 12% Independent 33% 40% 35% 26% Unsure 6% 7% 19% 20% Total 100% 100% 100% 100%
- 4. Hirono_Case * Race_Ethnicity Crosstabulation % within Race_Ethnicity Race_Ethnicity Caucasian Japanese Filipino Hawaiian Chinese Other/Mixed Hirono_Case Hirono 34% 47% 44% 54% 20% 33% Case 48% 36% 29% 30% 63% 38% Neither 8% 5% 9% 6% 8% 12% Unsure 10% 13% 17% 10% 9% 17% Total 100% 100% 100% 100% 100% 100% * Race_Ethnicity * Hirono_Case Crosstabulation % within Hirono_Case Hirono_Case Hirono Case Neither Unsure Race_Ethnicity Caucasian 35% 47% 41% 34% Japanese 28% 20% 14% 24% Filipino 9% 5% 9% 11% Hawaiian 14% 7% 8% 8% Chinese 3% 9% 6% 4% Other/Mixed 11% 12% 21% 19% Total 100% 100% 100% 100% Hirono_Case * Public_Employee Crosstabulation % within Public_Employee Public_Employee Yes No Hirono_Case Hirono 49% 37% Case 34% 43% Neither 4% 8% Unsure 12% 12% Total 100% 100%
- 5. Hirono_Case * Education Crosstabulation % within Education Education HS College Grad No degree graduate Graduate Degree Hirono_Case Hirono 30% 39% 36% 44% Case 37% 38% 43% 47% Neither 12% 10% 8% 3% Unsure 21% 13% 13% 6% Total 100% 100% 100% 100% * Education * Hirono_Case Crosstabulation % within Hirono_Case Hirono_Case Hirono Case Neither Unsure Education No degree 3% 3% 5% 6% HS graduate 36% 33% 49% 39% College Graduate 35% 38% 38% 43% Grad Degree 26% 26% 8% 13% Total 100% 100% 100% 100% Hirono_Case * Income Crosstabulation % within Income Income 50k or less 50-100k 100k+ Hirono_Case Hirono 42% 35% 38% Case 36% 43% 54% Neither 9% 8% 3% Unsure 13% 13% 6% Total 100% 100% 100% * Income * Hirono_Case Crosstabulation % within Hirono_Case Hirono_Case Hirono Case Neither Unsure Income 50k or less 45% 35% 48% 45% 50-100k 35% 39% 44% 44% 100k+ 20% 26% 8% 10% Total 100% 100% 100% 100%
- 6. Hirono_Case * County Crosstabulation % within County County Oahu Maui Hawaii Kauai Hirono_Case Hirono 35% 46% 49% 42% Case 46% 30% 31% 30% Neither 7% 5% 10% 6% Unsure 11% 19% 10% 22% Total 100% 100% 100% 100% * County * Hirono_Case Crosstabulation % within Hirono_Case Hirono_Case Hirono Case Neither Unsure County Oahu 63% 78% 69% 62% Maui 11% 7% 6% 15% Hawaii 19% 11% 21% 13% Kauai 6% 4% 5% 10% Total 100% 100% 100% 100% Hirono_Case * Congressional District Crosstabulation % within Congressional District Congressional District 1 2 Hirono_Case Hirono 34% 43% Case 46% 38% Neither 8% 7% Unsure 13% 12% Total 100% 100% * Congressional District * Hirono_Case Crosstabulation % within Hirono_Case Hirono_Case Hirono Case Neither Unsure Congressional 1 37% 47% 46% 45% District 2 63% 53% 54% 55% Total 100% 100% 100% 100%
- 7. Hirono_Case * County_CD Crosstabulation % within County_CD County_CD Oahu CD1 Oahu CD2 Maui Hawaii Kauai Hirono_Case Hirono 34% 39% 46% 49% 42% Case 46% 47% 30% 31% 30% Neither 8% 6% 5% 10% 6% Unsure 13% 8% 19% 10% 22% Total 100% 100% 100% 100% 100% * County_CD * Hirono_Case Crosstabulation % within Hirono_Case Hirono_Case Hirono Case Neither Unsure County_CD Oahu CD1 37% 47% 46% 45% Oahu CD2 26% 31% 23% 17% Maui 11% 7% 6% 15% Hawaii 19% 11% 21% 13% Kauai 6% 4% 5% 10% Total 100% 100% 100% 100%
- 8. Hirono_Case * Obama Crosstabulation % within Obama Obama Approve Approve Disapprove Disapprove strongly somewhat somewhat strongly Unsure Hirono_Case Hirono 54% 42% 21% 6% 27% Case 33% 39% 50% 72% 7% Neither 3% 6% 14% 19% 7% Unsure 11% 13% 15% 3% 58% Total 100% 100% 100% 100% 100% Obama * Hirono_Case Crosstabulation % within Hirono_Case Hirono_Case Hirono Case Neither Unsure Obama Approve strongly 61% 35% 15% 38% Approve somewhat 29% 25% 22% 28% Disapprove somewhat 5% 11% 17% 11% Disapprove strongly 3% 28% 42% 4% Unsure 3% 1% 4% 19% Total 100% 100% 100% 100%
- 9. Lingle_Case * Hirono_Case Crosstabulation % within Hirono_Case Hirono_Case Hirono Case Neither Unsure Lingle_Case Case 53% 58% 3% 43% Lingle 20% 40% 81% 13% Neither 23% 1% 15% 2% Unsure 5% 2% 1% 42% Total 100% 100% 100% 100% Lingle_Hirono * Hirono_Case Crosstabulation % within Hirono_Case Hirono_Case Hirono Case Neither Unsure Lingle_Hirono Hirono 86% 27% 6% 44% Lingle 12% 59% 82% 14% Neither 1% 9% 9% 2% Unsure 1% 4% 3% 40% Total 100% 100% 100% 100%
- 10. * Party * Age Crosstabulation % within Age Age 18-34 35-49 50-64 65+ Party Democrat 51% 35% 39% 41% Republican 13% 16% 14% 17% Independent 22% 39% 38% 34% Unsure 13% 10% 9% 7% Total 100% 100% 100% 100%