Cb february 2014 honolulu pdf
•
1 gefällt mir•1,792 views

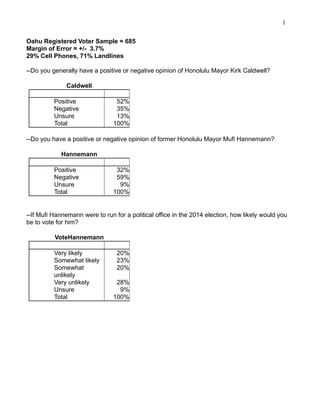
A survey of 685 registered voters on Oahu found that 52% had a positive opinion of Honolulu Mayor Kirk Caldwell while 35% had a negative opinion. Only 32% had a positive opinion of former mayor Mufi Hannemann, while 59% had a negative opinion. 20% said they would be very likely to vote for Hannemann if he ran for office again, while 28% said they would be very unlikely. The survey also found differences in opinions across demographic groups.

Empfohlen
Empfohlen
Weitere ähnliche Inhalte
Was ist angesagt?
Was ist angesagt? (20)
Ähnlich wie Cb february 2014 honolulu pdf
Ähnlich wie Cb february 2014 honolulu pdf (20)
Mehr von Honolulu Civil Beat
Mehr von Honolulu Civil Beat (20)
Cb february 2014 honolulu pdf
- 1. 1 Oahu Registered Voter Sample = 685 Margin of Error = +/- 3.7% 29% Cell Phones, 71% Landlines --Do you generally have a positive or negative opinion of Honolulu Mayor Kirk Caldwell? Caldwell Positive Negative Unsure Total 52% 35% 13% 100% --Do you have a positive or negative opinion of former Honolulu Mayor Mufi Hannemann? Hannemann Positive Negative Unsure Total 32% 59% 9% 100% --If Mufi Hannemann were to run for a political office in the 2014 election, how likely would you be to vote for him? VoteHannemann Very likely Somewhat likely Somewhat unlikely Very unlikely Unsure Total 20% 23% 20% 28% 9% 100%
- 2. 2 Demographics (Registered Voters, Oahu) Sex Male Female Refused Total 46% 53% 0% 100% Age Under 50 Fifty and over Total 31% 69% 100% Race_Ethnicity Caucasian Japanese Filipino Hawaiian Chinese Hispanic Other/Mixed Refused Total 30% 30% 12% 7% 7% 1% 13% 0% 100% County_CD Oahu_CD1 Oahu_CD2 Total 73% 27% 100%
- 3. 3 Politics Liberal/progressive Moderate Conservative Unsure Total 26% 34% 25% 15% 100% Party Democrat Republican Independent Unsure Total 52% 21% 21% 6% 100% Education No degree HS graduate College Graduate Some/Assoc/Voc Grad Degree Refused Total 2% 12% 24% 28% 29% 3% 100% Military_Family Yes No Refused Total 63% 34% 3% 100% Union_Family Yes No Refused Total 34% 61% 5% 100%
- 4. 4 Income Under $50,000 $50,000 $99,999 $100,000 or more Refused Total 20% 33% 24% 24% 100% Opinion Crosstabs Hannemann * Caldwell Crosstabulation % within Caldwell Caldwell Positive Negative Unsure Hannemann Positive 43% 18% 23% Negative 52% 79% 38% Unsure 5% 3% 38% Total 100% 100% 100% VoteHannemann * Caldwell Crosstabulation % within Caldwell Caldwell Positive Negative Unsure VoteHannemann Very likely 24% 16% 13% Somewhat 25% 20% 20% likely Somewhat 21% 19% 22% unlikely Very unlikely 21% 41% 21% Unsure 9% 4% 23% Total 100% 100% 100%
- 5. 5 Caldwell * Hannemann Crosstabulation % within Hannemann Hannemann Positive Negative Unsure Caldwell Positive 71% 46% 31% Negative 19% 46% 13% Unsure 10% 9% 56% Total 100% 100% 100% VoteHannemann * Hannemann Crosstabulation % within Hannemann Hannemann Positive Negative Unsure VoteHannemann Very likely 57% 2% 3% Somewhat 30% 18% 29% likely Somewhat 3% 30% 17% unlikely Very unlikely 0% 46% 6% Unsure 9% 4% 44% Total 100% 100% 100% Caldwell * VoteHannemann Crosstabulation % within VoteHannemann VoteHannemann Very Somewhat Somewhat Very likely likely unlikely unlikely Unsure Caldwell Positive 64% 57% 53% 40% 52% Negative 27% 31% 33% 51% 14% Unsure 9% 12% 14% 10% 33% Total 100% 100% 100% 100% 100% Hannemann * VoteHannemann Crosstabulation % within VoteHannemann VoteHannemann Very Somewhat Somewhat Very likely likely unlikely unlikely Unsure Hannemann Positive 91% 42% 5% 1% 30% Negative 7% 46% 87% 97% 25% Unsure 1% 12% 8% 2% 44% Total 100% 100% 100% 100% 100%
- 6. 6 Demographic Crosstabs Caldwell * Sex Crosstabulation % within Sex Caldwell Positive Negative Unsure Total Male 50% 37% 13% 100% Sex Female Refused 55% 31% 67% 13% 33% 100% 100% Caldwell * Age Crosstabulation % within Age Age Under Fifty and 50 over Caldwell Positive 47% 55% Negative 43% 30% Unsure 10% 14% Total 100% 100% Caldwell * Race_Ethnicity Crosstabulation % within Race_Ethnicity Race_Ethnicity Caucasia Japanes n e Filipino Hawaiian Chinese Hispanic CaldwellPositive Caldwell 49% 64% 43% 59% 49% 33% Negative 38% 25% 43% 35% 33% 67% Unsure 13% 11% 13% 7% 18% 0% Total 100% 100% 100% 100% 100% 100% Caldwell * County_CD Crosstabulation % within County_CD County_CD Caldwell Positive Negative Unsure Total Oahu_CD1 Oahu_CD2 55% 45% 33% 39% 12% 16% 100% 100% Other/ Mixed 45% 35% 20% 100%
- 7. 7 Caldwell * Politics Crosstabulation % within Politics Politics Caldwell Positive Negative Unsure Total Liberal/progressive Moderate Conservative Unsure 60% 57% 43% 45% 27% 32% 48% 28% 13% 10% 9% 26% 100% 100% 100% 100% Caldwell * Party Crosstabulation % within Party Party Caldwell Positive Negative Unsure Total Democrat Republican Independent Unsure 65% 38% 45% 22% 23% 50% 45% 39% 13% 11% 10% 39% 100% 100% 100% 100% Caldwell * Education Crosstabulation % within Education Education Caldwell Positive Negative Unsure Total No HS College Grad degree graduate Graduate Some/Assoc/Voc Degree Refused 63% 50% 50% 58% 51% 52% 19% 31% 35% 29% 40% 24% 19% 19% 14% 13% 8% 24% 100% 100% 100% 100% 100% 100% Caldwell * Military_Family Crosstabulation % within Military_Family Military_Family Yes No Refused Caldwell Positive 54% 53% 48% Negative 36% 31% 24% Unsure 10% 17% 29% Total 100% 100% 100%
- 8. 8 Caldwell * Union_Family Crosstabulation % within Union_Family Union_Family Yes No Refused Caldwell Positive 54% 54% 32% Negative 36% 34% 19% Unsure 10% 12% 48% Total 100% 100% 100% Caldwell * Income Crosstabulation % within Income Caldwell Positive Negative Unsure Total Income Under $50,000 - $100,000 $50,000 $99,999 or more Refused 50% 59% 52% 48% 39% 30% 41% 26% 11% 11% 7% 26% 100% 100% 100% 100% Hannemann * Sex Crosstabulation % within Sex Hannemann Positive Negative Unsure Total Sex Male Female Refused 27% 36% 33% 63% 56% 67% 10% 8% 100% 100% 100% Hannemann * Age Crosstabulation % within Age Age Under Fifty and 50 over Hannemann Positive 35% 30% Negative 55% 62% Unsure 11% 8% Total 100% 100%
- 9. 9 Hannemann * Race_Ethnicity Crosstabulation % within Race_Ethnicity Race_Ethnicity Caucasia Japanes Hawaiia Chines Hispani Other/ n e Filipino n e c Mixed Hanneman Positive 23% 39% 33% 46% 25% 33% 21% n Negativ 71% 56% 51% 54% 57% 50% 61% e Unsure 6% 5% 16% 0% 18% 17% 18% Total 100% 100% 100% 100% 100% 100% 100% Hannemann * County_CD Crosstabulation % within County_CD County_CD Hannemann Positive Negative Unsure Total Oahu_CD1 Oahu_CD2 31% 34% 60% 59% 10% 7% 100% 100% Hannemann * Politics Crosstabulation % within Politics Politics Hannemann Positive Negative Unsure Total Liberal/progressive Moderate Conservative Unsure 23% 32% 35% 34% 71% 63% 55% 45% 6% 5% 10% 20% 100% 100% 100% 100% Hannemann * Party Crosstabulation % within Party Party Hannemann Positive Negative Unsure Total Democrat Republican Independent Unsure 34% 30% 24% 25% 60% 60% 66% 44% 6% 10% 10% 31% 100% 100% 100% 100%
- 10. 10 Hannemann * Education Crosstabulation % within Education Hannemann Positive Negative Unsure Total Education No HS College Grad degree graduate Graduate Some/Assoc/Voc Degree Refused 31% 41% 29% 32% 23% 59% 38% 50% 64% 56% 72% 23% 31% 9% 7% 12% 5% 18% 100% 100% 100% 100% 100% 100% Hannemann * Military_Family Crosstabulation % within Military_Family Military_Family Yes No Refused Hannemann Positive 29% 32% 36% Negative 63% 57% 45% Unsure 8% 11% 18% Total 100% 100% 100% Hannemann * Union_Family Crosstabulation % within Union_Family Union_Family Yes No Refused Hannemann Positive 31% 30% 39% Negative 66% 59% 29% Unsure 3% 11% 32% Total 100% 100% 100% Hannemann * Income Crosstabulation % within Income Income Under $50,000 - $100,000 $50,000 $99,999 or more Refused Hannemann Positive 32% 27% 30% 33% Negative 62% 66% 67% 45% Unsure 6% 7% 3% 22% Total 100% 100% 100% 100%
- 11. 11 VoteHannemann * Sex Crosstabulation % within Sex Sex Male Female Refused VoteHannemann Very likely 17% 22% 33% Somewhat 22% 23% likely Somewhat 22% 19% 33% unlikely Very unlikely 31% 26% 33% Unsure 8% 10% Total 100% 100% 100% VoteHannemann * Age Crosstabulation % within Age Age Fifty Under and 50 over VoteHannemann Very likely 22% 18% Somewhat 22% 23% likely Somewhat 22% 20% unlikely Very unlikely 24% 30% Unsure 10% 8% Total 100% 100% VoteHannemann * Race_Ethnicity Crosstabulation % within Race_Ethnicity Race_Ethnicity Other/ Caucasian Japanese Filipino Hawaiian Chinese Hispanic Mixed Vote Very likely 13% 22% 29% 31% 11% 0% 12% Hannemann Somewhat 21% 26% 16% 22% 25% 40% 22% likely Somewhat 26% 19% 17% 7% 25% 0% 26% unlikely Very 35% 24% 22% 33% 20% 20% 33% unlikely Unsure 6% 8% 16% 7% 18% 40% 7% Total 100% 100% 100% 100% 100% 100% 100%
- 12. 12 VoteHannemann * County_CD Crosstabulation % within County_CD County_CD VoteHannemann Very likely Somewhat likely Somewhat unlikely Very unlikely Unsure Total Oahu_CD1 Oahu_CD2 19% 22% 25% 17% 17% 28% 29% 27% 10% 100% 5% 100% VoteHannemann * Politics Crosstabulation % within Politics Politics VoteHannemann Very likely Somewhat likely Somewhat unlikely Very unlikely Unsure Total Liberal/progressive Moderate Conservative Unsure 11% 25% 21% 15% 25% 20% 24% 19% 21% 22% 16% 27% 36% 26% 30% 20% 7% 100% 7% 100% 9% 100% 18% 100%
- 13. 13 VoteHannemann * Party Crosstabulation % within Party Party VoteHannemann Very likely Somewhat likely Somewhat unlikely Very unlikely Unsure Total Democrat Republican Independent Unsure 22% 17% 13% 9% 21% 25% 25% 20% 21% 20% 22% 26% 28% 31% 32% 17% 8% 100% 8% 100% 9% 100% 29% 100% VoteHannemann * Education Crosstabulation % within Education Education No HS College Some/Assoc/ Grad degree graduate Graduate Voc Degree Refused VoteHanneman Very likely 6% 26% 13% 18% 16% 52% n Somewhat 50% 19% 25% 27% 16% 10% likely Somewhat 19% 26% 24% 13% 25% 29% unlikely Very 6% 17% 34% 28% 36% unlikely Unsure 19% 13% 4% 13% 7% 10% Total 100% 100% 100% 100% 100% 100% VoteHannemann * Military_Family Crosstabulation % within Military_Family Military_Family Yes No Refused VoteHannemann Very likely 14% 25% 19% Somewhat 25% 18% 19% likely Somewhat 23% 18% 24% unlikely Very 29% 29% 24% unlikely Unsure 9% 10% 14% Total 100% 100% 100%
- 14. 14 VoteHannemann * Union_Family Crosstabulation % within Union_Family Union_Family Yes No Refused VoteHannemann Very likely 19% 17% 25% Somewhat 23% 23% 19% likely Somewhat 23% 20% 16% unlikely Very 31% 29% 6% unlikely Unsure 4% 10% 34% Total 100% 100% 100% VoteHannemann * Income Crosstabulation % within Income VoteHannemann Very likely Somewhat likely Somewhat unlikely Very unlikely Unsure Total Income Under $50,000 - $100,000 $50,000 $99,999 or more Refused 18% 16% 23% 18% 26% 23% 17% 24% 20% 26% 16% 21% 27% 29% 40% 18% 8% 100% 5% 100% 5% 100% 18% 100%