Así está the economy (2015 april)
•
0 gefällt mir•164 views

Monthly reports on the state of the Spanish economy and international

Empfohlen
Weitere ähnliche Inhalte
Andere mochten auch
Mehr von Círculo de Empresarios
Mehr von Círculo de Empresarios (20)
Kürzlich hochgeladen
Kürzlich hochgeladen (20)
Así está the economy (2015 april)
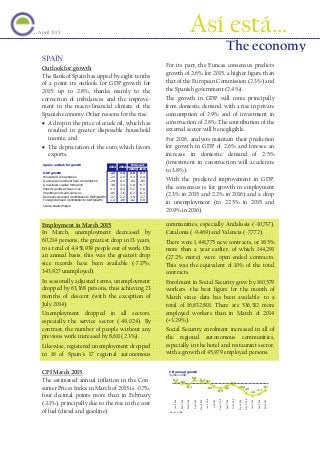
- 1. O SPAIN Outlook for growth The Bank of Spain has upped by eight-tenths of a point its outlook for GDP growth for 2015: up to 2.8%, thanks mainly to the correction of imbalances and the improve- ment in the macro-financial climate of the Spanish economy. Other reasons for the rise: • A drop in the price of crude oil, which has resulted in greater disposable household income, and • The depreciation of the euro, which favors exports. For its part, the Funcas consensus predicts growth of 2.6% for 2015, a higher figure than that of the European Commission (2.3%) and the Spanish government (2.4%). The growth in GDP will come principally from domestic demand, with a rise in private consumption of 2.9% and of investment in construction of 2.8%. The contribution of the external sector will be negligible. For 2016, analysts maintain their prediction for growth in GDP of 2.6% and foresee an increase in domestic demand of 2.5% (investment in construction will accelerate to 3.8%). With the predicted improvement in GDP, the consensus is for growth in employment (2.3% in 2015 and 2.2% in 2016) and a drop in unemployment (to 22.5% in 2015 and 20.9% in 2016). Employment in March 2015 In March, unemployment decreased by 60,214 persons, the greatest drop in 13 years, to a total of 4,451,939 people out of work. On an annual basis, this was the greatest drop sice records have been available (-7.17%; 343,927 unemployed). In seasonally adjusted terms, unemployment dropped by 63,368 persons, thus achieving 23 months of descent (with the exception of July 2014). Unemployment dropped in all sectors, especially the service sector (-49,024). By contrast, the number of people without any previous work increased by 8,611 (2.3%). Likewise, registered unemployment dropped in 16 of Spain’s 17 regional autonomous communities, especially Andalusia (-10,737), Catalonia (-9,469) and Valencia (-7,772). There were 1,441,775 new contracts, or 18.5% more than a year earlier, of which 144,291 (27.2% more) were open-ended contracts. This was the equivalent of 10% of the total contracts. Enrolment in Social Security grew by 160,579 workers -the best figure for the month of March since data has been available- to a total of 16,832,801. There are 536,512 more employed workers than in March of 2014 (+3.29%). Social Security enrolment increased in all of the regional autonomous communities, especially in the hotel and restaurant sector, with a growth of 45,979 employed persons. CPI March 2015 The estimated annual inflation in the Con- sumer Prices Index in March of 2015 is -0.7%, four decimal points more than in February (-1.1%), principally due to the rise in the cost of fuel (diesel and gasoline). Spain: outlook for growth 2015 2016 GDP growth -1.2 1.4 2.8 2.7 Household consumption -2.3 2.4 3.3 2.4 General government final consumption -2.9 0.1 -0.4 -0.1 Gross fixed capital formation -3.8 3.4 5.9 6.7 Exports goods and services 4.3 4.2 5.2 5.8 Imports goods and services -0.5 7.6 6.2 6.3 Domestic demand (contribution to GDP growth) -2.7 2.2 3.0 2.7 Foreign demand (contribution to GDP growth) 1.4 -0.8 -0.2 0.0 Source: Bank of Spain Forecast 2013 2014 0,2 0,0 -0,1 0,4 0,2 0,1 -0,3 -0,5 -0,2 -0,1 -0,4 -1,0 -1,3 -1,1 -0,7 Jan2014 Feb2014 Mar2014 Apr2014 May2014 Jun2014 Jul2014 Aug2014 Sep2014 Oct2014 Nov2014 Dec2014 Jan2015 Feb2015 Mar2015 CPI annual growth %; 2011 = 100 Source:INE Así está… The economy April 2015
- 2. EUROPEAN UNION Employment In February, unemployment in the Eurozone dropped to 11.3%, the lowest figure since May of 2012, and to 9.8% in the EU. The lowest rates were in Germany (4.8%) and Austria (5.3%), while the highest were in Greece (26%) and Spain (23.2%). In the EU, among people younger than 25, the unemployment rate was 21.1% (4.85 million), and in the Eurozone it was 22.9% (3.24 million). The lowest rates of youth unemployment were in Germany (7.2%), Austria (9%) and Denmark (10.2%), while the highest were in Greece (51.2%), Spain (50.7%), Croatia (46.4%) and Italy (42.6%). CPI March 2015 The drop in prices has slowed in the Euro- zone, thanks in part to the expansionary policy of the CEB in purchasing debt from member countries. Thus in March, year-on- year negative inflation was reduced to -0.1%, as against the -0.3% of February (Eurostat). By sectors, inflation in services was 1% (1.2% in February); in food, drink and tobacco 0.6% (as against 0.5% in February), and in industrial goods –except for energy– it remained around -0.1%. Inflation in the energy sector was -5.8%, as against the -7.9% of February. INTERNATIONAL Creating jobs in the USA In March, job creation in the USA grew at the slowest rate since December of 2013, with 126,000 new workers, just half the figure of the previous month. This slowdown can be explained by the bad weather, the negative effect on exports of an appreciation of the dollar, and cheaper petro- leum. In addition, the activity rate is at its lowest level in 37 years (62.7%), which is what explains in part the low unemployment rate (5.5%). Brazil Brazil has slowed its economic growth –an average of 3.7% annually between 2000 and 2010– to just 1.6% between 2011 and 2014. Among the principal imbalances: • The deterioration of government accounts (a deficit of 6.7% and debt of close to 65%), principally caused by the fiscal ex- pansion that has been applied. • Inflationary pressures (an average of 6.2% during the past four years). • The large increase in the external deficit (4.2% of GDP in 2014), from the previous surplus before 2008, mainly because a loss of competitiveness in the Brazilian econo- my. • Increased debt by both families (up to nearly 50% of their income in 2014) and companies (230%). 330 236 286 249 213 250 221 423 329 201 264 126 Apr 2014 May 2014 Jun 2014 Jul 2014 Aug 2014 Sep 2014 Oct 2014 Nov 2014 Dec 2014 Jan 2015 Feb 2015 Mar 2015 USA Employment creation Thousand Source:Bureau of Labor Statistics ‘Así está…The economy’, a publication of the Círculo de Empresarios produced by its Department of the Economy, contains infor- mation and opinion from reliable sources. However the Círculo de Empresarios does not guarantee its accuracy and does not take responsibility for any errors or omissions. This document is merely informative. As a result, the Círculo de Empresarios is not responsible for any uses that may be made of the publication. The opinions and estimates of the Department can be modified without any warning. www.circulodeempresarios.org