Sefl Organizing Map
•Als PPT, PDF herunterladen•
15 gefällt mir•6,040 views

Implemented by Nguyen Van Chuc - Danang University of Economics, Danang- Vietnam
![[object Object],[object Object],[object Object],[object Object],[object Object],[object Object],Kohonen’s Neural Network or Self Organizing Maps (SOM)](data:image/gif;base64,R0lGODlhAQABAIAAAAAAAP///yH5BAEAAAAALAAAAAABAAEAAAIBRAA7)
Empfohlen
Weitere ähnliche Inhalte
Was ist angesagt?
Was ist angesagt? (20)
Ähnlich wie Sefl Organizing Map
Ähnlich wie Sefl Organizing Map (20)
Kürzlich hochgeladen
Kürzlich hochgeladen (20)
Sefl Organizing Map
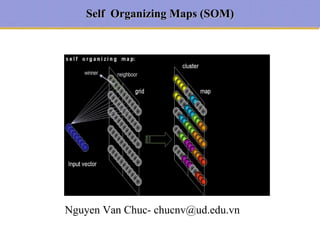
- 1. Self Organizing Maps (SOM) Nguyen Van Chuc- chucnv@ud.edu.vn
- 6. Self-Organizing Maps : Introduction
- 7. Self-Organizing Maps : Introduction The neurons in the output layer are arranged on a map 2d array of neurons Set of input signals (connected to all neurons in lattice) Weighted synapses x 1 x 2 x 3 x n ... w j1 w j2 w j3 w jn j
- 8. Self-Organizing Maps : Introduction The figure shows a very small Kohonen network of 4 x 4 nodes connected to the input layer (shown in green) representing a two dimensional vector. Each node has a specific topological position (an x, y coordinate in the lattice) and contains a vector of weights of the same dimension as the input vectors. If the training data consists of vectors, V , of n dimensions: V1, V2, V3...Vn Then each node will contain a corresponding weight vector W, of n dimensions: W1, W2, W3...Wn Kohonen Network Architecture
- 9. Example Self-Organizing Maps ‘ Poverty map’ based on 39 indicators from World Bank statistics (1992) World Poverty Map A SOM has been used to classify statistical data describing various quality-of-life factors such as state of health, nutrition, educational services etc. . Countries with similar quality-of-life factors end up clustered together . The countries with better quality-of-life are situated toward the upper left and the most poverty stricken countries are toward the lower right. SOM – Result Example
- 10. Self-Organizing Maps : Algorithm
- 11. Example To make the problem very simple, suppose that there are only two neurons in the output layer as shown below:
- 12. Example Consider a simple example in which there are only 4 input training patterns . Following the algorithm presented in the previous algorithm:
- 13. Example
- 14. Example For vector 0011 D(1) = 0.7056, D(2) = 2.724 Hence J = 1 For vector 0001 D(1) = 0.66, D(2) = 2.2768 Hence J = 1. For vector 1000 D(1) = 1.8656, D(2) = 0.6768 Hence J = 2 Likewise for remains training patterns
- 15. Example This matrix seems to converge to
- 16. Example TEST NETWORK Suppose the input pattern is 1100. Then Thus neuron 2 is the " winner ", and is the localized active region of the SOM. Notice that we may label this input pattern to belong to cluster 2. For all the other patterns, we find the clusters are as listed below. This matrix seems to converge to
- 17. Application Using SOM to cluster Data The IRIS dataset IRIS is a classical data set used by statisticians to check classification methods. It is composed by 150 samples of flowers divided into 3 classes (50 setosa, 50 versicolor, 50 virginica) and described by 4 variables (petal length, petal width, sepal length, sepal width
- 18. Application Using SOM to cluster Data Graphical Results we can look at the assignment of each neuron (i.e. each neuron will be coloured on the basis of the assigned class).
- 19. Application Using SOM to cluster Data Graphical Results we can look at the weights of a specific neuron and at the labels of the samples placed in that neuron
- 21. Thank you for your attention !