
Empfohlen
Weitere ähnliche Inhalte
Was ist angesagt?
Was ist angesagt? (19)
Ähnlich wie H W 2010 01 At
Ähnlich wie H W 2010 01 At (20)
Mehr von chipwags
Kürzlich hochgeladen
Kürzlich hochgeladen (20)
H W 2010 01 At
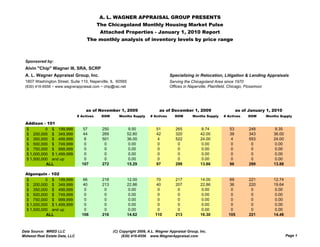
- 1. A. L. WAGNER APPRAISAL GROUP PRESENTS The Chicagoland Monthly Housing Market Pulse Attached Properties - January 1, 2010 Report The monthly analysis of inventory levels by price range Sponsored by: Alvin "Chip" Wagner III, SRA, SCRP A. L. Wagner Appraisal Group, Inc. Specializing in Relocation, Litigation & Lending Appraisals 1807 Washington Street, Suite 110, Naperville, IL 60565 Serving the Chicagoland Area since 1970 (630) 416-6556 ~ www.wagnerappraisal.com ~ chip@rac.net Offices in Naperville, Plainfield, Chicago, Flossmoor as of November 1, 2009 as of December 1, 2009 as of January 1, 2010 # Actives DOM Months Supply # Actives DOM Months Supply # Actives DOM Months Supply Addison - 101 $ 0 $ 199,999 57 250 9.50 51 265 8.74 53 248 9.35 $ 200,000 $ 349,999 44 269 52.80 42 320 42.00 39 343 36.00 $ 350,000 $ 499,999 6 501 36.00 4 522 24.00 4 553 24.00 $ 500,000 $ 749,999 0 0 0.00 0 0 0.00 0 0 0.00 $ 750,000 $ 999,999 0 0 0.00 0 0 0.00 0 0 0.00 $ 1,000,000 $ 1,499,999 0 0 0.00 0 0 0.00 0 0 0.00 $ 1,500,000 and up 0 0 0.00 0 0 0.00 0 0 0.00 ALL 107 272 15.29 97 299 13.86 96 299 13.88 Algonquin - 102 $ 0 $ 199,999 66 218 12.00 70 217 14.00 69 221 12.74 $ 200,000 $ 349,999 40 213 22.86 40 207 22.86 36 220 19.64 $ 350,000 $ 499,999 0 0 0.00 0 0 0.00 0 0 0.00 $ 500,000 $ 749,999 0 0 0.00 0 0 0.00 0 0 0.00 $ 750,000 $ 999,999 0 0 0.00 0 0 0.00 0 0 0.00 $ 1,000,000 $ 1,499,999 0 0 0.00 0 0 0.00 0 0 0.00 $ 1,500,000 and up 0 0 0.00 0 0 0.00 0 0 0.00 ALL 106 216 14.62 110 213 16.30 105 221 14.48 Data Source: MRED LLC (C) Copyright 2009, A.L. Wagner Appraisal Group, Inc. Midwest Real Estate Data, LLC (630) 416-6556 www.WagnerAppraisal.com Page 1
- 2. as of November 1, 2009 as of December 1, 2009 as of January 1, 2010 # Actives DOM Months Supply # Actives DOM Months Supply # Actives DOM Months Supply Antioch - 2 $ 0 $ 199,999 12 201 4.65 16 172 6.86 12 169 5.14 $ 200,000 $ 349,999 4 431 9.60 2 754 4.80 2 785 6.00 $ 350,000 $ 499,999 2 382 No Sales 2 412 No Sales 2 443 No Sales $ 500,000 $ 749,999 0 0 0.00 0 0 0.00 0 0 0.00 $ 750,000 $ 999,999 0 0 0.00 0 0 0.00 0 0 0.00 $ 1,000,000 $ 1,499,999 0 0 0.00 0 0 0.00 0 0 0.00 $ 1,500,000 and up 0 0 0.00 0 0 0.00 0 0 0.00 ALL 18 272 6.00 20 254 7.27 16 280 6.00 Arlington Heights - 5 $ 0 $ 199,999 264 222 13.37 262 224 13.73 257 243 13.53 $ 200,000 $ 349,999 107 244 13.38 103 255 13.29 99 273 12.38 $ 350,000 $ 499,999 33 260 44.00 28 190 48.00 26 234 34.67 $ 500,000 $ 749,999 7 83 28.00 7 113 28.00 7 144 28.00 $ 750,000 $ 999,999 2 728 No Sales 2 758 No Sales 0 0 0.00 $ 1,000,000 $ 1,499,999 0 0 0.00 0 0 0.00 0 0 0.00 $ 1,500,000 and up 0 0 0.00 0 0 0.00 0 0 0.00 ALL 413 231 14.37 402 230 14.53 389 248 13.89 Aurora - 507 $ 0 $ 199,999 400 192 10.60 391 191 9.92 382 197 9.86 $ 200,000 $ 349,999 84 295 14.40 82 308 14.69 71 347 12.35 $ 350,000 $ 499,999 10 248 40.00 8 291 48.00 8 322 48.00 $ 500,000 $ 749,999 3 441 36.00 3 471 36.00 3 502 36.00 $ 750,000 $ 999,999 0 0 0.00 0 0 0.00 0 0 0.00 $ 1,000,000 $ 1,499,999 0 0 0.00 0 0 0.00 0 0 0.00 $ 1,500,000 and up 0 0 0.00 0 0 0.00 0 0 0.00 ALL 497 212 11.32 484 214 10.70 464 224 10.37 Barrington Area - 10 $ 0 $ 199,999 22 206 8.00 23 249 8.36 23 206 8.63 $ 200,000 $ 349,999 56 274 32.00 49 291 26.73 37 290 20.18 $ 350,000 $ 499,999 19 206 12.00 19 208 12.67 19 239 13.41 $ 500,000 $ 749,999 7 328 84.00 7 358 84.00 5 474 30.00 $ 750,000 $ 999,999 1 194 No Sales 2 121 No Sales 2 152 No Sales $ 1,000,000 $ 1,499,999 0 0 0.00 0 0 0.00 0 0 0.00 $ 1,500,000 and up 0 0 0.00 0 0 0.00 0 0 0.00 ALL 105 250 17.03 100 267 16.22 86 264 14.14 Data Source: MRED LLC (C) Copyright 2009, A.L. Wagner Appraisal Group, Inc. Midwest Real Estate Data, LLC (630) 416-6556 www.WagnerAppraisal.com Page 2
- 3. as of November 1, 2009 as of December 1, 2009 as of January 1, 2010 # Actives DOM Months Supply # Actives DOM Months Supply # Actives DOM Months Supply Bartlett - 104 $ 0 $ 199,999 62 198 11.45 65 212 10.99 56 236 8.84 $ 200,000 $ 349,999 62 188 17.71 66 165 18.86 62 178 17.71 $ 350,000 $ 499,999 4 520 24.00 3 568 36.00 3 599 36.00 $ 500,000 $ 749,999 0 0 0.00 0 0 0.00 0 0 0.00 $ 750,000 $ 999,999 0 0 0.00 0 0 0.00 0 0 0.00 $ 1,000,000 $ 1,499,999 0 0 0.00 0 0 0.00 0 0 0.00 $ 1,500,000 and up 0 0 0.00 0 0 0.00 0 0 0.00 ALL 128 203 13.96 134 197 13.98 121 216 12.20 Batavia - 510 $ 0 $ 199,999 24 223 12.00 25 169 12.50 20 157 9.23 $ 200,000 $ 349,999 21 210 14.82 15 252 11.25 12 267 8.00 $ 350,000 $ 499,999 6 695 72.00 6 725 72.00 6 756 72.00 $ 500,000 $ 749,999 2 194 No Sales 1 300 No Sales 1 331 No Sales $ 750,000 $ 999,999 0 0 0.00 0 0 0.00 0 0 0.00 $ 1,000,000 $ 1,499,999 0 0 0.00 0 0 0.00 0 0 0.00 $ 1,500,000 and up 0 0 0.00 0 0 0.00 0 0 0.00 ALL 53 270 15.14 47 269 13.76 39 287 10.40 Bensenville - 106 $ 0 $ 199,999 27 343 23.14 24 344 22.15 28 311 28.00 $ 200,000 $ 349,999 2 233 24.00 2 108 12.00 2 139 8.00 $ 350,000 $ 499,999 0 0 0.00 0 0 0.00 0 0 0.00 $ 500,000 $ 749,999 0 0 0.00 0 0 0.00 0 0 0.00 $ 750,000 $ 999,999 0 0 0.00 0 0 0.00 0 0 0.00 $ 1,000,000 $ 1,499,999 0 0 0.00 0 0 0.00 0 0 0.00 $ 1,500,000 and up 0 0 0.00 0 0 0.00 0 0 0.00 ALL 29 335 23.20 26 326 20.80 30 299 24.00 Berwyn - 402 $ 0 $ 199,999 58 226 17.85 49 246 14.34 50 231 14.29 $ 200,000 $ 349,999 6 223 2.67 11 135 4.89 9 117 3.86 $ 350,000 $ 499,999 1 61 No Sales 0 0 0.00 0 0 0.00 $ 500,000 $ 749,999 0 0 0.00 0 0 0.00 0 0 0.00 $ 750,000 $ 999,999 0 0 0.00 0 0 0.00 0 0 0.00 $ 1,000,000 $ 1,499,999 0 0 0.00 0 0 0.00 0 0 0.00 $ 1,500,000 and up 0 0 0.00 0 0 0.00 0 0 0.00 ALL 65 223 11.82 60 226 10.59 59 214 10.11 Data Source: MRED LLC (C) Copyright 2009, A.L. Wagner Appraisal Group, Inc. Midwest Real Estate Data, LLC (630) 416-6556 www.WagnerAppraisal.com Page 3
- 4. as of November 1, 2009 as of December 1, 2009 as of January 1, 2010 # Actives DOM Months Supply # Actives DOM Months Supply # Actives DOM Months Supply Bloomingdale - 108 $ 0 $ 199,999 66 216 10.15 64 232 9.60 58 238 9.16 $ 200,000 $ 349,999 66 226 20.84 60 238 17.56 55 252 16.50 $ 350,000 $ 499,999 26 281 44.57 29 275 49.71 29 302 58.00 $ 500,000 $ 749,999 0 0 0.00 0 0 0.00 0 0 0.00 $ 750,000 $ 999,999 0 0 0.00 0 0 0.00 0 0 0.00 $ 1,000,000 $ 1,499,999 0 0 0.00 0 0 0.00 0 0 0.00 $ 1,500,000 and up 0 0 0.00 0 0 0.00 0 0 0.00 ALL 158 230 15.41 153 243 14.34 142 257 13.97 Bolingbrook - 440 $ 0 $ 199,999 113 175 7.17 104 186 6.37 104 192 6.57 $ 200,000 $ 349,999 25 167 30.00 23 190 25.09 23 195 27.60 $ 350,000 $ 499,999 1 151 No Sales 1 181 No Sales 1 212 No Sales $ 500,000 $ 749,999 0 0 0.00 0 0 0.00 0 0 0.00 $ 750,000 $ 999,999 0 0 0.00 0 0 0.00 0 0 0.00 $ 1,000,000 $ 1,499,999 0 0 0.00 0 0 0.00 0 0 0.00 $ 1,500,000 and up 0 0 0.00 0 0 0.00 0 0 0.00 ALL 139 173 8.38 128 187 7.42 128 193 7.68 Brookfield - 513 $ 0 $ 199,999 18 241 24.00 16 220 24.00 14 283 28.00 $ 200,000 $ 349,999 11 198 18.86 7 231 10.50 6 260 8.00 $ 350,000 $ 499,999 0 0 0.00 0 0 0.00 0 0 0.00 $ 500,000 $ 749,999 0 0 0.00 0 0 0.00 0 0 0.00 $ 750,000 $ 999,999 0 0 0.00 0 0 0.00 0 0 0.00 $ 1,000,000 $ 1,499,999 0 0 0.00 0 0 0.00 0 0 0.00 $ 1,500,000 and up 0 0 0.00 0 0 0.00 0 0 0.00 ALL 29 225 20.47 23 223 16.24 20 277 15.00 Buffalo Grove - 89 $ 0 $ 199,999 170 203 14.47 176 209 14.87 170 222 13.60 $ 200,000 $ 349,999 94 211 13.76 83 190 12.45 78 231 12.32 $ 350,000 $ 499,999 16 148 16.00 14 108 12.92 16 128 16.00 $ 500,000 $ 749,999 0 0 0.00 0 0 0.00 0 0 0.00 $ 750,000 $ 999,999 0 0 0.00 0 0 0.00 0 0 0.00 $ 1,000,000 $ 1,499,999 0 0 0.00 0 0 0.00 0 0 0.00 $ 1,500,000 and up 0 0 0.00 0 0 0.00 0 0 0.00 ALL 280 203 14.30 273 198 13.94 264 219 13.31 Data Source: MRED LLC (C) Copyright 2009, A.L. Wagner Appraisal Group, Inc. Midwest Real Estate Data, LLC (630) 416-6556 www.WagnerAppraisal.com Page 4
- 5. as of November 1, 2009 as of December 1, 2009 as of January 1, 2010 # Actives DOM Months Supply # Actives DOM Months Supply # Actives DOM Months Supply Burr Ridge - 522 $ 0 $ 199,999 8 305 19.20 6 381 14.40 4 428 6.86 $ 200,000 $ 349,999 11 273 22.00 12 242 24.00 21 145 36.00 $ 350,000 $ 499,999 12 232 20.57 9 260 18.00 6 269 9.00 $ 500,000 $ 749,999 16 211 64.00 17 201 68.00 16 268 48.00 $ 750,000 $ 999,999 4 205 No Sales 3 241 No Sales 3 272 No Sales $ 1,000,000 $ 1,499,999 1 91 No Sales 1 121 No Sales 1 152 No Sales $ 1,500,000 and up 0 0 0.00 0 0 0.00 0 0 0.00 ALL 52 240 29.71 48 246 28.80 51 228 23.54 Carol Stream - 188 $ 0 $ 199,999 97 196 9.46 90 199 8.71 83 205 7.84 $ 200,000 $ 349,999 43 239 12.90 32 250 10.67 34 264 13.60 $ 350,000 $ 499,999 1 950 No Sales 1 980 No Sales 1 1,011 No Sales $ 500,000 $ 749,999 0 0 0.00 0 0 0.00 0 0 0.00 $ 750,000 $ 999,999 0 0 0.00 0 0 0.00 0 0 0.00 $ 1,000,000 $ 1,499,999 0 0 0.00 0 0 0.00 0 0 0.00 $ 1,500,000 and up 0 0 0.00 0 0 0.00 0 0 0.00 ALL 141 214 10.38 123 219 9.23 118 229 9.02 Carpentersville, Lake Marion - 110 $ 0 $ 199,999 81 194 8.60 89 190 10.08 89 201 10.47 $ 200,000 $ 349,999 2 64 24.00 1 125 12.00 1 157 12.00 $ 350,000 $ 499,999 0 0 0.00 0 0 0.00 0 0 0.00 $ 500,000 $ 749,999 0 0 0.00 0 0 0.00 0 0 0.00 $ 750,000 $ 999,999 0 0 0.00 0 0 0.00 0 0 0.00 $ 1,000,000 $ 1,499,999 0 0 0.00 0 0 0.00 0 0 0.00 $ 1,500,000 and up 0 0 0.00 0 0 0.00 0 0 0.00 ALL 83 190 8.74 90 190 10.09 90 201 10.49 Cary, Oakwood Hills - 13 $ 0 $ 199,999 36 183 9.82 33 169 8.80 30 160 8.37 $ 200,000 $ 349,999 14 246 14.00 11 324 10.15 11 338 11.00 $ 350,000 $ 499,999 0 0 0.00 0 0 0.00 0 0 0.00 $ 500,000 $ 749,999 0 0 0.00 0 0 0.00 0 0 0.00 $ 750,000 $ 999,999 0 0 0.00 0 0 0.00 0 0 0.00 $ 1,000,000 $ 1,499,999 0 0 0.00 0 0 0.00 0 0 0.00 $ 1,500,000 and up 0 0 0.00 0 0 0.00 0 0 0.00 ALL 50 200 10.71 44 208 9.10 41 208 8.95 Data Source: MRED LLC (C) Copyright 2009, A.L. Wagner Appraisal Group, Inc. Midwest Real Estate Data, LLC (630) 416-6556 www.WagnerAppraisal.com Page 5
- 6. as of November 1, 2009 as of December 1, 2009 as of January 1, 2010 # Actives DOM Months Supply # Actives DOM Months Supply # Actives DOM Months Supply Cicero - 650 $ 0 $ 199,999 17 251 12.75 18 183 12.71 13 222 10.40 $ 200,000 $ 349,999 0 0 0.00 0 0 0.00 0 0 0.00 $ 350,000 $ 499,999 0 0 0.00 0 0 0.00 0 0 0.00 $ 500,000 $ 749,999 0 0 0.00 0 0 0.00 0 0 0.00 $ 750,000 $ 999,999 0 0 0.00 0 0 0.00 0 0 0.00 $ 1,000,000 $ 1,499,999 0 0 0.00 0 0 0.00 0 0 0.00 $ 1,500,000 and up 0 0 0.00 0 0 0.00 0 0 0.00 ALL 17 251 12.75 18 183 12.71 13 222 10.40 Clarendon Hills - 514 $ 0 $ 199,999 15 163 25.71 12 189 18.00 16 165 27.43 $ 200,000 $ 349,999 19 323 38.00 21 320 42.00 17 288 29.14 $ 350,000 $ 499,999 10 330 60.00 9 379 54.00 7 458 42.00 $ 500,000 $ 749,999 0 0 0.00 0 0 0.00 0 0 0.00 $ 750,000 $ 999,999 0 0 0.00 0 0 0.00 0 0 0.00 $ 1,000,000 $ 1,499,999 0 0 0.00 0 0 0.00 0 0 0.00 $ 1,500,000 and up 1 339 No Sales 1 369 No Sales 1 400 No Sales ALL 45 272 33.75 43 297 30.35 41 272 28.94 Countryside - 527 $ 0 $ 199,999 27 299 15.43 28 250 16.00 29 203 18.32 $ 200,000 $ 349,999 1 126 12.00 2 90 24.00 2 121 24.00 $ 350,000 $ 499,999 6 90 72.00 7 105 84.00 7 136 84.00 $ 500,000 $ 749,999 1 371 No Sales 1 401 No Sales 1 432 No Sales $ 750,000 $ 999,999 0 0 0.00 0 0 0.00 0 0 0.00 $ 1,000,000 $ 1,499,999 0 0 0.00 0 0 0.00 0 0 0.00 $ 1,500,000 and up 0 0 0.00 0 0 0.00 0 0 0.00 ALL 35 260 18.26 38 219 19.83 39 193 22.29 Crest Hill - 498 $ 0 $ 199,999 83 206 10.71 80 224 10.67 76 236 9.81 $ 200,000 $ 349,999 11 131 66.00 10 155 120.00 9 173 108.00 $ 350,000 $ 499,999 0 0 0.00 0 0 0.00 0 0 0.00 $ 500,000 $ 749,999 0 0 0.00 0 0 0.00 0 0 0.00 $ 750,000 $ 999,999 0 0 0.00 0 0 0.00 0 0 0.00 $ 1,000,000 $ 1,499,999 0 0 0.00 0 0 0.00 0 0 0.00 $ 1,500,000 and up 0 0 0.00 0 0 0.00 0 0 0.00 ALL 94 197 11.87 90 216 11.87 85 229 10.85 Data Source: MRED LLC (C) Copyright 2009, A.L. Wagner Appraisal Group, Inc. Midwest Real Estate Data, LLC (630) 416-6556 www.WagnerAppraisal.com Page 6
- 7. as of November 1, 2009 as of December 1, 2009 as of January 1, 2010 # Actives DOM Months Supply # Actives DOM Months Supply # Actives DOM Months Supply Crystal Lake, Lakewood - 14 $ 0 $ 199,999 116 202 12.89 109 222 12.70 111 220 13.06 $ 200,000 $ 349,999 26 221 19.50 23 204 17.25 23 216 19.71 $ 350,000 $ 499,999 7 343 42.00 6 334 36.00 5 416 30.00 $ 500,000 $ 749,999 4 578 No Sales 0 0 0.00 0 0 0.00 $ 750,000 $ 999,999 0 0 0.00 0 0 0.00 0 0 0.00 $ 1,000,000 $ 1,499,999 0 0 0.00 0 0 0.00 0 0 0.00 $ 1,500,000 and up 0 0 0.00 0 0 0.00 0 0 0.00 ALL 153 221 14.57 138 223 13.69 139 226 14.14 Darien - 562 $ 0 $ 199,999 41 209 13.30 38 236 11.12 34 259 9.07 $ 200,000 $ 349,999 58 203 12.65 50 203 10.71 46 202 9.52 $ 350,000 $ 499,999 11 226 66.00 9 283 36.00 3 165 12.00 $ 500,000 $ 749,999 0 0 0.00 0 0 0.00 0 0 0.00 $ 750,000 $ 999,999 0 0 0.00 0 0 0.00 0 0 0.00 $ 1,000,000 $ 1,499,999 0 0 0.00 0 0 0.00 0 0 0.00 $ 1,500,000 and up 0 0 0.00 0 0 0.00 0 0 0.00 ALL 110 208 14.04 97 224 11.64 83 224 9.40 Deerfield - 15 $ 0 $ 199,999 29 224 9.67 35 186 11.35 27 217 7.90 $ 200,000 $ 349,999 31 154 11.27 29 173 10.88 29 171 12.00 $ 350,000 $ 499,999 12 232 16.00 12 262 18.00 13 239 22.29 $ 500,000 $ 749,999 8 121 32.00 6 160 18.00 4 190 12.00 $ 750,000 $ 999,999 0 0 0.00 0 0 0.00 0 0 0.00 $ 1,000,000 $ 1,499,999 0 0 0.00 0 0 0.00 0 0 0.00 $ 1,500,000 and up 0 0 0.00 0 0 0.00 0 0 0.00 ALL 80 188 11.85 82 191 12.15 73 201 10.81 Des Plaines - 16 $ 0 $ 199,999 368 249 11.68 376 251 11.60 336 274 9.93 $ 200,000 $ 349,999 191 253 17.63 171 277 16.96 155 304 15.00 $ 350,000 $ 499,999 9 232 108.00 9 262 108.00 7 330 84.00 $ 500,000 $ 749,999 1 643 6.00 1 673 6.00 1 704 6.00 $ 750,000 $ 999,999 0 0 0.00 0 0 0.00 0 0 0.00 $ 1,000,000 $ 1,499,999 0 0 0.00 0 0 0.00 0 0 0.00 $ 1,500,000 and up 0 0 0.00 0 0 0.00 0 0 0.00 ALL 569 250 13.36 557 260 13.03 499 285 11.23 Data Source: MRED LLC (C) Copyright 2009, A.L. Wagner Appraisal Group, Inc. Midwest Real Estate Data, LLC (630) 416-6556 www.WagnerAppraisal.com Page 7
- 8. as of November 1, 2009 as of December 1, 2009 as of January 1, 2010 # Actives DOM Months Supply # Actives DOM Months Supply # Actives DOM Months Supply Downers Grove - 515 $ 0 $ 199,999 147 247 13.78 150 250 13.43 142 263 13.52 $ 200,000 $ 349,999 48 269 14.77 50 281 17.14 41 352 12.30 $ 350,000 $ 499,999 37 331 44.40 36 360 43.20 26 418 22.29 $ 500,000 $ 749,999 13 605 52.00 11 716 44.00 11 721 44.00 $ 750,000 $ 999,999 0 0 0.00 0 0 0.00 0 0 0.00 $ 1,000,000 $ 1,499,999 0 0 0.00 0 0 0.00 0 0 0.00 $ 1,500,000 and up 0 0 0.00 0 0 0.00 0 0 0.00 ALL 245 283 16.33 247 293 16.29 220 321 14.43 East & West Dundee, Sleepy Hollow - 118 $ 0 $ 199,999 25 282 11.11 28 266 13.44 30 268 18.00 $ 200,000 $ 349,999 6 220 14.40 6 250 18.00 8 243 48.00 $ 350,000 $ 499,999 0 0 0.00 0 0 0.00 0 0 0.00 $ 500,000 $ 749,999 0 0 0.00 0 0 0.00 0 0 0.00 $ 750,000 $ 999,999 0 0 0.00 0 0 0.00 0 0 0.00 $ 1,000,000 $ 1,499,999 0 0 0.00 0 0 0.00 0 0 0.00 $ 1,500,000 and up 0 0 0.00 0 0 0.00 0 0 0.00 ALL 31 270 11.63 34 263 14.07 38 263 20.73 Elgin - 123 $ 0 $ 199,999 223 211 12.99 230 214 13.14 220 226 11.68 $ 200,000 $ 349,999 115 229 32.86 99 217 25.83 107 213 29.18 $ 350,000 $ 499,999 3 236 36.00 3 208 36.00 4 186 48.00 $ 500,000 $ 749,999 0 0 0.00 0 0 0.00 0 0 0.00 $ 750,000 $ 999,999 0 0 0.00 0 0 0.00 0 0 0.00 $ 1,000,000 $ 1,499,999 0 0 0.00 0 0 0.00 0 0 0.00 $ 1,500,000 and up 0 0 0.00 0 0 0.00 0 0 0.00 ALL 341 217 16.43 332 215 15.50 331 221 14.66 Elk Grove Village - 7 $ 0 $ 199,999 141 222 16.92 140 229 16.80 129 241 14.60 $ 200,000 $ 349,999 55 163 17.37 47 179 14.46 39 231 11.70 $ 350,000 $ 499,999 1 219 No Sales 0 0 0.00 0 0 0.00 $ 500,000 $ 749,999 0 0 0.00 0 0 0.00 0 0 0.00 $ 750,000 $ 999,999 0 0 0.00 0 0 0.00 0 0 0.00 $ 1,000,000 $ 1,499,999 0 0 0.00 0 0 0.00 0 0 0.00 $ 1,500,000 and up 0 0 0.00 0 0 0.00 0 0 0.00 ALL 197 206 17.13 187 217 16.14 168 239 13.81 Data Source: MRED LLC (C) Copyright 2009, A.L. Wagner Appraisal Group, Inc. Midwest Real Estate Data, LLC (630) 416-6556 www.WagnerAppraisal.com Page 8
- 9. as of November 1, 2009 as of December 1, 2009 as of January 1, 2010 # Actives DOM Months Supply # Actives DOM Months Supply # Actives DOM Months Supply Elmhurst - 126 $ 0 $ 199,999 33 329 26.40 35 313 26.25 33 344 22.00 $ 200,000 $ 349,999 42 273 22.91 38 280 19.83 35 324 19.09 $ 350,000 $ 499,999 10 157 30.00 8 215 16.00 6 245 24.00 $ 500,000 $ 749,999 4 212 24.00 5 95 30.00 3 173 9.00 $ 750,000 $ 999,999 2 135 No Sales 2 165 No Sales 2 196 No Sales $ 1,000,000 $ 1,499,999 0 0 0.00 0 0 0.00 0 0 0.00 $ 1,500,000 and up 0 0 0.00 0 0 0.00 0 0 0.00 ALL 91 275 25.40 88 274 22.47 79 317 20.17 Elmwood Park - 635 $ 0 $ 199,999 92 277 17.52 93 280 17.44 85 297 15.69 $ 200,000 $ 349,999 20 180 10.43 15 220 9.00 14 245 8.40 $ 350,000 $ 499,999 0 0 0.00 0 0 0.00 0 0 0.00 $ 500,000 $ 749,999 0 0 0.00 0 0 0.00 0 0 0.00 $ 750,000 $ 999,999 0 0 0.00 0 0 0.00 0 0 0.00 $ 1,000,000 $ 1,499,999 0 0 0.00 0 0 0.00 0 0 0.00 $ 1,500,000 and up 0 0 0.00 0 0 0.00 0 0 0.00 ALL 112 260 15.63 108 271 15.43 99 290 13.98 Evanston - 201 $ 0 $ 199,999 163 221 13.13 164 235 13.30 164 245 14.36 $ 200,000 $ 349,999 193 173 12.73 181 176 11.93 177 189 11.30 $ 350,000 $ 499,999 72 178 13.71 67 190 12.37 62 218 11.81 $ 500,000 $ 749,999 36 234 16.62 35 222 17.50 35 264 19.09 $ 750,000 $ 999,999 6 184 36.00 6 86 18.00 6 117 18.00 $ 1,000,000 $ 1,499,999 5 175 30.00 10 150 40.00 10 181 40.00 $ 1,500,000 and up 2 172 8.00 0 0 0.00 0 0 0.00 ALL 477 195 13.41 463 200 12.98 454 218 13.00 Flossmoor - 422 $ 0 $ 199,999 26 289 17.33 25 327 17.65 26 339 18.35 $ 200,000 $ 349,999 6 198 36.00 3 118 12.00 3 149 12.00 $ 350,000 $ 499,999 0 0 0.00 0 0 0.00 0 0 0.00 $ 500,000 $ 749,999 0 0 0.00 0 0 0.00 0 0 0.00 $ 750,000 $ 999,999 0 0 0.00 0 0 0.00 0 0 0.00 $ 1,000,000 $ 1,499,999 0 0 0.00 0 0 0.00 0 0 0.00 $ 1,500,000 and up 0 0 0.00 0 0 0.00 0 0 0.00 ALL 32 272 19.20 28 304 16.80 29 319 17.40 Data Source: MRED LLC (C) Copyright 2009, A.L. Wagner Appraisal Group, Inc. Midwest Real Estate Data, LLC (630) 416-6556 www.WagnerAppraisal.com Page 9
- 10. as of November 1, 2009 as of December 1, 2009 as of January 1, 2010 # Actives DOM Months Supply # Actives DOM Months Supply # Actives DOM Months Supply Fox Lake - 20 $ 0 $ 199,999 88 241 16.50 89 246 16.18 83 259 15.09 $ 200,000 $ 349,999 10 335 40.00 8 413 96.00 6 517 No Sales $ 350,000 $ 499,999 1 139 No Sales 1 169 No Sales 1 200 No Sales $ 500,000 $ 749,999 0 0 0.00 0 0 0.00 0 0 0.00 $ 750,000 $ 999,999 0 0 0.00 0 0 0.00 0 0 0.00 $ 1,000,000 $ 1,499,999 0 0 0.00 0 0 0.00 0 0 0.00 $ 1,500,000 and up 0 0 0.00 0 0 0.00 0 0 0.00 ALL 99 249 17.73 98 259 17.55 90 275 16.36 Frankfort, Green Garden - 423 $ 0 $ 199,999 20 193 9.60 18 227 8.00 18 265 9.00 $ 200,000 $ 349,999 62 258 27.56 56 288 22.40 57 356 22.80 $ 350,000 $ 499,999 35 461 420.00 34 470 408.00 21 482 252.00 $ 500,000 $ 749,999 5 137 No Sales 5 167 No Sales 5 198 No Sales $ 750,000 $ 999,999 0 0 0.00 0 0 0.00 0 0 0.00 $ 1,000,000 $ 1,499,999 0 0 0.00 0 0 0.00 0 0 0.00 $ 1,500,000 and up 0 0 0.00 0 0 0.00 0 0 0.00 ALL 122 300 27.62 113 328 23.38 101 358 22.04 Geneva - 134 $ 0 $ 199,999 17 372 13.60 17 368 13.60 15 329 13.85 $ 200,000 $ 349,999 49 298 18.38 54 269 21.60 47 278 18.19 $ 350,000 $ 499,999 19 442 76.00 18 476 72.00 16 502 64.00 $ 500,000 $ 749,999 2 338 24.00 2 368 24.00 2 399 24.00 $ 750,000 $ 999,999 0 0 0.00 0 0 0.00 0 0 0.00 $ 1,000,000 $ 1,499,999 0 0 0.00 0 0 0.00 0 0 0.00 $ 1,500,000 and up 0 0 0.00 0 0 0.00 0 0 0.00 ALL 87 345 20.47 91 331 22.29 80 335 20.00 Gilberts - 136 $ 0 $ 199,999 26 156 15.60 26 155 14.18 28 163 14.61 $ 200,000 $ 349,999 26 244 14.18 24 235 11.52 20 278 9.60 $ 350,000 $ 499,999 1 361 No Sales 1 391 No Sales 1 422 No Sales $ 500,000 $ 749,999 0 0 0.00 0 0 0.00 0 0 0.00 $ 750,000 $ 999,999 0 0 0.00 0 0 0.00 0 0 0.00 $ 1,000,000 $ 1,499,999 0 0 0.00 0 0 0.00 0 0 0.00 $ 1,500,000 and up 0 0 0.00 0 0 0.00 0 0 0.00 ALL 53 203 15.14 51 197 13.02 49 215 12.25 Data Source: MRED LLC (C) Copyright 2009, A.L. Wagner Appraisal Group, Inc. Midwest Real Estate Data, LLC (630) 416-6556 www.WagnerAppraisal.com Page 10
- 11. as of November 1, 2009 as of December 1, 2009 as of January 1, 2010 # Actives DOM Months Supply # Actives DOM Months Supply # Actives DOM Months Supply Glen Ellyn - 137 $ 0 $ 199,999 102 261 17.74 100 288 17.65 85 301 14.37 $ 200,000 $ 349,999 39 294 24.63 43 333 32.25 36 342 28.80 $ 350,000 $ 499,999 17 301 17.00 18 352 19.64 16 356 12.80 $ 500,000 $ 749,999 15 601 20.00 15 617 18.00 15 648 22.50 $ 750,000 $ 999,999 2 430 24.00 2 460 24.00 2 491 24.00 $ 1,000,000 $ 1,499,999 1 61 No Sales 1 91 No Sales 1 122 No Sales $ 1,500,000 and up 0 0 0.00 0 0 0.00 0 0 0.00 ALL 176 302 19.20 179 334 20.26 155 351 16.91 Glendale Heights - 139 $ 0 $ 199,999 153 193 11.06 146 201 10.07 142 221 10.33 $ 200,000 $ 349,999 36 265 27.00 33 278 30.46 32 270 29.54 $ 350,000 $ 499,999 0 0 0.00 0 0 0.00 0 0 0.00 $ 500,000 $ 749,999 0 0 0.00 0 0 0.00 0 0 0.00 $ 750,000 $ 999,999 0 0 0.00 0 0 0.00 0 0 0.00 $ 1,000,000 $ 1,499,999 0 0 0.00 0 0 0.00 0 0 0.00 $ 1,500,000 and up 0 0 0.00 0 0 0.00 0 0 0.00 ALL 189 207 12.46 179 215 11.49 174 230 11.73 Glenview, Golf - 25 $ 0 $ 199,999 89 246 14.43 76 266 11.54 72 292 10.41 $ 200,000 $ 349,999 56 210 12.00 61 233 14.64 58 234 13.92 $ 350,000 $ 499,999 47 224 20.89 48 226 24.00 35 213 15.00 $ 500,000 $ 749,999 47 296 24.52 40 324 20.00 35 278 21.00 $ 750,000 $ 999,999 1 26 12.00 2 76 24.00 3 81 36.00 $ 1,000,000 $ 1,499,999 0 0 0.00 0 0 0.00 0 0 0.00 $ 1,500,000 and up 0 0 0.00 0 0 0.00 0 0 0.00 ALL 240 242 15.91 227 257 15.30 203 256 13.38 Glenwood - 425 $ 0 $ 199,999 37 253 40.36 35 267 35.00 32 256 29.54 $ 200,000 $ 349,999 1 483 No Sales 1 513 No Sales 0 0 0.00 $ 350,000 $ 499,999 0 0 0.00 0 0 0.00 0 0 0.00 $ 500,000 $ 749,999 0 0 0.00 0 0 0.00 0 0 0.00 $ 750,000 $ 999,999 0 0 0.00 0 0 0.00 0 0 0.00 $ 1,000,000 $ 1,499,999 0 0 0.00 0 0 0.00 0 0 0.00 $ 1,500,000 and up 0 0 0.00 0 0 0.00 0 0 0.00 ALL 38 259 41.45 36 274 36.00 32 256 29.54 Data Source: MRED LLC (C) Copyright 2009, A.L. Wagner Appraisal Group, Inc. Midwest Real Estate Data, LLC (630) 416-6556 www.WagnerAppraisal.com Page 11
- 12. as of November 1, 2009 as of December 1, 2009 as of January 1, 2010 # Actives DOM Months Supply # Actives DOM Months Supply # Actives DOM Months Supply Grayslake, Hainesville - 30 $ 0 $ 199,999 110 225 12.94 98 242 11.64 98 242 11.20 $ 200,000 $ 349,999 37 182 31.71 31 181 26.57 28 194 24.00 $ 350,000 $ 499,999 2 111 24.00 2 141 24.00 2 172 24.00 $ 500,000 $ 749,999 0 0 0.00 0 0 0.00 0 0 0.00 $ 750,000 $ 999,999 0 0 0.00 0 0 0.00 0 0 0.00 $ 1,000,000 $ 1,499,999 0 0 0.00 0 0 0.00 0 0 0.00 $ 1,500,000 and up 0 0 0.00 0 0 0.00 0 0 0.00 ALL 149 213 15.28 131 226 13.55 128 231 12.80 Gurnee - 31 $ 0 $ 199,999 109 194 12.70 110 194 12.94 104 202 12.24 $ 200,000 $ 349,999 13 197 9.18 13 145 11.14 19 126 15.20 $ 350,000 $ 499,999 4 148 No Sales 3 197 No Sales 3 228 No Sales $ 500,000 $ 749,999 0 0 0.00 0 0 0.00 0 0 0.00 $ 750,000 $ 999,999 0 0 0.00 0 0 0.00 0 0 0.00 $ 1,000,000 $ 1,499,999 0 0 0.00 0 0 0.00 0 0 0.00 $ 1,500,000 and up 0 0 0.00 0 0 0.00 0 0 0.00 ALL 126 193 12.60 126 189 13.03 126 191 12.92 Hanover Park - 103 $ 0 $ 199,999 111 212 7.16 116 209 7.78 107 219 7.09 $ 200,000 $ 349,999 21 190 19.38 18 180 19.64 17 237 20.40 $ 350,000 $ 499,999 0 0 0.00 0 0 0.00 0 0 0.00 $ 500,000 $ 749,999 0 0 0.00 0 0 0.00 0 0 0.00 $ 750,000 $ 999,999 0 0 0.00 0 0 0.00 0 0 0.00 $ 1,000,000 $ 1,499,999 0 0 0.00 0 0 0.00 0 0 0.00 $ 1,500,000 and up 0 0 0.00 0 0 0.00 0 0 0.00 ALL 132 209 7.96 134 205 8.46 124 221 7.79 Highland Park - 35 $ 0 $ 199,999 15 201 20.00 14 245 18.67 16 227 27.43 $ 200,000 $ 349,999 46 299 36.80 41 322 30.75 40 344 32.00 $ 350,000 $ 499,999 24 205 48.00 20 276 40.00 19 275 38.00 $ 500,000 $ 749,999 16 248 64.00 14 290 28.00 10 301 20.00 $ 750,000 $ 999,999 17 507 204.00 16 533 192.00 15 582 180.00 $ 1,000,000 $ 1,499,999 1 143 No Sales 1 173 No Sales 4 255 No Sales $ 1,500,000 and up 3 468 36.00 3 498 36.00 1 796 12.00 ALL 122 294 41.83 109 334 33.54 105 344 35.00 Data Source: MRED LLC (C) Copyright 2009, A.L. Wagner Appraisal Group, Inc. Midwest Real Estate Data, LLC (630) 416-6556 www.WagnerAppraisal.com Page 12
- 13. as of November 1, 2009 as of December 1, 2009 as of January 1, 2010 # Actives DOM Months Supply # Actives DOM Months Supply # Actives DOM Months Supply Hinsdale - 521 $ 0 $ 199,999 6 265 7.20 3 74 3.27 5 101 6.00 $ 200,000 $ 349,999 26 358 20.80 27 322 20.25 22 388 15.53 $ 350,000 $ 499,999 6 306 12.00 8 329 16.00 8 360 16.00 $ 500,000 $ 749,999 15 364 60.00 13 398 52.00 13 429 52.00 $ 750,000 $ 999,999 2 68 12.00 2 98 12.00 1 78 6.00 $ 1,000,000 $ 1,499,999 3 257 No Sales 1 519 No Sales 1 550 No Sales $ 1,500,000 and up 0 0 0.00 0 0 0.00 0 0 0.00 ALL 58 329 19.33 54 323 17.05 50 363 15.79 Hoffman Estates - 194 $ 0 $ 199,999 121 196 9.49 125 199 9.74 126 225 9.82 $ 200,000 $ 349,999 55 173 10.82 58 175 11.60 50 200 9.38 $ 350,000 $ 499,999 1 115 No Sales 0 0 0.00 0 0 0.00 $ 500,000 $ 749,999 0 0 0.00 0 0 0.00 0 0 0.00 $ 750,000 $ 999,999 0 0 0.00 0 0 0.00 0 0 0.00 $ 1,000,000 $ 1,499,999 0 0 0.00 0 0 0.00 0 0 0.00 $ 1,500,000 and up 0 0 0.00 0 0 0.00 0 0 0.00 ALL 177 189 9.93 183 191 10.26 176 218 9.69 Homewood - 430 $ 0 $ 199,999 64 247 19.20 65 267 20.53 54 281 15.80 $ 200,000 $ 349,999 0 0 0.00 0 0 0.00 0 0 0.00 $ 350,000 $ 499,999 0 0 0.00 0 0 0.00 0 0 0.00 $ 500,000 $ 749,999 0 0 0.00 0 0 0.00 0 0 0.00 $ 750,000 $ 999,999 0 0 0.00 0 0 0.00 0 0 0.00 $ 1,000,000 $ 1,499,999 0 0 0.00 0 0 0.00 0 0 0.00 $ 1,500,000 and up 0 0 0.00 0 0 0.00 0 0 0.00 ALL 64 247 19.20 65 267 20.53 54 281 15.80 Huntley - 142 $ 0 $ 199,999 83 199 15.09 85 218 15.45 78 231 13.57 $ 200,000 $ 349,999 8 199 16.00 8 177 16.00 7 171 12.00 $ 350,000 $ 499,999 0 0 0.00 0 0 0.00 0 0 0.00 $ 500,000 $ 749,999 0 0 0.00 0 0 0.00 0 0 0.00 $ 750,000 $ 999,999 0 0 0.00 0 0 0.00 0 0 0.00 $ 1,000,000 $ 1,499,999 0 0 0.00 0 0 0.00 0 0 0.00 $ 1,500,000 and up 0 0 0.00 0 0 0.00 0 0 0.00 ALL 91 199 15.17 93 215 15.50 85 226 13.42 Data Source: MRED LLC (C) Copyright 2009, A.L. Wagner Appraisal Group, Inc. Midwest Real Estate Data, LLC (630) 416-6556 www.WagnerAppraisal.com Page 13
- 14. as of November 1, 2009 as of December 1, 2009 as of January 1, 2010 # Actives DOM Months Supply # Actives DOM Months Supply # Actives DOM Months Supply Indian Head Park - 531 $ 0 $ 199,999 14 372 7.30 17 341 8.50 15 373 6.43 $ 200,000 $ 349,999 35 290 18.26 29 340 15.82 26 324 15.60 $ 350,000 $ 499,999 4 340 12.00 3 283 7.20 2 341 4.00 $ 500,000 $ 749,999 1 224 6.00 1 254 6.00 1 285 6.00 $ 750,000 $ 999,999 0 0 0.00 0 0 0.00 0 0 0.00 $ 1,000,000 $ 1,499,999 0 0 0.00 0 0 0.00 0 0 0.00 $ 1,500,000 and up 0 0 0.00 0 0 0.00 0 0 0.00 ALL 54 314 12.46 50 335 11.32 44 341 9.43 Itasca - 143 $ 0 $ 199,999 7 127 12.00 6 132 10.29 8 96 13.71 $ 200,000 $ 349,999 29 214 12.89 30 224 14.40 25 251 11.54 $ 350,000 $ 499,999 5 343 60.00 5 373 60.00 4 389 48.00 $ 500,000 $ 749,999 1 184 No Sales 1 214 No Sales 0 0 0.00 $ 750,000 $ 999,999 0 0 0.00 0 0 0.00 0 0 0.00 $ 1,000,000 $ 1,499,999 0 0 0.00 0 0 0.00 0 0 0.00 $ 1,500,000 and up 0 0 0.00 0 0 0.00 0 0 0.00 ALL 42 214 14.40 42 228 15.27 37 233 13.06 Joliet - 499 $ 0 $ 199,999 168 209 10.61 182 208 11.26 164 234 10.36 $ 200,000 $ 349,999 23 211 55.20 22 224 52.80 17 209 68.00 $ 350,000 $ 499,999 0 0 0.00 0 0 0.00 0 0 0.00 $ 500,000 $ 749,999 0 0 0.00 0 0 0.00 0 0 0.00 $ 750,000 $ 999,999 0 0 0.00 0 0 0.00 0 0 0.00 $ 1,000,000 $ 1,499,999 0 0 0.00 0 0 0.00 0 0 0.00 $ 1,500,000 and up 0 0 0.00 0 0 0.00 0 0 0.00 ALL 191 209 11.75 204 210 12.30 181 232 11.25 LaGrange - 525 $ 0 $ 199,999 25 216 20.00 23 230 19.71 20 231 15.00 $ 200,000 $ 349,999 15 168 20.00 14 185 24.00 14 193 24.00 $ 350,000 $ 499,999 4 324 48.00 1 93 4.00 1 124 4.00 $ 500,000 $ 749,999 2 213 24.00 2 243 No Sales 0 0 0.00 $ 750,000 $ 999,999 0 0 0.00 0 0 0.00 0 0 0.00 $ 1,000,000 $ 1,499,999 0 0 0.00 0 0 0.00 0 0 0.00 $ 1,500,000 and up 0 0 0.00 0 0 0.00 0 0 0.00 ALL 46 209 21.23 40 212 20.00 35 213 16.15 Data Source: MRED LLC (C) Copyright 2009, A.L. Wagner Appraisal Group, Inc. Midwest Real Estate Data, LLC (630) 416-6556 www.WagnerAppraisal.com Page 14
- 15. as of November 1, 2009 as of December 1, 2009 as of January 1, 2010 # Actives DOM Months Supply # Actives DOM Months Supply # Actives DOM Months Supply Lake Bluff - 44 $ 0 $ 199,999 18 193 15.43 20 222 20.00 20 227 21.82 $ 200,000 $ 349,999 16 273 19.20 14 295 15.27 14 281 16.80 $ 350,000 $ 499,999 0 0 0.00 1 9 6.00 1 40 6.00 $ 500,000 $ 749,999 3 248 9.00 3 279 9.00 3 310 9.00 $ 750,000 $ 999,999 0 0 0.00 0 0 0.00 0 0 0.00 $ 1,000,000 $ 1,499,999 0 0 0.00 0 0 0.00 0 0 0.00 $ 1,500,000 and up 0 0 0.00 0 0 0.00 0 0 0.00 ALL 37 232 14.80 38 248 15.72 38 249 16.89 Lake Forest - 45 $ 0 $ 199,999 6 456 18.00 5 487 20.00 5 518 20.00 $ 200,000 $ 349,999 20 311 18.46 22 306 18.86 23 286 18.40 $ 350,000 $ 499,999 14 216 24.00 14 306 18.67 13 349 15.60 $ 500,000 $ 749,999 14 312 33.60 17 283 40.80 18 300 43.20 $ 750,000 $ 999,999 18 427 216.00 17 473 204.00 14 539 84.00 $ 1,000,000 $ 1,499,999 7 260 42.00 7 227 28.00 7 258 42.00 $ 1,500,000 and up 7 449 42.00 6 254 24.00 6 285 36.00 ALL 86 337 30.35 88 334 27.79 86 351 26.46 Lake In The Hills - 156 $ 0 $ 199,999 75 196 8.11 70 197 7.24 74 185 7.53 $ 200,000 $ 349,999 15 133 25.71 16 148 32.00 17 136 34.00 $ 350,000 $ 499,999 4 211 48.00 5 196 60.00 5 227 60.00 $ 500,000 $ 749,999 1 187 No Sales 1 217 No Sales 1 248 No Sales $ 750,000 $ 999,999 0 0 0.00 0 0 0.00 0 0 0.00 $ 1,000,000 $ 1,499,999 0 0 0.00 0 0 0.00 0 0 0.00 $ 1,500,000 and up 0 0 0.00 0 0 0.00 0 0 0.00 ALL 95 187 9.58 92 188 8.98 97 179 9.31 Lake Villa, Lindenhurst - 46 $ 0 $ 199,999 48 223 13.40 49 233 14.34 44 233 12.88 $ 200,000 $ 349,999 4 163 4.80 4 152 4.36 3 190 3.27 $ 350,000 $ 499,999 0 0 0.00 0 0 0.00 0 0 0.00 $ 500,000 $ 749,999 0 0 0.00 0 0 0.00 0 0 0.00 $ 750,000 $ 999,999 0 0 0.00 0 0 0.00 0 0 0.00 $ 1,000,000 $ 1,499,999 0 0 0.00 0 0 0.00 0 0 0.00 $ 1,500,000 and up 0 0 0.00 0 0 0.00 0 0 0.00 ALL 52 218 11.77 53 227 12.23 47 231 10.85 Data Source: MRED LLC (C) Copyright 2009, A.L. Wagner Appraisal Group, Inc. Midwest Real Estate Data, LLC (630) 416-6556 www.WagnerAppraisal.com Page 15
- 16. as of November 1, 2009 as of December 1, 2009 as of January 1, 2010 # Actives DOM Months Supply # Actives DOM Months Supply # Actives DOM Months Supply Lemont - 439 $ 0 $ 199,999 3 135 9.00 5 260 15.00 5 291 15.00 $ 200,000 $ 349,999 13 230 9.18 19 294 15.20 13 423 9.18 $ 350,000 $ 499,999 24 400 32.00 16 320 19.20 14 351 18.67 $ 500,000 $ 749,999 1 102 No Sales 1 132 No Sales 1 163 No Sales $ 750,000 $ 999,999 0 0 0.00 0 0 0.00 0 0 0.00 $ 1,000,000 $ 1,499,999 0 0 0.00 0 0 0.00 0 0 0.00 $ 1,500,000 and up 0 0 0.00 0 0 0.00 0 0 0.00 ALL 41 319 16.40 41 296 16.97 33 364 13.20 Libertyville, Green Oaks - 48 $ 0 $ 199,999 26 217 18.35 28 189 19.76 25 219 15.79 $ 200,000 $ 349,999 25 181 13.04 25 183 15.00 29 188 18.32 $ 350,000 $ 499,999 17 216 51.00 13 273 52.00 14 270 56.00 $ 500,000 $ 749,999 2 135 24.00 2 165 24.00 2 99 24.00 $ 750,000 $ 999,999 0 0 0.00 0 0 0.00 0 0 0.00 $ 1,000,000 $ 1,499,999 0 0 0.00 0 0 0.00 0 0 0.00 $ 1,500,000 and up 0 0 0.00 0 0 0.00 0 0 0.00 ALL 70 201 18.67 68 202 19.90 70 213 20.00 Lisle - 532 $ 0 $ 199,999 171 223 15.91 169 232 16.49 154 247 14.33 $ 200,000 $ 349,999 15 306 5.45 13 351 4.88 11 353 4.55 $ 350,000 $ 499,999 14 521 56.00 14 551 56.00 14 582 56.00 $ 500,000 $ 749,999 2 55 8.00 2 85 12.00 2 116 12.00 $ 750,000 $ 999,999 0 0 0.00 0 0 0.00 0 0 0.00 $ 1,000,000 $ 1,499,999 0 0 0.00 0 0 0.00 0 0 0.00 $ 1,500,000 and up 0 0 0.00 0 0 0.00 0 0 0.00 ALL 202 248 14.43 198 261 14.85 181 278 13.33 Lockport, Homer Township - 495 $ 0 $ 199,999 51 219 5.14 52 192 5.38 45 184 4.91 $ 200,000 $ 349,999 25 330 11.11 28 308 12.92 27 350 13.50 $ 350,000 $ 499,999 2 239 24.00 2 269 24.00 2 300 24.00 $ 500,000 $ 749,999 0 0 0.00 0 0 0.00 0 0 0.00 $ 750,000 $ 999,999 0 0 0.00 0 0 0.00 0 0 0.00 $ 1,000,000 $ 1,499,999 0 0 0.00 0 0 0.00 0 0 0.00 $ 1,500,000 and up 0 0 0.00 0 0 0.00 0 0 0.00 ALL 78 255 6.37 82 234 6.88 74 248 6.58 Data Source: MRED LLC (C) Copyright 2009, A.L. Wagner Appraisal Group, Inc. Midwest Real Estate Data, LLC (630) 416-6556 www.WagnerAppraisal.com Page 16
- 17. as of November 1, 2009 as of December 1, 2009 as of January 1, 2010 # Actives DOM Months Supply # Actives DOM Months Supply # Actives DOM Months Supply Lombard - 148 $ 0 $ 199,999 103 230 12.00 105 250 11.89 110 251 13.07 $ 200,000 $ 349,999 67 170 12.37 96 122 19.53 89 125 19.07 $ 350,000 $ 499,999 5 420 15.00 10 149 40.00 9 174 54.00 $ 500,000 $ 749,999 0 0 0.00 0 0 0.00 0 0 0.00 $ 750,000 $ 999,999 0 0 0.00 0 0 0.00 0 0 0.00 $ 1,000,000 $ 1,499,999 0 0 0.00 0 0 0.00 0 0 0.00 $ 1,500,000 and up 0 0 0.00 0 0 0.00 0 0 0.00 ALL 175 213 12.21 211 187 15.07 208 194 15.70 Long Grove, Lake Zurich, Hawthorn Woods, Kildeer - 47 $ 0 $ 199,999 4 180 5.33 6 148 8.00 6 166 10.29 $ 200,000 $ 349,999 26 163 12.48 21 187 10.08 22 204 12.00 $ 350,000 $ 499,999 13 282 31.20 14 299 33.60 13 311 31.20 $ 500,000 $ 749,999 0 0 0.00 0 0 0.00 0 0 0.00 $ 750,000 $ 999,999 0 0 0.00 0 0 0.00 0 0 0.00 $ 1,000,000 $ 1,499,999 0 0 0.00 0 0 0.00 0 0 0.00 $ 1,500,000 and up 0 0 0.00 0 0 0.00 0 0 0.00 ALL 43 200 12.90 41 219 12.30 41 232 14.06 Lyons - 534 $ 0 $ 199,999 34 185 27.20 22 284 20.31 25 268 23.08 $ 200,000 $ 349,999 8 107 No Sales 9 122 No Sales 9 104 108.00 $ 350,000 $ 499,999 0 0 0.00 0 0 0.00 0 0 0.00 $ 500,000 $ 749,999 0 0 0.00 0 0 0.00 0 0 0.00 $ 750,000 $ 999,999 0 0 0.00 0 0 0.00 0 0 0.00 $ 1,000,000 $ 1,499,999 0 0 0.00 0 0 0.00 0 0 0.00 $ 1,500,000 and up 0 0 0.00 0 0 0.00 0 0 0.00 ALL 42 170 33.60 31 237 28.62 34 224 29.14 McHenry, Lake Moor, McCullom Lake, Ringwood, Sunnyside, Johnsburg - 50 $ 0 $ 199,999 140 255 15.70 133 278 15.35 120 301 13.21 $ 200,000 $ 349,999 7 373 21.00 4 223 9.60 4 254 12.00 $ 350,000 $ 499,999 0 0 0.00 0 0 0.00 0 0 0.00 $ 500,000 $ 749,999 0 0 0.00 0 0 0.00 0 0 0.00 $ 750,000 $ 999,999 0 0 0.00 0 0 0.00 0 0 0.00 $ 1,000,000 $ 1,499,999 0 0 0.00 0 0 0.00 0 0 0.00 $ 1,500,000 and up 0 0 0.00 0 0 0.00 0 0 0.00 ALL 147 261 15.75 137 276 14.95 124 300 13.05 Data Source: MRED LLC (C) Copyright 2009, A.L. Wagner Appraisal Group, Inc. Midwest Real Estate Data, LLC (630) 416-6556 www.WagnerAppraisal.com Page 17
- 18. as of November 1, 2009 as of December 1, 2009 as of January 1, 2010 # Actives DOM Months Supply # Actives DOM Months Supply # Actives DOM Months Supply Melrose Park - 160 $ 0 $ 199,999 16 261 11.29 11 320 6.60 12 243 7.58 $ 200,000 $ 349,999 18 270 No Sales 18 287 No Sales 19 314 No Sales $ 350,000 $ 499,999 2 189 No Sales 2 219 No Sales 1 241 No Sales $ 500,000 $ 749,999 2 335 No Sales 2 365 No Sales 2 396 No Sales $ 750,000 $ 999,999 0 0 0.00 0 0 0.00 0 0 0.00 $ 1,000,000 $ 1,499,999 0 0 0.00 0 0 0.00 0 0 0.00 $ 1,500,000 and up 0 0 0.00 0 0 0.00 0 0 0.00 ALL 38 265 26.82 33 298 19.80 34 292 21.47 Mokena - 448 $ 0 $ 199,999 26 194 14.18 24 183 11.08 23 207 10.22 $ 200,000 $ 349,999 37 269 10.09 38 286 11.69 42 268 12.92 $ 350,000 $ 499,999 4 281 No Sales 5 182 60.00 6 183 72.00 $ 500,000 $ 749,999 0 0 0.00 0 0 0.00 0 0 0.00 $ 750,000 $ 999,999 0 0 0.00 0 0 0.00 0 0 0.00 $ 1,000,000 $ 1,499,999 0 0 0.00 0 0 0.00 0 0 0.00 $ 1,500,000 and up 0 0 0.00 0 0 0.00 0 0 0.00 ALL 67 240 12.18 67 241 12.18 71 241 12.72 Montgomery - 538 $ 0 $ 199,999 67 192 9.14 63 218 8.89 64 228 9.37 $ 200,000 $ 349,999 0 0 0.00 0 0 0.00 0 0 0.00 $ 350,000 $ 499,999 0 0 0.00 0 0 0.00 0 0 0.00 $ 500,000 $ 749,999 0 0 0.00 0 0 0.00 0 0 0.00 $ 750,000 $ 999,999 0 0 0.00 0 0 0.00 0 0 0.00 $ 1,000,000 $ 1,499,999 0 0 0.00 0 0 0.00 0 0 0.00 $ 1,500,000 and up 0 0 0.00 0 0 0.00 0 0 0.00 ALL 67 192 9.14 63 218 8.89 64 228 9.37 Morton Grove - 53 $ 0 $ 199,999 47 363 31.33 46 357 32.47 43 374 27.16 $ 200,000 $ 349,999 44 225 17.03 45 217 16.36 43 237 15.18 $ 350,000 $ 499,999 14 217 28.00 13 259 39.00 14 271 84.00 $ 500,000 $ 749,999 0 0 0.00 0 0 0.00 0 0 0.00 $ 750,000 $ 999,999 0 0 0.00 0 0 0.00 0 0 0.00 $ 1,000,000 $ 1,499,999 0 0 0.00 0 0 0.00 0 0 0.00 $ 1,500,000 and up 0 0 0.00 0 0 0.00 0 0 0.00 ALL 105 286 22.91 104 284 23.11 100 301 21.82 Data Source: MRED LLC (C) Copyright 2009, A.L. Wagner Appraisal Group, Inc. Midwest Real Estate Data, LLC (630) 416-6556 www.WagnerAppraisal.com Page 18
- 19. as of November 1, 2009 as of December 1, 2009 as of January 1, 2010 # Actives DOM Months Supply # Actives DOM Months Supply # Actives DOM Months Supply Mount Prospect - 56 $ 0 $ 199,999 131 255 12.99 125 265 12.30 126 263 12.50 $ 200,000 $ 349,999 56 211 14.93 53 214 13.83 49 231 12.51 $ 350,000 $ 499,999 12 229 144.00 17 280 204.00 13 348 156.00 $ 500,000 $ 749,999 0 0 0.00 0 0 0.00 2 17 No Sales $ 750,000 $ 999,999 0 0 0.00 0 0 0.00 0 0 0.00 $ 1,000,000 $ 1,499,999 0 0 0.00 0 0 0.00 0 0 0.00 $ 1,500,000 and up 0 0 0.00 0 0 0.00 0 0 0.00 ALL 199 241 14.30 195 252 13.85 190 258 13.49 Mundelein - 60 $ 0 $ 199,999 45 222 8.57 44 243 8.66 46 229 9.36 $ 200,000 $ 349,999 34 323 21.47 33 330 19.80 36 320 24.00 $ 350,000 $ 499,999 17 676 204.00 18 667 216.00 18 698 216.00 $ 500,000 $ 749,999 2 175 No Sales 2 205 No Sales 2 236 No Sales $ 750,000 $ 999,999 0 0 0.00 0 0 0.00 0 0 0.00 $ 1,000,000 $ 1,499,999 0 0 0.00 0 0 0.00 0 0 0.00 $ 1,500,000 and up 0 0 0.00 0 0 0.00 0 0 0.00 ALL 98 335 14.17 97 351 14.20 102 344 15.69 Naperville - 540 $ 0 $ 199,999 269 190 10.31 267 209 10.30 238 227 9.10 $ 200,000 $ 349,999 160 149 8.73 149 158 8.20 136 177 7.73 $ 350,000 $ 499,999 23 162 25.09 22 191 22.00 21 207 19.38 $ 500,000 $ 749,999 24 366 41.14 20 379 24.00 21 380 25.20 $ 750,000 $ 999,999 1 69 No Sales 1 99 No Sales 1 130 No Sales $ 1,000,000 $ 1,499,999 1 467 No Sales 1 497 No Sales 1 528 No Sales $ 1,500,000 and up 3 416 No Sales 3 446 No Sales 3 477 No Sales ALL 481 186 10.48 463 201 10.08 421 220 9.22 New Lenox - 451 $ 0 $ 199,999 21 163 9.33 23 172 11.50 20 168 9.60 $ 200,000 $ 349,999 65 151 52.00 67 176 53.60 64 201 59.08 $ 350,000 $ 499,999 1 483 No Sales 1 513 No Sales 0 0 0.00 $ 500,000 $ 749,999 0 0 0.00 0 0 0.00 0 0 0.00 $ 750,000 $ 999,999 0 0 0.00 0 0 0.00 0 0 0.00 $ 1,000,000 $ 1,499,999 0 0 0.00 0 0 0.00 0 0 0.00 $ 1,500,000 and up 0 0 0.00 0 0 0.00 0 0 0.00 ALL 87 158 24.86 91 179 28.00 84 193 26.53 Data Source: MRED LLC (C) Copyright 2009, A.L. Wagner Appraisal Group, Inc. Midwest Real Estate Data, LLC (630) 416-6556 www.WagnerAppraisal.com Page 19