
Empfohlen
Weitere ähnliche Inhalte
Kürzlich hochgeladen
Kürzlich hochgeladen (20)
Empfohlen
Empfohlen (20)
Strategic Mgt Tools
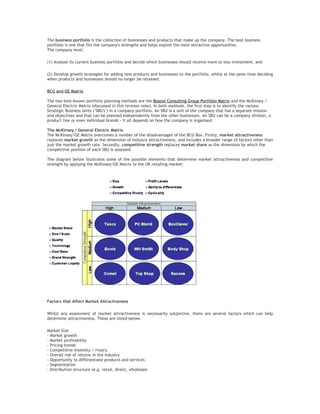
- 1. The business portfolio is the collection of businesses and products that make up the company. The best business portfolio is one that fits the company's strengths and helps exploit the most attractive opportunities. The company must: (1) Analyse its current business portfolio and decide which businesses should receive more or less investment, and (2) Develop growth strategies for adding new products and businesses to the portfolio, whilst at the same time deciding when products and businesses should no longer be retained. BCG and GE Matrix The two best-known portfolio planning methods are the Boston Consulting Group Portfolio Matrix and the McKinsey / General Electric Matrix (discussed in this revision note). In both methods, the first step is to identify the various Strategic Business Units ("SBU's") in a company portfolio. An SBU is a unit of the company that has a separate mission and objectives and that can be planned independently from the other businesses. An SBU can be a company division, a product line or even individual brands - it all depends on how the company is organised. The McKinsey / General Electric Matrix The McKinsey/GE Matrix overcomes a number of the disadvantages of the BCG Box. Firstly, market attractiveness replaces market growth as the dimension of industry attractiveness, and includes a broader range of factors other than just the market growth rate. Secondly, competitive strength replaces market share as the dimension by which the competitive position of each SBU is assessed. The diagram below illustrates some of the possible elements that determine market attractiveness and competitive strength by applying the McKinsey/GE Matrix to the UK retailing market: Factors that Affect Market Attractiveness Whilst any assessment of market attractiveness is necessarily subjective, there are several factors which can help determine attractiveness. These are listed below: Market Size - Market growth - Market profitability - Pricing trends - Competitive intensity / rivalry - Overall risk of returns in the industry - Opportunity to differentiate products and services - Segmentation - Distribution structure (e.g. retail, direct, wholesale
- 2. Factors that Affect Competitive Strength Factors to consider include: - Strength of assets and competencies - Relative brand strength - Market share - Customer loyalty - Relative cost position (cost structure compared with competitors) - Distribution strength - Record of technological or other innovation - Access to financial and other investment resources Porter’s 5 forces Defining an industry An industry is a group of firms that market products which are close substitutes for each other (e.g. the car industry, the travel industry). Some industries are more profitable than others. Why? The answer lies in understanding the dynamics of competitive structure in an industry. The most influential analytical model for assessing the nature of competition in an industry is Michael Porter's Five Forces Model, which is described below: Porter explains that there are five forces that determine industry attractiveness and long-run industry profitability. These five "competitive forces" are - The threat of entry of new competitors (new entrants) - The threat of substitutes - The bargaining power of buyers - The bargaining power of suppliers - The degree of rivalry between existing competitors Threat of New Entrants New entrants to an industry can raise the level of competition, thereby reducing its attractiveness. The threat of new entrants largely depends on the barriers to entry. High entry barriers exist in some industries (e.g. shipbuilding) whereas other industries are very easy to enter (e.g. estate agency, restaurants). Key barriers to entry include - Economies of scale - Capital / investment requirements - Customer switching costs
- 3. - Access to industry distribution channels - The likelihood of retaliation from existing industry players. Threat of Substitutes The presence of substitute products can lower industry attractiveness and profitability because they limit price levels. The threat of substitute products depends on: - Buyers' willingness to substitute - The relative price and performance of substitutes - The costs of switching to substitutes Bargaining Power of Suppliers Suppliers are the businesses that supply materials & other products into the industry. The cost of items bought from suppliers (e.g. raw materials, components) can have a significant impact on a company's profitability. If suppliers have high bargaining power over a company, then in theory the company's industry is less attractive. The bargaining power of suppliers will be high when: - There are many buyers and few dominant suppliers - There are undifferentiated, highly valued products - Suppliers threaten to integrate forward into the industry (e.g. brand manufacturers threatening to set up their own retail outlets) - Buyers do not threaten to integrate backwards into supply - The industry is not a key customer group to the suppliers Bargaining Power of Buyers Buyers are the people / organisations who create demand in an industry The bargaining power of buyers is greater when - There are few dominant buyers and many sellers in the industry - Products are standardised - Buyers threaten to integrate backward into the industry - Suppliers do not threaten to integrate forward into the buyer's industry - The industry is not a key supplying group for buyers Intensity of Rivalry The intensity of rivalry between competitors in an industry will depend on: - The structure of competition - for example, rivalry is more intense where there are many small or equally sized competitors; rivalry is less when an industry has a clear market leader - The structure of industry costs - for example, industries with high fixed costs encourage competitors to fill unused capacity by price cutting - Degree of differentiation - industries where products are commodities (e.g. steel, coal) have greater rivalry; industries where competitors can differentiate their products have less rivalry - Switching costs - rivalry is reduced where buyers have high switching costs - i.e. there is a significant cost associated with the decision to buy a product from an alternative supplier - Strategic objectives - when competitors are pursuing aggressive growth strategies, rivalry is more intense. Where competitors are "milking" profits in a mature industry, the degree of rivalry is less
- 4. - Exit barriers - when barriers to leaving an industry are high (e.g. the cost of closing down factories) - then competitors tend to exhibit greater rivalry. Introduction Value Chain Analysis describes the activities that take place in a business and relates them to an analysis of the competitive strength of the business. Influential work by Michael Porter suggested that the activities of a business could be grouped under two headings: (1) Primary Activities - those that are directly concerned with creating and delivering a product (e.g. component assembly); and (2) Support Activities, which whilst they are not directly involved in production, may increase effectiveness or efficiency (e.g. human resource management). It is rare for a business to undertake all primary and support activities. Value Chain Analysis is one way of identifying which activities are best undertaken by a business and which are best provided by others ("out sourced"). Linking Value Chain Analysis to Competitive Advantage What activities a business undertakes is directly linked to achieving competitive advantage. For example, a business which wishes to outperform its competitors through differentiating itself through higher quality will have to perform its value chain activities better than the opposition. By contrast, a strategy based on seeking cost leadership will require a reduction in the costs associated with the value chain activities, or a reduction in the total amount of resources used. Primary Activities Primary value chain activities include: Primary Activity Description Inbound logistics All those activities concerned with receiving and storing externally sourced materials Operations The manufacture of products and services - the way in which resource inputs (e.g. materials) are converted to outputs (e.g. products) Outbound logistics All those activities associated with getting finished goods and services to buyers Marketing and sales Essentially an information activity - informing buyers and consumers about products and services (benefits, use, price etc.) Service All those activities associated with maintaining product performance after the product has been sold Support Activities Support activities include: Secondary Activity Description Procurement This concerns how resources are acquired for a business (e.g. sourcing and negotiating with materials suppliers) Human Resource Those activities concerned with recruiting, developing, motivating and rewarding the workforce Management of a business Technology Activities concerned with managing information processing and the development and protection Development of "knowledge" in a business
- 5. Infrastructure Concerned with a wide range of support systems and functions such as finance, planning, quality control and general senior management Steps in Value Chain Analysis Value chain analysis can be broken down into a three sequential steps: (1) Break down a market/organisation into its key activities under each of the major headings in the model; (2) Assess the potential for adding value via cost advantage or differentiation, or identify current activities where a business appears to be at a competitive disadvantage; (3) Determine strategies built around focusing on activities where competitive advantage can be sustained product portfolio strategy - introduction to the boston consulting box Introduction The business portfolio is the collection of businesses and products that make up the company. The best business portfolio is one that fits the company's strengths and helps exploit the most attractive opportunities. The company must: (1) Analyse its current business portfolio and decide which businesses should receive more or less investment, and (2) Develop growth strategies for adding new products and businesses to the portfolio, whilst at the same time deciding when products and businesses should no longer be retained. Methods of Portfolio Planning The two best-known portfolio planning methods are from the Boston Consulting Group (the subject of this revision note) and by General Electric/Shell. In each method, the first step is to identify the various Strategic Business Units ("SBU's") in a company portfolio. An SBU is a unit of the company that has a separate mission and objectives and that can be planned independently from the other businesses. An SBU can be a company division, a product line or even individual brands - it all depends on how the company is organised. The Boston Consulting Group Box ("BCG Box") The Boston Consulting Group Box ("BCG Box")
- 6. Using the BCG Box (an example is illustrated above) a company classifies all its SBU's according to two dimensions: On the horizontal axis: relative market share - this serves as a measure of SBU strength in the market On the vertical axis: market growth rate - this provides a measure of market attractiveness By dividing the matrix into four areas, four types of SBU can be distinguished: Stars - Stars are high growth businesses or products competing in markets where they are relatively strong compared with the competition. Often they need heavy investment to sustain their growth. Eventually their growth will slow and, assuming they maintain their relative market share, will become cash cows. Cash Cows - Cash cows are low-growth businesses or products with a relatively high market share. These are mature, successful businesses with relatively little need for investment. They need to be managed for continued profit - so that they continue to generate the strong cash flows that the company needs for its Stars. Question marks - Question marks are businesses or products with low market share but which operate in higher growth markets. This suggests that they have potential, but may require substantial investment in order to grow market share at the expense of more powerful competitors. Management have to think hard about "question marks" - which ones should they invest in? Which ones should they allow to fail or shrink? Dogs - Unsurprisingly, the term "dogs" refers to businesses or products that have low relative share in unattractive, low-growth markets. Dogs may generate enough cash to break-even, but they are rarely, if ever, worth investing in. Using the BCG Box to determine strategy Once a company has classified its SBU's, it must decide what to do with them. In the diagram above, the company has one large cash cow (the size of the circle is proportional to the SBU's sales), a large dog and two, smaller stars and question marks. Conventional strategic thinking suggests there are four possible strategies for each SBU: (1) Build Share: here the company can invest to increase market share (for example turning a "question mark" into a star) (2) Hold: here the company invests just enough to keep the SBU in its present position (3) Harvest: here the company reduces the amount of investment in order to maximise the short-term cash flows and profits from the SBU. This may have the effect of turning Stars into Cash Cows. (4) Divest: the company can divest the SBU by phasing it out or selling it - in order to use the resources elsewhere (e.g. investing in the more promising "question marks").