Stock Research Report for SBUX as of 9/8/11 - Chaikin Power Tools
•
1 gefällt mir•134 views

To order a free Chaikin Power Gauge stock research report for SBUX go to http://www.chaikinpowertools.com/reports

Empfohlen
Weitere ähnliche Inhalte
Mehr von Dan Oconnor
Mehr von Dan Oconnor (9)
Kürzlich hochgeladen
Kürzlich hochgeladen (20)
Stock Research Report for SBUX as of 9/8/11 - Chaikin Power Tools
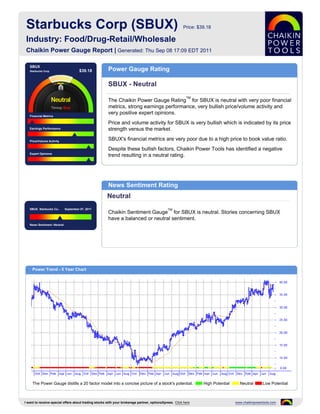
- 1. Starbucks Corp (SBUX) Price: $39.18 Industry: Food/Drug-Retail/Wholesale Chaikin Power Gauge Report | Generated: Thu Sep 08 17:09 EDT 2011 SBUX Starbucks Corp $39.18 Power Gauge Rating SBUX - Neutral TM The Chaikin Power Gauge Rating for SBUX is neutral with very poor financial metrics, strong earnings performance, very bullish price/volume activity and very positive expert opinions. Financial Metrics Price and volume activity for SBUX is very bullish which is indicated by its price Earnings Performance strength versus the market. Price/Volume Activity SBUX's financial metrics are very poor due to a high price to book value ratio. Despite these bullish factors, Chaikin Power Tools has identified a negative Expert Opinions trend resulting in a neutral rating. News Sentiment Rating Neutral SBUX Starbucks Co.. September 07, 2011 TM Chaikin Sentiment Gauge for SBUX is neutral. Stories concerning SBUX have a balanced or neutral sentiment. News Sentiment :Neutral Power Trend - 5 Year Chart The Power Gauge distills a 20 factor model into a concise picture of a stock's potential. High Potential Neutral Low Potential I want to receive special offers about trading stocks with your brokerage partner, optionsXpress. Click here www.chaikinpowertools.com
- 2. Financials & Earnings Financial Metrics Financial Metrics Rating LT Debt/Equity Ratio Very Bearish Price to Book Value SBUX's financial metrics are very poor. The company may be overvalued and has relatively low revenue per share. Return on Equity The rank is based on a low long term debt to equity ratio, high price to book value ratio, high return on equity, high price to sales ratio and relatively low cash flow. Price to Sales Ratio Business Value Assets and Liabilities Valuation Returns Ratio TTM Ratio TTM Ratio TTM Current Ratio 1.93 Price/Book 6.76 Return on Invest 25.1% LT Debt/Equity 0.15 Price/Sales 2.73 Return on Equity 28.4% Earnings Performance Earnings Performance Rating Earnings Growth Bullish Earnings Surprise SBUX's earnings performance has been strong. The company has a stable 5 year earnings trend and has a history of strong earnings growth. Earnings Trend The rank is based on high earnings growth over the past 3-5 years, an upward trend in earnings this year, a relatively high projected P/E ratio and consistent Projected P/E Ratio earnings over the past 5 years. Earnings Consistency 5 Year Revenue and Earnings Growth EPS Estimates 09/06 09/07 09/08 09/09 09/10 Factor Actual EPS Prev EST EPS Current Change Revenue(M) 7,786.94 9,411.50 10,383.00 9,774.60 10,707.40 Quarterly EPS $0.37 $0.37 0.00 Rev % Growth 22.26% 20.86% 10.32% -5.86% 9.54% Yearly EPS $1.24 $1.52 +0.28 EPS $0.71 $0.87 $0.43 $0.52 $1.24 Factor Actual EPS Growth Est EPS Growth Change EPS % Growth 16.39% 22.54% -50.57% 20.93% 138.46% 3-5 year EPS 11.43% 15.88% +4.45 EPS Surprise EPS Quarterly Results Estimate Actual Difference % Difference FY Qtr 1 Qtr 2 Qtr 3 Qtr 4 Total Latest Qtr $0.34 $0.36 $0.02 5.88 09/09 $0.09 $0.03 $0.20 $0.20 $0.52 1 Qtr Ago $0.34 $0.34 $0.00 0.00 09/10 $0.32 $0.28 $0.27 $0.37 $1.24 2 Qtr Ago $0.39 $0.45 $0.06 15.38 09/11 $0.45 $0.34 $0.36 - - 3 Qtr Ago $0.32 $0.37 $0.05 15.63 Fiscal Year End Month is September. I want to receive special offers about trading stocks with your brokerage partner, optionsXpress. Click here www.chaikinpowertools.com
- 3. Price Trend & Expert Opinions Price/Volume Activity Price/Volume Activity Rating Relative Strength vs Market Very Bullish Chaikin Money Flow Price and volume activity for SBUX is very bullish. SBUX has outperformed the S&P 500 over 26 weeks and has a rising price trend. Price Trend The rank for SBUX is based on its price strength versus the market, positive Price Trend ROC Chaikin money flow, a positive Chaikin price trend, a negative Chaikin price trend ROC and an increasing volume trend. Volume Trend Relative Strength vs S&P500 Index Chaikin Money Flow Chart shows whether SBUX is performing better or worse than the market. Chaikin Money Flow analyzes supply and demand for a company's stock. Price Activity Price Activity Volume Activity Factor Value Factor Value Factor Value 52 Week High 40.95 % Change Price - 4 Weeks 12.72% Average Volume 20 Days 8,035,103 52 Week Low 24.78 % Change Price - 24 Weeks 6.79% Average Volume 90 Days 7,393,697 % Change YTD Rel S&P 500 25.00% % Change Price - 4 Wks Rel to S&P 5.39% Chaikin Money Flow Persistency 58% % Change Price - 24 Wks Rel to S&P 15.60% Expert Opinions Expert Opinions Earnings Estimate Revisions Very Bullish Short Interest Expert opinions about SBUX are very positive. Shorting of SBUX is low and analysts's opinions on SBUX have been more positive recently. Insider Activity The rank for SBUX is based on analysts revising earnings estimates upward, a low short interest ratio, optimistic analyst opinions and price strength of the stock Analyst Opinions versus the Food/Drug-Retail/Wholesale industry group. Relative Strength vs Industry Earnings Estimate Revisions Analyst Recommendations EPS Estimates Revision Summary Current 7 Days Ago % Change Factor Value Last Week Last 4 Weeks Current Qtr 0.37 0.37 0.00% Mean this Week Buy Up Down Up Down Next Qtr 0.51 0.51 0.00% Mean Last Week Buy Curr Qtr 0 0 0 0 Curr Yr 0 0 0 0 Current 30 Days Ago % Change Change 0.00 Next Qtr 0 0 0 0 Current FY 1.52 1.52 0.00 Mean 5 Weeks Ago Buy Next Yr 0 0 0 0 I want to receive special offers about trading stocks with your brokerage partner, optionsXpress. Click here www.chaikinpowertools.com
- 4. The Company & Its Competitors SBUX's Competitors in Food/Drug-Retail/Wholesale News Headlines for SBUX Company Power Historic EPS Projected EPS Profit Margin PEG PE Revenue(M) BRIEF: Starbucks pays $75K in suit filed by Gauge growth growth woman with dwarfism - Aug 18, 2011 SBUX 11.43% 15.88% 10.14% 1.63 25.78 10,707 BRIEF: Starbucks pays $75K in suit filed by MCD 3.37% 9.70% 20.56% 1.76 18.08 24,075 woman with dwarfism - Aug 18, 2011 Starbucks Response to Georgia Company THI 11.64% 13.50% 23.53% 1.48 21.64 2,573 Expanded Product Recall - Jul 26, 2011 WEN 41.74% 18.75% -0.06% 1.93 42.08 3,416 Starbucks Response to Georgia Company Product Recall - Jul 19, 2011 EAT -7.24% 13.50% 5.11% 0.85 13.72 2,761 Starbucks Launches New Iced Refreshment, YUM 4.05% 11.10% 10.38% 1.70 20.29 11,343 Lunch and Snacks - Jul 12, 2011 CBRL -2.19% 10.75% 3.91% 0.88 10.28 - DRI 5.85% 12.23% 6.35% 0.95 13.02 7,500 Company Details Company Profile STARBUCKS CORP Starbucks Corporation purchases and roasts high-quality whole bean coffees and sells P O BOX 34067 them along with fresh, rich-brewed, Italian style espresso beverages, a variety of pastries SEATTLE, WA 98134 and confections, and coffee-related equipments primarily through its company-operated USA retail stores. In addition to sales through its company-operated retail stores, Starbucks Phone: 2064471575 sells whole bean coffees through a specialty sales group and supermarkets. Additionally, Fax: 206-682-7570 Starbucks produces and sells bottled Frappuccino coffee drink and a line of premium ice Website: creams through its joint venture partnerships and offers a line of innovative premium teas http://http://www.starbucks.com produced by its wholly owned subsidiary, Tazo Tea Company. The company's objective Full Time Employees: 137,000 is to establish Starbucks as the most recognized and respected brand in the world. Sector: Retail/Wholesale Power Gauge Ratings are created using a relative ranking system that assigns a rank of 0 to 100 (100 being the highest) to each stock in the universe. Rank is calculated by evaluating each of the stocks factors and combining them into a single number using a weighting formula. A stock's rank ranges from 100-0, where 100 is the strongest, and a rank of 95 indicates the stock is better than 95% of the stocks in the universe. Chaikin Stock Research(CSR) is not registered as a securities broker dealer or investment advisor with either the U.S. Securities and Exchange Commission or with any state securities regulatory authority. CSR is not responsible for trades executed by users of this research report, our web site or mobile app based on the information included herein. The information presented in this report does not represent a recommendation to buy or sell stocks or any financial instrument nor is it intended as an endorsement of any security or investment. The information in this report is generic by nature and is not personalized to the specific financial situation of any individual. The user bears complete responsibility for their own investment research and should seek the advice of a qualified investment professional before making any investment decisions. Copyright (c) 1978-(Present) by ZACKS Investment Research, Inc ("ZACKS"). The information, data, analyses and opinions contained herein (1) includes the confidential and proprietary information of ZACKS, (2) may not be copied or redistributed, for any purpose, (3) does not constitute investment advice offered by ZACKS, (4) are provided solely for informational purposes, and (5) are not warranted or represented to be correct, complete, accurate or timely. ZACKS shall not be responsible for investment decisions, damages or other losses resulting from, or related to, use of this information, data, analyses or opinions. Past performance is no guarantee of future performance. ZACKS is not affiliated with Chaikin Power Tools. This report from Chaikin Power Tools is for informational purposes only and is not a recommendation to buy or sell securities. LM 2.3 DS 3.0 LS 2.1 Data Provided by ZACKS Investment Research, Inc., www.zacks.com Special offers to trade stocks from optionsXpress: www.chaikinpowertools.com