Stock Research Report for CRM as of 9/8/11 - Chaikin Power Tools
•
1 like•207 views

To order a free Chaikin Power Gauge stock research report for CRM go to http://www.chaikinpowertools.com/reports

Recommended
Recommended
More Related Content
Recently uploaded
Recently uploaded (20)
Featured
Featured (20)
Stock Research Report for CRM as of 9/8/11 - Chaikin Power Tools
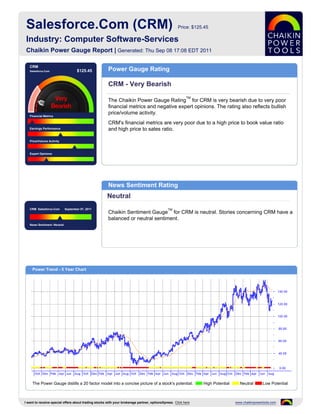
- 1. Salesforce.Com (CRM) Price: $125.45 Industry: Computer Software-Services Chaikin Power Gauge Report | Generated: Thu Sep 08 17:08 EDT 2011 CRM Salesforce.Com $125.45 Power Gauge Rating CRM - Very Bearish TM The Chaikin Power Gauge Rating for CRM is very bearish due to very poor financial metrics and negative expert opinions. The rating also reflects bullish price/volume activity. Financial Metrics CRM's financial metrics are very poor due to a high price to book value ratio Earnings Performance and high price to sales ratio. Price/Volume Activity Expert Opinions News Sentiment Rating Neutral CRM Salesforce.Com September 07, 2011 TM Chaikin Sentiment Gauge for CRM is neutral. Stories concerning CRM have a balanced or neutral sentiment. News Sentiment :Neutral Power Trend - 5 Year Chart The Power Gauge distills a 20 factor model into a concise picture of a stock's potential. High Potential Neutral Low Potential I want to receive special offers about trading stocks with your brokerage partner, optionsXpress. Click here www.chaikinpowertools.com
- 2. Financials & Earnings Financial Metrics Financial Metrics Rating LT Debt/Equity Ratio Very Bearish Price to Book Value CRM's financial metrics are very poor. The company may be overvalued and has relatively low revenue per share. Return on Equity The rank is based on a low long term debt to equity ratio, high price to book value ratio, low return on equity, high price to sales ratio and relatively low cash flow. Price to Sales Ratio Business Value Assets and Liabilities Valuation Returns Ratio TTM Ratio TTM Ratio TTM Current Ratio 0.61 Price/Book 11.13 Return on Invest 4.0% LT Debt/Equity 0.39 Price/Sales 10.14 Return on Equity 4.8% Earnings Performance Earnings Performance Rating Earnings Growth Neutral Earnings Surprise CRM's earnings performance has been neutral. The company has a history of strong earnings growth and experienced relatively poor earnings growth in the past 12 months. Earnings Trend The rank is based on high earnings growth over the past 3-5 years, a relatively Projected P/E Ratio poor trend in earnings this year, a relatively high projected P/E ratio and consistent earnings over the past 5 years. Earnings Consistency 5 Year Revenue and Earnings Growth EPS Estimates 01/07 01/08 01/09 01/10 01/11 Factor Actual EPS Prev EST EPS Current Change Revenue(M) 497.10 748.70 1,076.77 1,305.58 1,657.14 Quarterly EPS $0.16 $0.03 -0.13 Rev % Growth 60.43% 50.61% 43.82% 21.25% 26.93% Yearly EPS $0.50 $0.20 -0.30 EPS $0.00 $0.16 $0.36 $0.65 $0.50 Factor Actual EPS Growth Est EPS Growth Change EPS % Growth - - 125.00% 80.56% -23.08% 3-5 year EPS 40.61% 29.00% -11.61 EPS Surprise EPS Quarterly Results Estimate Actual Difference % Difference FY Qtr 1 Qtr 2 Qtr 3 Qtr 4 Total Latest Qtr $0.03 $0.07 $0.04 133.33 01/09 $0.15 $0.17 $0.17 $0.16 $0.65 1 Qtr Ago $0.05 $0.06 $0.01 20.00 01/10 $0.14 $0.11 $0.16 $0.08 $0.49 2 Qtr Ago $0.12 $0.12 $0.00 0.00 01/11 $0.00 $-0.03 - - - 3 Qtr Ago $0.19 $0.20 $0.01 5.26 Fiscal Year End Month is January. I want to receive special offers about trading stocks with your brokerage partner, optionsXpress. Click here www.chaikinpowertools.com
- 3. Price Trend & Expert Opinions Price/Volume Activity Price/Volume Activity Rating Relative Strength vs Market Bullish Chaikin Money Flow Price and volume activity for CRM is bullish. CRM is experiencing sustained buying and has outperformed the S&P 500 over 26 weeks. Price Trend The rank for CRM is based on its price strength versus the market, positive Price Trend ROC Chaikin money flow, a negative Chaikin price trend ROC and an increasing volume trend. Volume Trend Relative Strength vs S&P500 Index Chaikin Money Flow Chart shows whether CRM is performing better or worse than the market. Chaikin Money Flow analyzes supply and demand for a company's stock. Price Activity Price Activity Volume Activity Factor Value Factor Value Factor Value 52 Week High 159.32 % Change Price - 4 Weeks -2.16% Average Volume 20 Days 3,748,005 52 Week Low 99.91 % Change Price - 24 Weeks 2.73% Average Volume 90 Days 2,674,183 % Change YTD Rel S&P 500 0.32% % Change Price - 4 Wks Rel to S&P -8.52% Chaikin Money Flow Persistency 69% % Change Price - 24 Wks Rel to S&P 11.21% Expert Opinions Expert Opinions Earnings Estimate Revisions Bearish Short Interest Expert opinions about CRM are negative. Insiders are not net buyers of CRM's stock and short interest in CRM is high. Insider Activity The rank for CRM is based on a high short interest ratio, insiders not purchasing significant amounts of stock and optimistic analyst opinions. Analyst Opinions Relative Strength vs Industry Earnings Estimate Revisions Analyst Recommendations EPS Estimates Revision Summary Current 7 Days Ago % Change Factor Value Last Week Last 4 Weeks Current Qtr 0.03 0.03 0.00% Mean this Week Buy Up Down Up Down Next Qtr 0.08 0.08 0.00% Mean Last Week Buy Curr Qtr 0 1 7 3 Curr Yr 1 1 5 8 Current 30 Days Ago % Change Change 0.00 Next Qtr 1 1 4 8 Current FY 0.20 0.24 -0.04 Mean 5 Weeks Ago Buy Next Yr 2 3 4 8 I want to receive special offers about trading stocks with your brokerage partner, optionsXpress. Click here www.chaikinpowertools.com
- 4. The Company & Its Competitors CRM's Competitors in Computer Software-Services News Headlines for CRM Company Power Historic EPS Projected EPS Profit Margin PEG PE Revenue(M) Blackboard Launches Corporate Sales Training Gauge growth growth Solution Integrated with Salesforce CRM - Aug CRM 40.61% 29.00% 1.46% 21.63 278.80 1,657 31, 2011 MSFT 9.84% 11.08% 33.10% 0.84 9.85 69,943 BRIEF: Salesforce buys SaaS co Navajo Systems - Aug 28, 2011 CA 3.31% 12.00% 18.64% 0.83 10.61 4,429 BRIEF: Salesforce buys SaaS co Navajo INTU 10.53% 14.00% 16.46% 1.30 21.80 3,851 Systems - Aug 28, 2011 M5 Networks Partners With Bluewolf to Launch ORCL 20.32% 15.00% 23.99% 0.80 13.03 35,622 Business SMS for Salesforce - Aug 15, 2011 SYMC 8.78% 9.00% 9.49% 1.26 13.37 6,190 Jitterbit Reports Record Breaking Quarter Driven SAP 10.55% 13.00% 14.45% 1.08 15.65 17,003 by New Product I - Aug 10, 2011 INFY 23.83% 16.80% 24.50% 1.02 18.47 6,041 Company Details Company Profile SALESFORCE.COM Salesforce.com is the market and technology leader in on-demand business services. THE LANDMARK ONE MARKET The company's Salesforce suite of on-demand CRM applications allows customers to STREET STE.300 manage and share all of their sales, support, marketing and partner information on- SAN FRANCISCO, CA 94105 demand. The Salesforce Platform, the world's first on- demand platform, enables USA customers, developers and partners to build powerful new on-demand applications that Fax: 415-901-7040 extend beyond CRM to deliver the benefits of multi-tenancy and The Business Web Website: across the enterprise. The Salesforce Platform allows applications to be easily shared, http://http://www.salesforce.com exchanged and installed with a few simple clicks via salesforce.com's AppExchange Full Time Employees: 5,306 directory. Customers can also take advantage of Successforce, salesforce.com's world- Sector: Computer and Technology class training, support, consulting and best practices offerings. Power Gauge Ratings are created using a relative ranking system that assigns a rank of 0 to 100 (100 being the highest) to each stock in the universe. Rank is calculated by evaluating each of the stocks factors and combining them into a single number using a weighting formula. A stock's rank ranges from 100-0, where 100 is the strongest, and a rank of 95 indicates the stock is better than 95% of the stocks in the universe. Chaikin Stock Research(CSR) is not registered as a securities broker dealer or investment advisor with either the U.S. Securities and Exchange Commission or with any state securities regulatory authority. CSR is not responsible for trades executed by users of this research report, our web site or mobile app based on the information included herein. The information presented in this report does not represent a recommendation to buy or sell stocks or any financial instrument nor is it intended as an endorsement of any security or investment. The information in this report is generic by nature and is not personalized to the specific financial situation of any individual. The user bears complete responsibility for their own investment research and should seek the advice of a qualified investment professional before making any investment decisions. Copyright (c) 1978-(Present) by ZACKS Investment Research, Inc ("ZACKS"). The information, data, analyses and opinions contained herein (1) includes the confidential and proprietary information of ZACKS, (2) may not be copied or redistributed, for any purpose, (3) does not constitute investment advice offered by ZACKS, (4) are provided solely for informational purposes, and (5) are not warranted or represented to be correct, complete, accurate or timely. ZACKS shall not be responsible for investment decisions, damages or other losses resulting from, or related to, use of this information, data, analyses or opinions. Past performance is no guarantee of future performance. ZACKS is not affiliated with Chaikin Power Tools. This report from Chaikin Power Tools is for informational purposes only and is not a recommendation to buy or sell securities. LM 2.3 DS 3.0 LS 2.1 Data Provided by ZACKS Investment Research, Inc., www.zacks.com Special offers to trade stocks from optionsXpress: www.chaikinpowertools.com