Weitere ähnliche Inhalte Ähnlich wie Market watch march 2013 Ähnlich wie Market watch march 2013 (20) Mehr von Chaba Tamasi (20) Kürzlich hochgeladen (20) 1. For All TREB Member Inquiries:
(416) 443-8152
For All Media/Public Inquiries:
March 2013 (416) 443-8158
Economic Indicators Average Price up in March and First Quarter TorontoMLS Sales Activity1,7
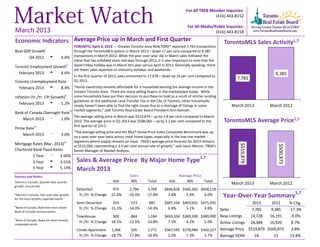
TORONTO, April 3, 2013 – Greater Toronto Area REALTORS® reported 7,765 transactions
Real GDP Growthi through the TorontoMLS system in March 2013 – down 17 per cent compared to 9,385
Q4 2012 t 0.6% transactions in March 2012. While the year-over-year dip in March sales followed the
trend that has unfolded since mid-way through 2012, it is also important to note that the
Toronto Employment Growthi i Good Friday holiday was in March this year versus April in 2012. Generally speaking, there
are fewer sales reported on statutory holidays and weekends.
February 2013 t 4.6% 9,385
In the first quarter of 2013, sales amounted to 17,678 – down by 14 per cent compared to
Q1 2012.
7,765
Toronto Unemployment Rate
February 2013 t 8.4% "Home ownership remains affordable for a household earning the average income in the
Greater Toronto Area. There are many willing buyers in the marketplace today. While
Inflation (Yr./Yr. CPI Growth)i i some households have put their decision to purchase on hold as a result of stricter lending
guidelines or the additional Land Transfer Tax in the City of Toronto, other households
February 2013 t 1.2% simply haven’t been able to find the right house due to a shortage of listings in some
March 2013 March 2012
iii market segments," said Toronto Real Estate Board President Ann Hannah.
Bank of Canada Overnight Rate
The average selling price in March was $519,879 – up by 3.8 per cent compared to March
March 2013 q 1.0% 2012. The average price in Q1 2013 was $508,066 – up by 3.2 per cent compared to the TorontoMLS Average Price1,7
iv first quarter of 2012.
Prime Rate
"The average selling price and the MLS® Home Price Index Composite Benchmark was up
March 2013 q 3.0% on a year-over-year basis across most home types, especially in the low-rise market
iv segments where supply remains an issue. TREB's average price forecast for 2013 remains
Mortgage Rates (Mar. 2013)
$519,879
$500,875
at $515,000, representing a 3.5 per cent annual rate of growth," said Jason Mercer, TREB's
Chartered Bank Fixed Rates Senior Manager of Market Analysis.
1 Year q 3.00% 1,7
3 Year u 3.55% Sales & Average Price By Major Home Type
5 Year u 5.14% March 2013
Sources and Notes: Sales Average Price
i
Statistics Canada, Quarter-over-quarter 416 905 Total 416 905 Total
March 2013 March 2012
growth, annualized
Detached 975 2,794 3,769 $846,828 $592,265 $658,118
1,7
ii
Statistics Canada, Year-over-year growth
for the most recently reported month
Yr./Yr. % Change -21.6% -16.4% -17.8% 2.8% 5.4% 4.0% Year-Over-Year Summary
Semi-Detached 314 573 887 $607,334 $403,031 $475,355 2013 2012 % Chg.
iii
Bank of Canada, Rate from most recent Yr./Yr. % Change -15.1% -14.0% -14.4% 6.9% 3.1% 4.6%
Bank of Canada announcement
Sales 7,765 9,385 -17.3%
Townhouse 300 884 1,184 $450,104 $369,590 $389,990 New Listings 14,728 16,191 -9.0%
iv
Bank of Canada, Rates for most recently
Yr./Yr. % Change -18.5% -13.5% -14.8% 7.5% 4.2% 5.0% Active Listings 18,384 16,920 8.7%
completed month
Condo Apartment 1,266 505 1,771 $367,595 $278,984 $342,327 Average Price $519,879 $500,875 3.8%
Yr./Yr. % Change -18.7% -17.8% -18.4% 2.0% 1.3% 1.7% Average DOM 24 21 13.8%
2. Toronto Real Estate Board
SALES BY PRICE RANGE AND HOUSE TYPE1,7 MARCH 2013
Price Range Detached Semi-Detached Att/Row/Twnhouse Condo Townhouse Condo Apt Link Co-op Apt Det Condo Co-ownership Apt Total
$0 to $99,999 1 0 0 2 16 0 1 0 1 21
$100,000 to $199,999 41 9 4 39 227 1 0 0 1 322
$200,000 to $299,999 227 62 81 182 573 21 1 1 3 1,151
$300,000 to $399,999 507 242 205 211 548 30 3 2 0 1,748
$400,000 to $499,999 706 320 169 82 215 34 0 2 0 1,528
$500,000 to $599,999 660 119 90 29 82 34 2 1 0 1,017
$600,000 to $699,999 498 65 41 12 45 11 0 2 0 674
$700,000 to $799,999 342 24 12 8 26 2 0 0 0 414
$800,000 to $899,999 240 20 6 1 8 0 0 0 0 275
$900,000 to $999,999 129 11 3 2 7 0 1 0 0 153
$1,000,000 to $1,249,999 149 8 1 0 12 0 0 0 0 170
$1,250,000 to $1,499,999 109 3 2 0 7 0 0 0 0 121
$1,500,000 to $1,749,999 64 2 0 0 1 0 0 0 0 67
$1,750,000 to $1,999,999 31 0 1 0 0 0 0 0 0 32
$2,000,000 + 65 2 0 1 4 0 0 0 0 72
Total Sales 3,769 887 615 569 1,771 133 8 8 5 7,765
Share of Total Sales 48.5% 11.4% 7.9% 7.3% 22.8% 1.7% 0.1% 0.1% 0.1% -
Average Price $658,118 $475,355 $433,340 $343,136 $342,327 $441,088 $418,300 $475,063 $190,900 $519,879
SALES BY PRICE RANGE AND HOUSE TYPE1,7 YEAR-TO-DATE, 2013
Price Range Detached Semi-Detached Att/Row/Twnhouse Condo Townhouse Condo Apt Link Co-op Apt Det Condo Co-ownership Apt Total
$0 to $99,999 5 0 1 7 43 0 3 0 1 60
$100,000 to $199,999 93 24 6 100 551 1 9 0 2 786
$200,000 to $299,999 569 135 190 405 1,388 51 4 4 7 2,753
$300,000 to $399,999 1,201 560 515 490 1,255 79 5 2 3 4,110
$400,000 to $499,999 1,640 692 412 174 496 73 1 4 0 3,492
$500,000 to $599,999 1,541 262 185 62 184 59 2 2 0 2,297
$600,000 to $699,999 1,040 122 80 25 90 23 1 2 0 1,383
$700,000 to $799,999 738 52 32 19 48 2 0 0 0 891
$800,000 to $899,999 489 40 12 7 18 0 0 0 0 566
$900,000 to $999,999 276 24 8 7 19 0 1 0 0 335
$1,000,000 to $1,249,999 344 22 4 2 19 0 0 0 0 391
$1,250,000 to $1,499,999 229 5 2 0 12 0 0 0 0 248
$1,500,000 to $1,749,999 131 7 1 0 4 0 0 0 0 143
$1,750,000 to $1,999,999 71 3 1 0 1 0 0 0 0 76
$2,000,000 + 137 4 0 1 5 0 0 0 0 147
Total Sales 8,504 1,952 1,449 1,299 4,133 288 26 14 13 17,678
Share of Total Sales 48.1% 11.0% 8.2% 7.3% 23.4% 1.6% 0.1% 0.1% 0.1% -
Average Price $644,512 $472,865 $427,175 $342,191 $332,846 $424,387 $275,535 $428,607 $238,531 $508,066
Page 3 July 2010
Market Watch, March 2013 2
3. Toronto Real Estate Board
ALL HOME TYPES, MARCH 2013
SUMMARY OF EXISTING HOME TRANSACTIONS
ALL TREB AREAS
1 1 1 2 8 3 4 5
Number of Sales Dollar Volume Average Price Median Price New Listings SNLR (Trend) Active Listings Mos. Inv. (Trend)9 Avg. SP/LP Avg. DOM
TREB Total 7,765 $4,036,861,247 $519,879 $437,000 14,728 52.7% 18,384 2.7 98% 24
Halton Region 615 $371,387,341 $603,882 $505,000 1,080 56.1% 1,362 2.6 97% 25
Burlington 105 $54,260,910 $516,771 $449,000 167 58.2% 229 2.8 98% 31
Halton Hills 90 $45,284,200 $503,158 $475,000 137 63.5% 202 2.5 98% 28
Milton 185 $87,587,138 $473,444 $440,000 323 55.5% 299 2.0 99% 18
Oakville 235 $184,255,093 $784,064 $640,000 453 53.4% 632 3.0 97% 28
Peel Region 1,670 $758,199,061 $454,011 $420,000 3,291 51.3% 3,938 2.6 98% 25
Brampton 753 $315,780,016 $419,363 $405,000 1,495 50.5% 1,687 2.5 98% 24
Caledon 74 $41,641,784 $562,727 $527,500 164 49.0% 277 4.2 97% 37
Mississauga 843 $400,777,261 $475,418 $434,500 1,632 52.1% 1,974 2.5 98% 24
City of Toronto 2,891 $1,632,817,557 $564,793 $441,000 5,513 49.9% 7,119 2.9 99% 24
! TURN PAGE FOR CITY OF TORONTO
TABLES OR CLICK HERE:
York Region 1,405 $862,973,926 $614,216 $558,000 2,867 51.2% 3,602 2.7 98% 25
Aurora 84 $48,103,749 $572,664 $528,450 162 57.3% 221 2.4 98% 17
E. Gwillimbury 36 $18,767,867 $521,330 $460,750 47 56.3% 79 3.4 98% 35
Georgina 75 $24,534,000 $327,120 $322,000 122 65.5% 169 3.1 98% 34
King 16 $13,650,235 $853,140 $699,868 64 40.0% 158 6.8 97% 34
Markham 354 $211,153,396 $596,479 $560,000 771 50.7% 885 2.6 99% 21
Newmarket 128 $62,238,738 $486,240 $449,250 209 67.6% 206 1.6 99% 23
Richmond Hill 299 $216,177,830 $723,003 $643,500 630 47.0% 719 2.8 98% 23
Vaughan 354 $230,223,661 $650,349 $602,850 744 48.6% 951 2.8 97% 26
Whitchurch-Stouffville 59 $38,124,450 $646,177 $518,000 118 47.4% 214 3.7 97% 39
Durham Region 948 $329,008,544 $347,055 $327,000 1,508 64.8% 1,559 2.0 98% 21
Ajax 174 $66,669,545 $383,158 $358,075 271 66.4% 223 1.5 99% 19
Brock 17 $3,982,000 $234,235 $190,000 40 45.2% 106 7.5 96% 58
Clarington 154 $48,226,424 $313,159 $290,250 223 68.4% 236 2.0 99% 19
Oshawa 241 $68,568,500 $284,517 $268,000 378 66.5% 337 1.8 98% 20
Pickering 110 $45,701,916 $415,472 $399,500 188 62.2% 208 2.0 98% 24
Scugog 19 $6,967,500 $366,711 $346,000 39 55.7% 88 4.4 96% 39
Uxbridge 32 $13,345,725 $417,054 $397,500 56 54.7% 108 4.3 96% 51
Whitby 201 $75,546,934 $375,855 $355,000 313 66.6% 253 1.5 99% 14
Dufferin County 47 $14,723,900 $313,274 $297,500 86 69.4% 153 2.5 98% 33
Orangeville 47 $14,723,900 $313,274 $297,500 86 69.4% 153 2.5 98% 33
Simcoe County 189 $67,750,918 $358,470 $345,000 383 58.4% 651 3.8 98% 41
Adjala-Tosorontio 10 $5,321,000 $532,100 $507,500 31 48.4% 75 6.7 99% 113
Bradford West Gwillimbury 72 $28,517,999 $396,083 $383,500 116 56.9% 150 2.7 98% 25
Essa 16 $4,855,290 $303,456 $265,000 53 62.5% 95 4.3 98% 45
Innisfil 45 $14,641,750 $325,372 $303,000 94 56.8% 174 4.4 97% 50
New Tecumseth 46 $14,414,879 $313,367 $300,750 89 63.4% 157 3.3 97% 40
Page 3 July 2010
Market Watch, March 2013 3
4. Toronto Real Estate Board
ALL HOME TYPES, MARCH 2013
SUMMARY OF EXISTING HOME TRANSACTIONS
CITY OF TORONTO MUNICIPAL BREAKDOWN
1 1 1 2 8 3 4 5
Number of Sales Dollar Volume Average Price Median Price New Listings SNLR (Trend) Active Listings Mos. Inv. (Trend)9 Avg. SP/LP Avg. DOM
TREB Total 7,765 $4,036,861,247 $519,879 $437,000 14,728 52.7% 18,384 2.7 98% 24
City of Toronto Total 2,891 $1,632,817,557 $564,793 $441,000 5,513 49.9% 7,119 2.9 99% 24
Toronto West 743 $358,953,021 $483,113 $425,000 1,339 53.6% 1,801 2.8 100% 25
Toronto W01 44 $27,559,277 $626,347 $478,000 65 52.5% 91 2.6 102% 21
Toronto W02 105 $61,655,636 $587,197 $539,900 117 65.9% 87 1.4 103% 17
Toronto W03 59 $24,868,274 $421,496 $400,000 104 63.3% 108 1.9 102% 18
Toronto W04 69 $24,365,400 $353,122 $329,000 106 58.2% 136 2.7 99% 30
Toronto W05 87 $33,963,109 $390,381 $405,000 182 56.3% 249 2.9 98% 23
Toronto W06 89 $41,879,825 $470,560 $417,000 279 37.8% 507 4.6 100% 31
Toronto W07 27 $20,868,400 $772,904 $730,000 41 68.0% 35 1.4 100% 14
Toronto W08 150 $87,253,750 $581,692 $490,000 245 54.2% 340 2.8 99% 25
Toronto W09 38 $14,042,800 $369,547 $385,750 63 55.6% 75 2.8 98% 30
Toronto W10 75 $22,496,550 $299,954 $258,000 137 53.5% 173 2.9 98% 33
Toronto Central 1,319 $891,982,642 $676,257 $457,000 2,737 44.7% 3,863 3.4 98% 26
Toronto C01 349 $163,769,711 $469,254 $395,000 899 39.8% 1,272 4.0 98% 29
Toronto C02 48 $51,084,900 $1,064,269 $840,000 120 42.0% 253 4.3 98% 22
Toronto C03 47 $45,301,891 $963,870 $688,000 70 54.8% 104 2.5 99% 22
Toronto C04 94 $107,775,765 $1,146,551 $1,161,000 155 49.5% 213 2.7 99% 24
Toronto C06 31 $18,674,829 $602,414 $620,400 75 47.3% 101 3.2 98% 29
Toronto C07 81 $48,806,835 $602,554 $488,000 179 42.6% 296 3.5 99% 22
Toronto C08 147 $68,878,906 $468,564 $401,000 264 45.9% 338 3.1 99% 24
Toronto C09 20 $24,476,900 $1,223,845 $795,000 30 55.6% 66 2.8 97% 33
Toronto C10 52 $31,446,399 $604,738 $503,500 109 54.7% 123 2.1 102% 16
Toronto C11 38 $24,683,746 $649,572 $335,000 56 55.2% 73 2.5 98% 27
Toronto C12 41 $85,702,888 $2,090,314 $1,980,000 74 37.7% 147 5.3 97% 28
Toronto C13 68 $39,486,504 $580,684 $408,750 112 56.3% 133 2.2 100% 28
Toronto C14 163 $100,152,987 $614,436 $435,000 329 41.6% 432 3.6 98% 26
Toronto C15 140 $81,740,381 $583,860 $437,450 265 47.4% 312 3.0 98% 25
Toronto East 829 $381,881,894 $460,654 $440,000 1,437 56.8% 1,455 2.1 100% 21
Toronto E01 83 $47,587,982 $573,349 $571,000 140 57.9% 122 1.7 104% 13
Toronto E02 76 $51,528,383 $678,005 $632,050 106 59.2% 93 1.5 102% 13
Toronto E03 81 $49,431,593 $610,267 $570,000 133 57.1% 118 1.7 102% 20
Toronto E04 97 $35,458,891 $365,556 $403,000 187 58.1% 190 2.3 100% 25
Toronto E05 94 $38,897,176 $413,800 $351,750 142 60.4% 120 1.9 99% 22
Toronto E06 41 $23,098,350 $563,374 $499,000 65 54.4% 51 1.8 99% 18
Toronto E07 80 $31,357,338 $391,967 $416,500 151 51.9% 172 2.8 99% 25
Toronto E08 55 $23,761,700 $432,031 $402,000 84 56.8% 114 2.6 99% 31
Toronto E09 103 $33,713,530 $327,316 $295,000 202 55.1% 211 2.6 98% 23
Toronto E10 51 $23,516,899 $461,116 $465,000 94 57.1% 116 2.2 99% 20
Toronto E11 68 $23,530,052 $346,030 $334,250 133 56.5% 148 2.4 98% 21
Page 3 July 2010
Market Watch, March 2013 4
5. Toronto Real Estate Board
ALL HOME TYPES, YEAR-TO-DATE 2013
SUMMARY OF EXISTING HOME TRANSACTIONS
ALL TREB AREAS
1 1 1 2 4 5
Number of Sales Dollar Volume Average Price Median Price New Listings Avg. SP/LP Avg. DOM
TREB Total 17,678 $8,981,586,198 $508,066 $428,000 36,330 98% 28
Halton Region 1,375 $800,499,654 $582,182 $485,000 2,642 98% 29
Burlington 216 $111,824,959 $517,708 $449,500 400 98% 34
Halton Hills 212 $98,249,511 $463,441 $437,000 362 98% 32
Milton 438 $201,599,420 $460,273 $431,950 771 99% 23
Oakville 509 $388,825,764 $763,901 $629,000 1,109 97% 31
Peel Region 3,779 $1,697,948,735 $449,312 $407,000 7,976 98% 29
Brampton 1,646 $685,415,636 $416,413 $390,000 3,545 98% 28
Caledon 154 $87,552,676 $568,524 $517,500 391 97% 40
Mississauga 1,979 $924,980,423 $467,398 $415,000 4,040 98% 28
City of Toronto 6,570 $3,598,784,869 $547,760 $430,944 14,014 99% 28
! TURN PAGE FOR CITY OF TORONTO
TABLES OR CLICK HERE:
York Region 3,258 $1,950,542,383 $598,693 $545,000 6,854 98% 29
Aurora 179 $101,505,751 $567,071 $515,000 393 98% 23
E. Gwillimbury 71 $35,040,367 $493,526 $457,000 123 97% 38
Georgina 163 $50,536,259 $310,038 $310,000 272 98% 39
King 44 $35,860,465 $815,011 $673,868 172 96% 48
Markham 825 $493,275,781 $597,910 $556,800 1,725 98% 28
Newmarket 303 $144,273,093 $476,149 $453,500 513 99% 23
Richmond Hill 689 $478,803,371 $694,925 $633,888 1,460 97% 29
Vaughan 827 $521,962,525 $631,152 $579,000 1,845 97% 29
Whitchurch-Stouffville 157 $89,284,771 $568,693 $495,000 351 97% 37
Durham Region 2,179 $753,608,471 $345,851 $325,000 3,713 98% 24
Ajax 380 $142,701,957 $375,531 $350,000 661 99% 21
Brock 34 $8,038,400 $236,424 $193,750 102 96% 58
Clarington 342 $103,960,753 $303,979 $282,000 573 98% 23
Oshawa 551 $154,508,708 $280,415 $267,000 886 98% 24
Pickering 253 $102,589,340 $405,491 $386,500 473 99% 24
Scugog 63 $23,928,100 $379,811 $355,000 123 97% 45
Uxbridge 69 $32,536,725 $471,547 $419,900 142 96% 44
Whitby 487 $185,344,488 $380,584 $357,500 753 99% 19
Dufferin County 107 $34,768,400 $324,938 $320,000 235 98% 33
Orangeville 107 $34,768,400 $324,938 $320,000 235 98% 33
Simcoe County 410 $145,433,686 $354,716 $332,500 896 97% 48
Adjala-Tosorontio 26 $12,793,888 $492,073 $411,250 74 98% 74
Bradford West Gwillimbury 141 $54,732,637 $388,175 $375,000 280 98% 30
Essa 38 $11,218,190 $295,216 $249,450 105 97% 69
Innisfil 91 $30,574,692 $335,986 $320,000 226 97% 58
New Tecumseth 114 $36,114,279 $316,792 $289,500 211 97% 49
Page 3 July 2010
Market Watch, March 2013 5
6. Toronto Real Estate Board
ALL HOME TYPES, YEAR-TO-DATE 2013
SUMMARY OF EXISTING HOME TRANSACTIONS
CITY OF TORONTO MUNICIPAL BREAKDOWN
1 1 1 2 4 5
Number of Sales Dollar Volume Average Price Median Price New Listings Avg. SP/LP Avg. DOM
TREB Total 17,678 $8,981,586,198 $508,066 $428,000 36,330 98% 28
City of Toronto Total 6,570 $3,598,784,869 $547,760 $430,944 14,014 99% 28
Toronto West 1,662 $766,955,197 $461,465 $412,000 3,436 99% 30
Toronto W01 92 $52,896,977 $574,967 $420,000 196 101% 23
Toronto W02 194 $110,555,848 $569,876 $549,500 275 102% 21
Toronto W03 137 $57,051,024 $416,431 $399,000 246 100% 25
Toronto W04 155 $59,030,155 $380,840 $358,000 264 98% 36
Toronto W05 199 $74,635,859 $375,055 $398,550 414 98% 33
Toronto W06 213 $95,232,714 $447,102 $389,989 790 98% 34
Toronto W07 60 $41,687,950 $694,799 $680,000 97 101% 18
Toronto W08 317 $181,346,560 $572,071 $465,000 659 99% 28
Toronto W09 112 $41,589,400 $371,334 $365,000 169 98% 34
Toronto W10 183 $52,928,710 $289,228 $258,000 326 97% 35
Toronto Central 2,998 $1,977,308,655 $659,543 $457,500 7,163 98% 30
Toronto C01 773 $355,312,372 $459,654 $394,000 2,170 98% 32
Toronto C02 122 $124,404,100 $1,019,706 $851,000 377 98% 27
Toronto C03 102 $91,092,029 $893,059 $682,608 212 99% 22
Toronto C04 215 $238,587,665 $1,109,710 $1,050,000 471 99% 22
Toronto C06 62 $39,312,089 $634,066 $668,000 164 97% 30
Toronto C07 221 $119,952,523 $542,772 $406,000 538 98% 32
Toronto C08 302 $136,515,494 $452,038 $387,250 671 99% 29
Toronto C09 56 $75,022,400 $1,339,686 $972,500 124 98% 25
Toronto C10 130 $77,652,144 $597,324 $487,450 275 101% 22
Toronto C11 104 $70,983,210 $682,531 $361,250 170 99% 34
Toronto C12 83 $161,456,788 $1,945,263 $1,842,000 231 97% 29
Toronto C13 154 $94,340,590 $612,601 $440,000 291 99% 27
Toronto C14 388 $231,383,375 $596,349 $429,000 840 98% 33
Toronto C15 286 $161,293,876 $563,965 $463,750 629 98% 29
Toronto East 1,910 $854,521,017 $447,393 $425,000 3,415 100% 25
Toronto E01 188 $110,468,170 $587,597 $572,500 352 103% 17
Toronto E02 157 $106,675,973 $679,465 $629,100 276 101% 11
Toronto E03 197 $112,220,495 $569,647 $525,000 350 101% 19
Toronto E04 234 $84,433,487 $360,827 $390,000 411 99% 27
Toronto E05 193 $77,327,252 $400,659 $347,300 298 99% 27
Toronto E06 85 $48,013,950 $564,870 $479,000 152 99% 21
Toronto E07 173 $66,392,925 $383,774 $360,000 317 100% 35
Toronto E08 134 $54,899,816 $409,700 $397,000 229 98% 29
Toronto E09 235 $75,262,998 $320,268 $295,000 459 98% 28
Toronto E10 126 $56,082,499 $445,099 $453,950 250 98% 27
Toronto E11 188 $62,743,452 $333,742 $326,500 321 98% 29
Page 3 July 2010
Market Watch, March 2013 6
7. Toronto Real Estate Board
DETACHED HOUSES, MARCH 2013
Industrial Leasing
SUMMARY OF EXISTING HOME TRANSACTIONS
ALL TREB AREAS
1 1 1 1 2 3 4 5
Sales Dollar Volume Average Price Median Price New Listings Active Listings Avg. SP/LP Avg. DOM
TREB Total 3,769
- $2,480,445,328
- $658,118
- $557,000
- 7,238
- 8,989
- 98%
- 24
-
Halton Region 380 $279,170,698 $734,660 $605,000 679 939 97% 29
Burlington 52 $34,638,800 $666,131 $615,000 87 148 98% 30
Halton Hills 66 $37,054,800 $561,436 $529,000 111 178 98% 33
Milton 105 $57,581,238 $548,393 $515,888 186 189 98% 22
Oakville 157
- $149,895,860
- $954,751
- $758,000
- 295
- 424
- 96%
- 32
-
Peel Region 786 $454,680,506 $578,474 $537,000 1,693 2,057 98% 23
Brampton 423 $206,881,704 $489,082 $467,500 942 1,089 98% 23
Caledon 57 $34,409,084 $603,668 $562,000 133 250 96% 43
Mississauga 306
- $213,389,718
- $697,352
- $624,250
- 618
- 718
- 98%
- 20
-
City of Toronto 975 $825,656,839 $846,828 $680,000 1,666 1,820 99% 18
! TURN PAGE FOR CITY OF TORONTO
TABLES OR CLICK HERE:
- - - - - - - -
York Region 835 $615,126,772 $736,679 $674,000 1,713 2,264 98% 26
Aurora 49 $34,519,299 $704,475 $619,500 98 132 98% 22
E. Gwillimbury 30 $16,806,867 $560,229 $484,750 40 76 97% 39
Georgina 67 $22,004,600 $328,427 $324,000 109 159 98% 36
King 15 $13,215,235 $881,016 $764,000 55 148 97% 36
Markham 163 $126,253,837 $774,563 $710,000 360 405 99% 18
Newmarket 85 $46,320,262 $544,944 $518,800 150 164 99% 24
Richmond Hill 185 $167,543,304 $905,639 $808,000 382 432 98% 21
Vaughan 196 $155,974,968 $795,791 $715,000 433 576 97% 28
Whitchurch-Stouffville 45
- $32,488,400
- $721,964
- $587,000
- 86
- 172
- 96%
- 46
-
Durham Region 627 $243,083,314 $387,693 $369,900 1,116 1,240 98% 22
Ajax 99 $45,049,000 $455,040 $433,000 192 169 99% 21
Brock 14 $3,297,500 $235,536 $190,000 37 103 95% 63
Clarington 111 $37,845,425 $340,950 $318,000 169 191 99% 18
Oshawa 173 $54,538,350 $315,251 $297,000 293 259 98% 19
Pickering 62 $30,879,239 $498,052 $460,000 114 138 98% 27
Scugog 18 $6,732,500 $374,028 $350,500 38 86 96% 40
Uxbridge 24 $11,381,900 $474,246 $445,000 51 98 96% 54
Whitby 126
- $53,359,400
- $423,487
- $405,400
- 222
- 196
- 98%
- 15
-
Dufferin County 28 $10,144,500 $362,304 $341,400 66 119 98% 42
Orangeville 28
- $10,144,500
- $362,304
- $341,400
- 66
- 119
- 98%
- 42
-
Simcoe County 138 $52,582,699 $381,034 $359,000 305 550 98% 46
Adjala-Tosorontio 10 $5,321,000 $532,100 $507,500 31 75 99% 113
Bradford West Gwillimbury 45 $19,810,899 $440,242 $416,000 91 129 98% 28
Essa 10 $3,495,500 $349,550 $291,000 34 73 98% 55
Innisfil 42 $13,930,250 $331,673 $311,750 89 166 97% 51
New Tecumseth 31 $10,025,050 $323,389 $320,000 60 107 97% 40
Page 3 July 2010
Market Watch, March 2013 7
8. Toronto Real Estate Board
DETACHED HOUSES, MARCH 2013
Industrial Leasing
SUMMARY OF EXISTING HOME TRANSACTIONS
CITY OF TORONTO MUNICIPAL BREAKDOWN
Sales1 Dollar Volume1 Average Price1 Median Price1 New Listings2 Active Listings3 Avg. SP/LP 4 Avg. DOM5
TREB Total 3,769 $2,480,445,328 $658,118 $557,000 7,238 8,989 98% 24
City of Toronto Total 975 $825,656,839 $846,828 $680,000 1,666 1,820 99% 18
Toronto West 301 $196,540,089 $652,957 $575,000 490 492 101% 20
Toronto W01 8 $9,386,000 $1,173,250 $965,500 5 15 100% 43
Toronto W02 36 $26,910,536 $747,515 $697,000 45 33 104% 13
Toronto W03 36 $16,103,544 $447,321 $400,500 60 53 102% 17
Toronto W04 28 $14,270,800 $509,671 $516,250 58 57 100% 21
Toronto W05 28 $15,304,309 $546,582 $542,900 45 46 99% 23
Toronto W06 30 $17,581,700 $586,057 $539,200 57 58 102% 20
Toronto W07 23 $17,617,900 $765,996 $730,000 30 21 101% 14
Toronto W08 63 $55,953,750 $888,155 $703,000 105 127 99% 21
Toronto W09 16 $9,082,000 $567,625 $523,500 33 39 99% 19
Toronto W10 33 $14,329,550 $434,229 $425,000 52 43 99% 21
Toronto Central 327 $425,871,502 $1,302,359 $1,125,000 567 763 98% 20
Toronto C01 1 $1,055,000 $1,055,000 $1,055,000 6 10 96% 9
Toronto C02 8 $11,639,500 $1,454,938 $1,348,750 16 31 98% 8
Toronto C03 30 $36,021,473 $1,200,716 $978,000 48 71 98% 21
Toronto C04 70 $95,641,365 $1,366,305 $1,302,500 111 139 98% 21
Toronto C06 17 $14,000,418 $823,554 $747,500 35 38 98% 23
Toronto C07 27 $26,494,400 $981,274 $820,000 72 113 100% 11
Toronto C08 1 $1,100,000 $1,100,000 $1,100,000 4 6 124% 1
Toronto C09 5 $10,710,000 $2,142,000 $1,875,000 10 24 96% 28
Toronto C10 9 $10,232,000 $1,136,889 $1,049,000 18 22 105% 12
Toronto C11 11 $16,209,000 $1,473,545 $1,410,000 12 12 98% 15
Toronto C12 35 $81,233,888 $2,320,968 $2,120,000 52 108 97% 28
Toronto C13 21 $23,342,804 $1,111,562 $858,000 31 36 102% 19
Toronto C14 47 $52,603,100 $1,119,215 $1,050,000 87 97 97% 19
Toronto C15 45 $45,588,554 $1,013,079 $870,000 65 56 98% 19
Toronto East 347 $203,245,248 $585,721 $515,000 609 565 100% 16
Toronto E01 20 $13,655,010 $682,751 $680,000 32 25 106% 12
Toronto E02 23 $20,524,188 $892,356 $840,000 40 46 100% 11
Toronto E03 53 $34,774,890 $656,130 $597,000 84 76 101% 17
Toronto E04 43 $20,473,155 $476,120 $460,000 79 63 101% 18
Toronto E05 23 $14,973,188 $651,008 $595,000 45 30 100% 12
Toronto E06 33 $19,334,950 $585,908 $550,000 57 47 98% 17
Toronto E07 21 $12,420,987 $591,476 $555,000 42 38 101% 14
Toronto E08 30 $17,785,300 $592,843 $540,450 50 62 99% 24
Toronto E09 41 $17,973,530 $438,379 $435,000 78 64 99% 17
Toronto E10 34 $18,789,999 $552,647 $522,500 61 78 99% 15
Toronto E11 26 $12,540,051 $482,310 $485,000 41 36 99% 17
Page 3 July 2010
Market Watch, March 2013 8
9. Toronto Real Estate Board
SEMI-DETACHED HOUSES, MARCH 2013
Industrial Leasing
SUMMARY OF EXISTING HOME TRANSACTIONS
ALL TREB AREAS
1 1 1 1 2 3 4 5
Sales Dollar Volume Average Price Median Price New Listings Active Listings Avg. SP/LP Avg. DOM
TREB Total 887
- $421,639,544
- $475,355
- $434,000
- 1,346
- 1,043
- 100%
- 16
-
Halton Region 47 $20,240,300 $430,645 $423,000 79 60 99% 11
Burlington 6 $2,579,900 $429,983 $444,000 11 7 99% 9
Halton Hills 9 $3,372,900 $374,767 $396,000 9 4 98% 12
Milton 22 $9,164,000 $416,545 $420,000 40 30 99% 13
Oakville 10
- $5,123,500
- $512,350
- $465,000
- 19
- 19
- 99%
- 8
-
Peel Region 321 $131,413,666 $409,388 $406,000 496 415 98% 20
Brampton 166 $62,821,700 $378,444 $377,500 269 245 98% 21
Caledon 8 $3,277,700 $409,713 $411,950 12 6 101% 8
Mississauga 147
- $65,314,266
- $444,315
- $440,000
- 215
- 164
- 98%
- 19
-
City of Toronto 314 $190,703,019 $607,334 $549,500 451 332 102% 12
! TURN PAGE FOR CITY OF TORONTO
TABLES OR CLICK HERE:
- - - - - - - -
York Region 111 $53,127,614 $478,627 $485,000 210 160 99% 15
Aurora 6 $2,558,100 $426,350 $420,850 10 5 99% 12
E. Gwillimbury - - - - - - - -
Georgina 2 $739,900 $369,950 $369,950 3 1 99% 9
King - - - - - - - -
Markham 28 $13,962,280 $498,653 $490,940 64 44 99% 16
Newmarket 17 $6,427,076 $378,063 $372,000 29 20 100% 8
Richmond Hill 10 $5,043,500 $504,350 $519,000 24 24 98% 14
Vaughan 41 $21,587,608 $526,527 $527,000 67 56 99% 17
Whitchurch-Stouffville 7
- $2,809,150
- $401,307
- $392,000
- 13
- 10
- 99%
- 11
-
Durham Region 74 $20,109,845 $271,755 $253,000 86 52 99% 14
Ajax 22 $7,308,495 $332,204 $340,050 26 13 99% 12
Brock - - - - - - - -
Clarington 6 $1,278,500 $213,083 $212,000 7 5 98% 23
Oshawa 30 $6,413,550 $213,785 $218,500 30 20 100% 15
Pickering 6 $2,178,500 $363,083 $359,000 10 6 100% 16
Scugog 1 $235,000 $235,000 $235,000 1 1 98% 11
Uxbridge 1 $311,000 $311,000 $311,000 1 1 102% 8
Whitby 8
- $2,384,800
- $298,100
- $295,500
- 11
- 6
- 99%
- 11
-
Dufferin County 7 $1,817,500 $259,643 $255,000 8 8 98% 16
Orangeville 7
- $1,817,500
- $259,643
- $255,000
- 8
- 8
- 98%
- 16
-
Simcoe County 13 $4,227,600 $325,200 $332,000 16 16 98% 25
Adjala-Tosorontio - - - - - - - -
Bradford West Gwillimbury 10 $3,438,700 $343,870 $344,000 12 10 98% 28
Essa - - - - 3 3 - -
Innisfil - - - - - - - -
New Tecumseth 3 $788,900 $262,967 $267,000 1 3 98% 14
Page 3 July 2010
Market Watch, March 2013 9
10. Toronto Real Estate Board
SEMI-DETACHED HOUSES, MARCH 2013
Industrial Leasing
SUMMARY OF EXISTING HOME TRANSACTIONS
CITY OF TORONTO MUNICIPAL BREAKDOWN
Sales1 Dollar Volume1 Average Price1 Median Price1 New Listings2 Active Listings3 Avg. SP/LP 4 Avg. DOM5
TREB Total 887 $421,639,544 $475,355 $434,000 1,346 1,043 100% 16
City of Toronto Total 314 $190,703,019 $607,334 $549,500 451 332 102% 12
Toronto West 93 $48,470,220 $521,185 $470,120 140 118 102% 12
Toronto W01 8 $6,274,000 $784,250 $809,500 5 3 105% 9
Toronto W02 34 $19,739,300 $580,568 $560,500 32 10 103% 8
Toronto W03 12 $5,607,020 $467,252 $470,060 21 27 103% 16
Toronto W04 3 $1,196,000 $398,667 $399,000 6 5 99% 7
Toronto W05 29 $12,297,900 $424,066 $410,000 57 55 98% 16
Toronto W06 1 $422,000 $422,000 $422,000 5 8 117% 6
Toronto W07 - - - - 1 1 - -
Toronto W08 3 $1,742,000 $580,667 $566,000 5 3 103% 5
Toronto W09 2 $790,000 $395,000 $395,000 4 1 99% 1
Toronto W10 1 $402,000 $402,000 $402,000 4 5 98% 58
Toronto Central 92 $70,953,361 $771,232 $654,000 117 104 101% 14
Toronto C01 21 $17,765,416 $845,972 $752,500 24 23 100% 15
Toronto C02 6 $8,860,500 $1,476,750 $956,500 11 25 98% 31
Toronto C03 12 $7,269,918 $605,827 $654,950 14 9 106% 18
Toronto C04 4 $2,969,900 $742,475 $741,330 6 3 105% 7
Toronto C06 1 $468,000 $468,000 $468,000 1 - 98% 13
Toronto C07 4 $2,061,900 $515,475 $512,500 5 3 99% 16
Toronto C08 8 $6,681,188 $835,149 $885,000 10 10 101% 11
Toronto C09 3 $5,358,000 $1,786,000 $1,550,000 2 2 99% 27
Toronto C10 8 $5,836,000 $729,500 $722,250 12 7 107% 7
Toronto C11 3 $2,356,833 $785,611 $773,333 3 2 107% 6
Toronto C12 - - - - - - - -
Toronto C13 8 $3,804,800 $475,600 $478,000 8 4 100% 9
Toronto C14 - - - - - - - -
Toronto C15 14 $7,520,906 $537,208 $549,400 21 16 100% 11
Toronto East 129 $71,279,438 $552,554 $520,000 194 110 103% 12
Toronto E01 32 $19,445,632 $607,676 $609,000 49 29 104% 11
Toronto E02 35 $22,206,566 $634,473 $640,000 46 22 104% 10
Toronto E03 18 $10,971,203 $609,511 $580,202 30 17 104% 16
Toronto E04 15 $6,307,436 $420,496 $389,000 15 6 100% 11
Toronto E05 7 $3,263,000 $466,143 $460,500 10 5 100% 9
Toronto E06 5 $2,168,000 $433,600 $479,000 5 3 104% 17
Toronto E07 8 $3,620,500 $452,563 $453,000 12 8 100% 16
Toronto E08 - - - - - - - -
Toronto E09 2 $763,000 $381,500 $381,500 6 4 98% 9
Toronto E10 - - - - 5 5 - -
Toronto E11 7 $2,534,101 $362,014 $329,500 16 11 98% 10
Page 3 July 2010
Market Watch, March 2013 10
11. Toronto Real Estate Board
CONDOMINIUM TOWNHOUSES, MARCH 2013
Industrial Leasing
SUMMARY OF EXISTING HOME TRANSACTIONS
ALL TREB AREAS
1 1 1 1 2 3 4 5
Sales Dollar Volume Average Price Median Price New Listings Active Listings Avg. SP/LP Avg. DOM
TREB Total 569
- $195,244,328
- $343,136
- $330,000
- 958
- 1,077
- 99%
- 25
-
Halton Region 39 $12,706,600 $325,810 $300,000 62 72 98% 24
Burlington 15 $5,250,200 $350,013 $335,000 19 19 99% 33
Halton Hills 5 $1,129,000 $225,800 $209,000 6 9 98% 24
Milton 6 $1,643,600 $273,933 $270,050 13 12 100% 15
Oakville 13
- $4,683,800
- $360,292
- $315,000
- 24
- 32
- 97%
- 17
-
Peel Region 192 $61,947,118 $322,641 $319,500 334 367 98% 24
Brampton 49 $12,747,011 $260,143 $249,500 85 98 98% 26
Caledon - - - - - - - -
Mississauga 143
- $49,200,107
- $344,057
- $345,000
- 249
- 269
- 98%
- 23
-
City of Toronto 201 $76,062,385 $378,420 $350,000 336 412 99% 24
! TURN PAGE FOR CITY OF TORONTO
TABLES OR CLICK HERE:
- - - - - - - -
York Region 71 $28,857,300 $406,441 $385,000 124 129 99% 24
Aurora 8 $2,867,700 $358,463 $337,250 17 24 100% 17
E. Gwillimbury - - - - - - - -
Georgina - - - - 1 1 - -
King - - - - - - - -
Markham 31 $13,587,300 $438,300 $430,000 58 56 100% 21
Newmarket 6 $1,773,400 $295,567 $290,950 7 5 99% 30
Richmond Hill 11 $4,552,500 $413,864 $420,000 22 25 98% 26
Vaughan 15 $6,076,400 $405,093 $390,000 19 17 98% 32
Whitchurch-Stouffville -
- -
- -
- -
- -
- 1
- -
- -
-
Durham Region 59 $14,101,525 $239,009 $237,000 91 84 98% 28
Ajax 17 $4,635,000 $272,647 $260,000 12 10 98% 21
Brock 3 $684,500 $228,167 $222,000 3 3 98% 35
Clarington 4 $1,110,000 $277,500 $217,500 4 2 98% 44
Oshawa 14 $2,243,400 $160,243 $160,500 30 28 98% 36
Pickering 9 $2,604,500 $289,389 $275,000 27 30 98% 23
Scugog - - - - - - - -
Uxbridge 4 $918,825 $229,706 $214,913 2 2 98% 56
Whitby 8
- $1,905,300
- $238,163
- $242,450
- 13
- 9
- 99%
- 13
-
Dufferin County 5 $1,057,400 $211,480 $226,500 5 8 99% 32
Orangeville 5
- $1,057,400
- $211,480
- $226,500
- 5
- 8
- 99%
- 32
-
Simcoe County 2 $512,000 $256,000 $256,000 6 5 102% 10
Adjala-Tosorontio - - - - - - - -
Bradford West Gwillimbury 2 $512,000 $256,000 $256,000 3 1 102% 10
Essa - - - - - - - -
Innisfil - - - - - - - -
New Tecumseth - - - - 3 4 - -
Page 3 July 2010
Market Watch, March 2013 11