Templates & Calculators

An overview of the Templates and Calculators in SigmaXL Established in 1998, SigmaXL Inc. is a leading provider of user friendly Excel Add-ins for Lean Six Sigma graphical and statistical tools and Monte Carlo simulation. SigmaXL® customers include market leaders like Agilent, Diebold, FedEx, Microsoft, Motorola and Shell. SigmaXL® software is also used by numerous colleges, universities and government agencies. Our flagship product, SigmaXL®, was designed from the ground up to be a cost-effective, powerful, but easy to use tool that enables users to measure, analyze, improve and control their service, transactional, and manufacturing processes. As an add-in to the already familiar Microsoft Excel, SigmaXL® is ideal for Lean Six Sigma training and application, or use in a college statistics course. DiscoverSim™ enables you to quantify your risk through Monte Carlo simulation and minimize your risk with global optimization. Business decisions are often based on assumptions with a single point value estimate or an average, resulting in unexpected outcomes. DiscoverSim™ allows you to model the uncertainty in your inputs so that you know what to expect in your outputs.

Empfohlen
Weitere ähnliche Inhalte
Was ist angesagt?
Was ist angesagt? (20)
Andere mochten auch
Andere mochten auch (13)
Ähnlich wie Templates & Calculators
Ähnlich wie Templates & Calculators (20)
Mehr von Cynthia Cumby
Kürzlich hochgeladen
Kürzlich hochgeladen (20)
Templates & Calculators
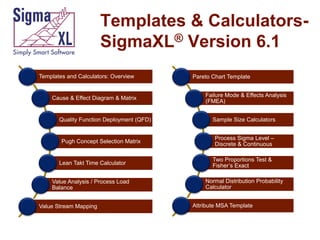
- 1. Templates & CalculatorsSigmaXL® Version 6.1 Templates and Calculators: Overview Cause & Effect Diagram & Matrix Quality Function Deployment (QFD) Pugh Concept Selection Matrix Lean Takt Time Calculator Value Analysis / Process Load Balance Value Stream Mapping Pareto Chart Template Failure Mode & Effects Analysis (FMEA) Sample Size Calculators Process Sigma Level – Discrete & Continuous Two Proportions Test & Fisher’s Exact Normal Distribution Probability Calculator Attribute MSA Template
- 2. Templates & Calculators DMAIC & DFSS Templates: Team/Project Charter SIPOC Diagram Flowchart Toolbar Data Measurement Plan Cause & Effect (Fishbone) Diagram and Quick Template Cause & Effect (XY) Matrix Failure Mode & Effects Analysis (FMEA) Quality Function Deployment (QFD) Pugh Concept Selection Matrix Control Plan Back to Index
- 3. Templates & Calculators Lean Templates: Takt Time Calculator Value Analysis/Process Load Balance Value Stream Mapping Basic Graphical Templates: Pareto Chart Histogram Run Chart Back to Index
- 4. Templates & Calculators Basic Statistical Templates: Sample Size – Discrete and Continuous 1 Sample t Confidence Interval for Mean 2 Sample t-Test (Assume Equal and Unequal Variances) 1 Sample Confidence Interval for Standard Deviation 2 Sample F-Test (Compare 2 StDevs) 1 Proportion Confidence Interval (Normal and Exact) 2 Proportions Test & Fisher’s Exact Probability Distribution Calculators: Normal, Lognormal, Exponential, Weibull Binomial, Poisson, Hypergeometric Back to Index
- 5. Templates & Calculators Basic MSA Templates: Basic Process Capability Templates: Process Sigma Level – Discrete and Continuous Process Capability & Confidence Intervals Basic DOE Templates: Gage R&R Study – with Multi-Vari Analysis Attribute Gage R&R (Attribute Agreement Analysis) 2 to 5 Factors 2-Level Full and Fractional-Factorial designs Main Effects & Interaction Plots Basic Control Chart Templates: Individuals C-Chart Back to Index
- 6. Templates & Calculators: Cause & Effect Diagram Back to Index
- 7. Templates & Calculators: Cause & Effect (XY) Matrix Back to Index
- 8. Templates & Calculators: Quality Function Deployment (QFD) Back to Index
- 9. Templates & Calculators: Pugh Concept Selection Matrix Back to Index
- 10. Templates & Calculators: Lean Takt Time Calculator Back to Index
- 11. Templates & Calculators: Value Analysis/ Process Load Balance Chart Back to Index
- 12. Templates & Calculators: Value Stream Mapping Back to Index
- 13. Templates & Calculators: Pareto Chart Quick Template Pareto Chart 100% 90 90% 80 80% 70 Count 100 70% 60 60% 50 50% 40 40% 30 30% 20 20% 10 10% 0 0% tu Re ls al -c rn ff Di lt icu er rd -o -to l oto ske - ta er rd O g on Category o ol -c ng ro W r il va t- a No le ab Back to Index
- 14. Templates & Calculators: Failure Mode & Effects Analysis (FMEA) Back to Index
- 15. Templates & Calculators: Sample Size Calculators Back to Index
- 16. Templates & Calculators: Sample Size Calculators Back to Index
- 17. Templates & Calculators: Process Sigma Level – Discrete Back to Index
- 18. Templates & Calculators: Process Sigma Level – Continuous Back to Index
- 19. Templates & Calculators: Two-Proportions Test & Fisher’s Exact Back to Index
- 20. Templates & Calculators: Normal Distribution Probability Calculator Back to Index
- 21. Templates and Calculators: Attribute MSA Template Back to Index