SlideShare ist ein Scribd-Unternehmen logo
1 von 18
Downloaden Sie, um offline zu lesen
Statistical Tools - SigmaXL®
Version 6.1
Stats Tools: Feature Overview

Two-Sample Comparison Tests

Multiple Regression with Residuals Plots

Binary & Ordinal Logistic Regression

One-Way Anova & Means Matrix

Non-Parametric Tests
Correlation Matrix

Chi-Square Test
Multiple Linear Regression

Power & Sample Size Calculators
Multiple Regression

Predicted Response Calculator

Power & Sample Size Charts
Statistical Tools







P-values turn red when results are significant (pvalue < alpha)
Descriptive Statistics including Anderson-Darling
Normality test, Skewness and Kurtosis with pvalues
1 Sample t-test and confidence intervals
Paired t-test, 2 Sample t-test
2 Sample Comparison Tests



Normality, Mean, Variance, Median
Yellow Highlight to aid Interpretation
Back to
Index
Statistical Tools



One-Way ANOVA and Means Matrix
Two-Way ANOVA




Equal Variance Tests:






Balanced and Unbalanced

Bartlett
Levene
Welch’s ANOVA

Correlation Matrix



Pearson’s Correlation Coefficient
Spearman’s Rank
Back to
Index
Statistical Tools








Multiple Linear Regression
Binary and Ordinal Logistic Regression
Chi-Square Test (Stacked Column data and
Two-Way Table data)
Nonparametric Tests
Power and Sample Size Calculators
Power and Sample Size Charts
Back to
Index
Statistical Tools:
Two-Sample Comparison
Tests
P-values turn red
when results are
significant!
Rules based
yellow highlight to
aid interpretation!

Back to
Index
Statistical Tools: One-Way
ANOVA & Means Matrix
4.48

Mean/CI - Overall Satisfaction

4.28

4.08

3.88

3.68

3.48

3.28

3.08
1

2

3

Customer Type

Back to
Index
Statistical Tools:
Correlation Matrix

Back to
Index
Statistical Tools:
Multiple Linear Regression


Accepts continuous and/or categorical (discrete)
predictors.




Categorical Predictors are coded with a 0,1 scheme
making the interpretation easier than the -1,0,1
scheme used by competitive products.

Interactive Predicted Response Calculator with
95% Confidence Interval and 95% Prediction
Interval.
Back to
Index
Statistical Tools:
Multiple Linear Regression











Residual plots: histogram, normal probability plot,
residuals vs. time, residuals vs. predicted and residuals
vs. X factors
Residual types include Regular, Standardized,
Studentized
Cook's Distance (Influence), Leverage and DFITS
Highlight of significant outliers in residuals
Durbin-Watson Test for Autocorrelation in Residuals with
p-value
Pure Error and Lack-of-fit report
Collinearity Variance Inflation Factor (VIF) and Tolerance
report
Back to
Fit Intercept is optional
Index
Statistical Tools:
Multiple Regression

Multiple Regression accepts Continuous and/or
Categorical Predictors!
Back to
Index
Statistical Tools:
Multiple Regression

Durbin-Watson Test with p-values
for positive and negative Back to
Index
autocorrelation!
Statistical Tools: Multiple
Regression – Predicted
Response Calculator with
Confidence Intervals

Easy-to-use Calculator with
Confidence Intervals and Prediction Intervals!

Back to
Index
Statistical Tools:
Multiple Regression with
Residual Plots
2

40

1

NSCORE

3

50

30

0

1.
10

Residuals

Regular Residuals

1.5

1.00

1

Regular Residuals

1.50

0.50

0.00

0.5

0

-0.5

Fitted Values

10
0.
00

80
.0
0

60
.0
0

40
.0
0

20
.0
0

12
0

10
0

80

40

20

60
Observation Order

0.
00

-1
-1.00

Back to
Index

12
0.
00

-0.50

0

Regular Residuals

0.
60

0.
10

-0
.9
0

1.
19

1.
01

0.
84

0.
67

0.
50

0.
32

0.
15

-0
.0
2

-3

-0
.1
9

0

-0
.3
7

-2

-0
.5
4

10

-0
.7
1

-1

-0
.8
8

20

-0
.4
0

Frequency

60
Statistical Tools:
Binary and Ordinal
Logistic Regression







Powerful and user-friendly logistic regression.
Report includes a calculator to predict the response
event probability for a given set of input X values.
Categorical (discrete) predictors can be included in the
model in addition to continuous predictors.
Model summary and goodness of fit tests including
Likelihood Ratio Chi-Square, Pseudo R-Square, Pearson
Residuals Chi-Square, Deviance Residuals Chi-Square,
Observed and Predicted Outcomes – Percent Correctly
Predicted.
Back to
Index
Statistical Tools:
Nonparametric Tests










1 Sample Sign
1 Sample Wilcoxon
2 Sample Mann-Whitney
Kruskal-Wallis Median Test
Mood’s Median Test
Kruskal-Wallis and Mood’s include a graph of
Group Medians and 95% Median Confidence
Intervals
Runs Test
Back to
Index
Statistical Tools:
Chi-Square Test

Back to
Index
Statistical Tools: Power &
Sample Size Calculators








1 Sample t-Test
2 Sample t-Test
One-Way ANOVA
1 Proportion Test
2 Proportions Test
The Power and Sample Size Calculators
allow you to solve for Power (1 – Beta),
Sample Size, or Difference (specify two, solve
for the third).

Back to
Index
Statistical Tools: Power &
Sample Size Charts
Power & Sample Size: 1 Sample t-Test
1.2

Power (1 - Beta)

1
Difference = 0.5
0.8

Difference = 1
Difference = 1.5

0.6

Difference = 2
Difference = 2.5

0.4

Difference = 3
0.2
0
0

10

20

30

40

50

60

Sample Size (N)

Back to
Index

Weitere ähnliche Inhalte

Ähnlich wie Stats tools

The DNP must have a basic understanding of statistical measureme.docx
The DNP must have a basic understanding of statistical measureme.docxThe DNP must have a basic understanding of statistical measureme.docx
The DNP must have a basic understanding of statistical measureme.docxtodd701
 
DirectionsSet up your IBM SPSS account and run several statisti.docx
DirectionsSet up your IBM SPSS account and run several statisti.docxDirectionsSet up your IBM SPSS account and run several statisti.docx
DirectionsSet up your IBM SPSS account and run several statisti.docxjakeomoore75037
 
QCP user manual EN.pdf
QCP user manual EN.pdfQCP user manual EN.pdf
QCP user manual EN.pdfEmerson Ceras
 
R&R Analysis Using SEDana
R&R Analysis Using SEDanaR&R Analysis Using SEDana
R&R Analysis Using SEDanaamegens
 
Measurement system analysis Presentation.ppt
Measurement system analysis Presentation.pptMeasurement system analysis Presentation.ppt
Measurement system analysis Presentation.pptjawadullah25
 
Usp chemical medicines & excipients - evolution of validation practices
Usp    chemical medicines & excipients - evolution of validation practicesUsp    chemical medicines & excipients - evolution of validation practices
Usp chemical medicines & excipients - evolution of validation practicesNational Institute of Biologics
 
Logistic Regression in Case-Control Study
Logistic Regression in Case-Control StudyLogistic Regression in Case-Control Study
Logistic Regression in Case-Control StudySatish Gupta
 
Statistical Process Control
Statistical Process ControlStatistical Process Control
Statistical Process ControlMarwa Abo-Amra
 
Inferential tests analysis tools update 2011
Inferential tests analysis tools update 2011Inferential tests analysis tools update 2011
Inferential tests analysis tools update 2011Laura Roberts, Ph.D.
 
DNP 830 Data Collection and Level of Measurement.docx
DNP 830 Data Collection and Level of Measurement.docxDNP 830 Data Collection and Level of Measurement.docx
DNP 830 Data Collection and Level of Measurement.docxwrite5
 
Basics of SPSS and how to use it first time
Basics of SPSS and how to use it first timeBasics of SPSS and how to use it first time
Basics of SPSS and how to use it first timeRagabGautam1
 
P09_ShiDiagnosticProducts (1).ppt
P09_ShiDiagnosticProducts (1).pptP09_ShiDiagnosticProducts (1).ppt
P09_ShiDiagnosticProducts (1).pptKrushna71
 
P09_ShiDiagnosticProducts.ppt
P09_ShiDiagnosticProducts.pptP09_ShiDiagnosticProducts.ppt
P09_ShiDiagnosticProducts.ppthodlabdesignco
 
SOC2002 Lecture 11
SOC2002 Lecture 11SOC2002 Lecture 11
SOC2002 Lecture 11Bonnie Green
 
Elementary Data Analysis with MS Excel_Day-5
Elementary Data Analysis with MS Excel_Day-5Elementary Data Analysis with MS Excel_Day-5
Elementary Data Analysis with MS Excel_Day-5Redwan Ferdous
 
Quantitative_analysis.ppt
Quantitative_analysis.pptQuantitative_analysis.ppt
Quantitative_analysis.pptmousaderhem1
 
02training material for msa
02training material for msa02training material for msa
02training material for msa營松 林
 

Ähnlich wie Stats tools (20)

The DNP must have a basic understanding of statistical measureme.docx
The DNP must have a basic understanding of statistical measureme.docxThe DNP must have a basic understanding of statistical measureme.docx
The DNP must have a basic understanding of statistical measureme.docx
 
DirectionsSet up your IBM SPSS account and run several statisti.docx
DirectionsSet up your IBM SPSS account and run several statisti.docxDirectionsSet up your IBM SPSS account and run several statisti.docx
DirectionsSet up your IBM SPSS account and run several statisti.docx
 
QCP user manual EN.pdf
QCP user manual EN.pdfQCP user manual EN.pdf
QCP user manual EN.pdf
 
R&R Analysis Using SEDana
R&R Analysis Using SEDanaR&R Analysis Using SEDana
R&R Analysis Using SEDana
 
Measurement system analysis Presentation.ppt
Measurement system analysis Presentation.pptMeasurement system analysis Presentation.ppt
Measurement system analysis Presentation.ppt
 
Usp chemical medicines & excipients - evolution of validation practices
Usp    chemical medicines & excipients - evolution of validation practicesUsp    chemical medicines & excipients - evolution of validation practices
Usp chemical medicines & excipients - evolution of validation practices
 
Data analysis and working on spss
Data analysis and working on spssData analysis and working on spss
Data analysis and working on spss
 
Logistic Regression in Case-Control Study
Logistic Regression in Case-Control StudyLogistic Regression in Case-Control Study
Logistic Regression in Case-Control Study
 
Statistical Process Control
Statistical Process ControlStatistical Process Control
Statistical Process Control
 
Inferential tests analysis tools update 2011
Inferential tests analysis tools update 2011Inferential tests analysis tools update 2011
Inferential tests analysis tools update 2011
 
DNP 830 Data Collection and Level of Measurement.docx
DNP 830 Data Collection and Level of Measurement.docxDNP 830 Data Collection and Level of Measurement.docx
DNP 830 Data Collection and Level of Measurement.docx
 
Qaqc Course Total
Qaqc Course TotalQaqc Course Total
Qaqc Course Total
 
Basics of SPSS and how to use it first time
Basics of SPSS and how to use it first timeBasics of SPSS and how to use it first time
Basics of SPSS and how to use it first time
 
P09_ShiDiagnosticProducts (1).ppt
P09_ShiDiagnosticProducts (1).pptP09_ShiDiagnosticProducts (1).ppt
P09_ShiDiagnosticProducts (1).ppt
 
P09_ShiDiagnosticProducts.ppt
P09_ShiDiagnosticProducts.pptP09_ShiDiagnosticProducts.ppt
P09_ShiDiagnosticProducts.ppt
 
SOC2002 Lecture 11
SOC2002 Lecture 11SOC2002 Lecture 11
SOC2002 Lecture 11
 
Elementary Data Analysis with MS Excel_Day-5
Elementary Data Analysis with MS Excel_Day-5Elementary Data Analysis with MS Excel_Day-5
Elementary Data Analysis with MS Excel_Day-5
 
Msa presentation
Msa presentationMsa presentation
Msa presentation
 
Quantitative_analysis.ppt
Quantitative_analysis.pptQuantitative_analysis.ppt
Quantitative_analysis.ppt
 
02training material for msa
02training material for msa02training material for msa
02training material for msa
 

Mehr von Cynthia Cumby

Mehr von Cynthia Cumby (7)

Sigma xl eula
Sigma xl eulaSigma xl eula
Sigma xl eula
 
Control charts
Control chartsControl charts
Control charts
 
Design of experiments
Design of experimentsDesign of experiments
Design of experiments
 
Graphical tools
Graphical toolsGraphical tools
Graphical tools
 
Measurement system analysis
Measurement system analysisMeasurement system analysis
Measurement system analysis
 
Templates & Calculators
Templates & CalculatorsTemplates & Calculators
Templates & Calculators
 
Sigma xl getting_started
Sigma xl getting_startedSigma xl getting_started
Sigma xl getting_started
 

Kürzlich hochgeladen

Monte Carlo simulation : Simulation using MCSM
Monte Carlo simulation : Simulation using MCSMMonte Carlo simulation : Simulation using MCSM
Monte Carlo simulation : Simulation using MCSMRavindra Nath Shukla
 
A305_A2_file_Batkhuu progress report.pdf
A305_A2_file_Batkhuu progress report.pdfA305_A2_file_Batkhuu progress report.pdf
A305_A2_file_Batkhuu progress report.pdftbatkhuu1
 
0183760ssssssssssssssssssssssssssss00101011 (27).pdf
0183760ssssssssssssssssssssssssssss00101011 (27).pdf0183760ssssssssssssssssssssssssssss00101011 (27).pdf
0183760ssssssssssssssssssssssssssss00101011 (27).pdfRenandantas16
 
Lucknow 💋 Escorts in Lucknow - 450+ Call Girl Cash Payment 8923113531 Neha Th...
Lucknow 💋 Escorts in Lucknow - 450+ Call Girl Cash Payment 8923113531 Neha Th...Lucknow 💋 Escorts in Lucknow - 450+ Call Girl Cash Payment 8923113531 Neha Th...
Lucknow 💋 Escorts in Lucknow - 450+ Call Girl Cash Payment 8923113531 Neha Th...anilsa9823
 
Enhancing and Restoring Safety & Quality Cultures - Dave Litwiller - May 2024...
Enhancing and Restoring Safety & Quality Cultures - Dave Litwiller - May 2024...Enhancing and Restoring Safety & Quality Cultures - Dave Litwiller - May 2024...
Enhancing and Restoring Safety & Quality Cultures - Dave Litwiller - May 2024...Dave Litwiller
 
B.COM Unit – 4 ( CORPORATE SOCIAL RESPONSIBILITY ( CSR ).pptx
B.COM Unit – 4 ( CORPORATE SOCIAL RESPONSIBILITY ( CSR ).pptxB.COM Unit – 4 ( CORPORATE SOCIAL RESPONSIBILITY ( CSR ).pptx
B.COM Unit – 4 ( CORPORATE SOCIAL RESPONSIBILITY ( CSR ).pptxpriyanshujha201
 
Cracking the Cultural Competence Code.pptx
Cracking the Cultural Competence Code.pptxCracking the Cultural Competence Code.pptx
Cracking the Cultural Competence Code.pptxWorkforce Group
 
VIP Call Girls Gandi Maisamma ( Hyderabad ) Phone 8250192130 | ₹5k To 25k Wit...
VIP Call Girls Gandi Maisamma ( Hyderabad ) Phone 8250192130 | ₹5k To 25k Wit...VIP Call Girls Gandi Maisamma ( Hyderabad ) Phone 8250192130 | ₹5k To 25k Wit...
VIP Call Girls Gandi Maisamma ( Hyderabad ) Phone 8250192130 | ₹5k To 25k Wit...Suhani Kapoor
 
It will be International Nurses' Day on 12 May
It will be International Nurses' Day on 12 MayIt will be International Nurses' Day on 12 May
It will be International Nurses' Day on 12 MayNZSG
 
HONOR Veterans Event Keynote by Michael Hawkins
HONOR Veterans Event Keynote by Michael HawkinsHONOR Veterans Event Keynote by Michael Hawkins
HONOR Veterans Event Keynote by Michael HawkinsMichael W. Hawkins
 
RSA Conference Exhibitor List 2024 - Exhibitors Data
RSA Conference Exhibitor List 2024 - Exhibitors DataRSA Conference Exhibitor List 2024 - Exhibitors Data
RSA Conference Exhibitor List 2024 - Exhibitors DataExhibitors Data
 
Monthly Social Media Update April 2024 pptx.pptx
Monthly Social Media Update April 2024 pptx.pptxMonthly Social Media Update April 2024 pptx.pptx
Monthly Social Media Update April 2024 pptx.pptxAndy Lambert
 
Famous Olympic Siblings from the 21st Century
Famous Olympic Siblings from the 21st CenturyFamous Olympic Siblings from the 21st Century
Famous Olympic Siblings from the 21st Centuryrwgiffor
 
Regression analysis: Simple Linear Regression Multiple Linear Regression
Regression analysis:  Simple Linear Regression Multiple Linear RegressionRegression analysis:  Simple Linear Regression Multiple Linear Regression
Regression analysis: Simple Linear Regression Multiple Linear RegressionRavindra Nath Shukla
 
Best VIP Call Girls Noida Sector 40 Call Me: 8448380779
Best VIP Call Girls Noida Sector 40 Call Me: 8448380779Best VIP Call Girls Noida Sector 40 Call Me: 8448380779
Best VIP Call Girls Noida Sector 40 Call Me: 8448380779Delhi Call girls
 
Call Girls In DLf Gurgaon ➥99902@11544 ( Best price)100% Genuine Escort In 24...
Call Girls In DLf Gurgaon ➥99902@11544 ( Best price)100% Genuine Escort In 24...Call Girls In DLf Gurgaon ➥99902@11544 ( Best price)100% Genuine Escort In 24...
Call Girls In DLf Gurgaon ➥99902@11544 ( Best price)100% Genuine Escort In 24...lizamodels9
 
Call Girls In Panjim North Goa 9971646499 Genuine Service
Call Girls In Panjim North Goa 9971646499 Genuine ServiceCall Girls In Panjim North Goa 9971646499 Genuine Service
Call Girls In Panjim North Goa 9971646499 Genuine Serviceritikaroy0888
 
Call Girls Jp Nagar Just Call 👗 7737669865 👗 Top Class Call Girl Service Bang...
Call Girls Jp Nagar Just Call 👗 7737669865 👗 Top Class Call Girl Service Bang...Call Girls Jp Nagar Just Call 👗 7737669865 👗 Top Class Call Girl Service Bang...
Call Girls Jp Nagar Just Call 👗 7737669865 👗 Top Class Call Girl Service Bang...amitlee9823
 
The Path to Product Excellence: Avoiding Common Pitfalls and Enhancing Commun...
The Path to Product Excellence: Avoiding Common Pitfalls and Enhancing Commun...The Path to Product Excellence: Avoiding Common Pitfalls and Enhancing Commun...
The Path to Product Excellence: Avoiding Common Pitfalls and Enhancing Commun...Aggregage
 
Mondelez State of Snacking and Future Trends 2023
Mondelez State of Snacking and Future Trends 2023Mondelez State of Snacking and Future Trends 2023
Mondelez State of Snacking and Future Trends 2023Neil Kimberley
 

Kürzlich hochgeladen (20)

Monte Carlo simulation : Simulation using MCSM
Monte Carlo simulation : Simulation using MCSMMonte Carlo simulation : Simulation using MCSM
Monte Carlo simulation : Simulation using MCSM
 
A305_A2_file_Batkhuu progress report.pdf
A305_A2_file_Batkhuu progress report.pdfA305_A2_file_Batkhuu progress report.pdf
A305_A2_file_Batkhuu progress report.pdf
 
0183760ssssssssssssssssssssssssssss00101011 (27).pdf
0183760ssssssssssssssssssssssssssss00101011 (27).pdf0183760ssssssssssssssssssssssssssss00101011 (27).pdf
0183760ssssssssssssssssssssssssssss00101011 (27).pdf
 
Lucknow 💋 Escorts in Lucknow - 450+ Call Girl Cash Payment 8923113531 Neha Th...
Lucknow 💋 Escorts in Lucknow - 450+ Call Girl Cash Payment 8923113531 Neha Th...Lucknow 💋 Escorts in Lucknow - 450+ Call Girl Cash Payment 8923113531 Neha Th...
Lucknow 💋 Escorts in Lucknow - 450+ Call Girl Cash Payment 8923113531 Neha Th...
 
Enhancing and Restoring Safety & Quality Cultures - Dave Litwiller - May 2024...
Enhancing and Restoring Safety & Quality Cultures - Dave Litwiller - May 2024...Enhancing and Restoring Safety & Quality Cultures - Dave Litwiller - May 2024...
Enhancing and Restoring Safety & Quality Cultures - Dave Litwiller - May 2024...
 
B.COM Unit – 4 ( CORPORATE SOCIAL RESPONSIBILITY ( CSR ).pptx
B.COM Unit – 4 ( CORPORATE SOCIAL RESPONSIBILITY ( CSR ).pptxB.COM Unit – 4 ( CORPORATE SOCIAL RESPONSIBILITY ( CSR ).pptx
B.COM Unit – 4 ( CORPORATE SOCIAL RESPONSIBILITY ( CSR ).pptx
 
Cracking the Cultural Competence Code.pptx
Cracking the Cultural Competence Code.pptxCracking the Cultural Competence Code.pptx
Cracking the Cultural Competence Code.pptx
 
VIP Call Girls Gandi Maisamma ( Hyderabad ) Phone 8250192130 | ₹5k To 25k Wit...
VIP Call Girls Gandi Maisamma ( Hyderabad ) Phone 8250192130 | ₹5k To 25k Wit...VIP Call Girls Gandi Maisamma ( Hyderabad ) Phone 8250192130 | ₹5k To 25k Wit...
VIP Call Girls Gandi Maisamma ( Hyderabad ) Phone 8250192130 | ₹5k To 25k Wit...
 
It will be International Nurses' Day on 12 May
It will be International Nurses' Day on 12 MayIt will be International Nurses' Day on 12 May
It will be International Nurses' Day on 12 May
 
HONOR Veterans Event Keynote by Michael Hawkins
HONOR Veterans Event Keynote by Michael HawkinsHONOR Veterans Event Keynote by Michael Hawkins
HONOR Veterans Event Keynote by Michael Hawkins
 
RSA Conference Exhibitor List 2024 - Exhibitors Data
RSA Conference Exhibitor List 2024 - Exhibitors DataRSA Conference Exhibitor List 2024 - Exhibitors Data
RSA Conference Exhibitor List 2024 - Exhibitors Data
 
Monthly Social Media Update April 2024 pptx.pptx
Monthly Social Media Update April 2024 pptx.pptxMonthly Social Media Update April 2024 pptx.pptx
Monthly Social Media Update April 2024 pptx.pptx
 
Famous Olympic Siblings from the 21st Century
Famous Olympic Siblings from the 21st CenturyFamous Olympic Siblings from the 21st Century
Famous Olympic Siblings from the 21st Century
 
Regression analysis: Simple Linear Regression Multiple Linear Regression
Regression analysis:  Simple Linear Regression Multiple Linear RegressionRegression analysis:  Simple Linear Regression Multiple Linear Regression
Regression analysis: Simple Linear Regression Multiple Linear Regression
 
Best VIP Call Girls Noida Sector 40 Call Me: 8448380779
Best VIP Call Girls Noida Sector 40 Call Me: 8448380779Best VIP Call Girls Noida Sector 40 Call Me: 8448380779
Best VIP Call Girls Noida Sector 40 Call Me: 8448380779
 
Call Girls In DLf Gurgaon ➥99902@11544 ( Best price)100% Genuine Escort In 24...
Call Girls In DLf Gurgaon ➥99902@11544 ( Best price)100% Genuine Escort In 24...Call Girls In DLf Gurgaon ➥99902@11544 ( Best price)100% Genuine Escort In 24...
Call Girls In DLf Gurgaon ➥99902@11544 ( Best price)100% Genuine Escort In 24...
 
Call Girls In Panjim North Goa 9971646499 Genuine Service
Call Girls In Panjim North Goa 9971646499 Genuine ServiceCall Girls In Panjim North Goa 9971646499 Genuine Service
Call Girls In Panjim North Goa 9971646499 Genuine Service
 
Call Girls Jp Nagar Just Call 👗 7737669865 👗 Top Class Call Girl Service Bang...
Call Girls Jp Nagar Just Call 👗 7737669865 👗 Top Class Call Girl Service Bang...Call Girls Jp Nagar Just Call 👗 7737669865 👗 Top Class Call Girl Service Bang...
Call Girls Jp Nagar Just Call 👗 7737669865 👗 Top Class Call Girl Service Bang...
 
The Path to Product Excellence: Avoiding Common Pitfalls and Enhancing Commun...
The Path to Product Excellence: Avoiding Common Pitfalls and Enhancing Commun...The Path to Product Excellence: Avoiding Common Pitfalls and Enhancing Commun...
The Path to Product Excellence: Avoiding Common Pitfalls and Enhancing Commun...
 
Mondelez State of Snacking and Future Trends 2023
Mondelez State of Snacking and Future Trends 2023Mondelez State of Snacking and Future Trends 2023
Mondelez State of Snacking and Future Trends 2023
 

Stats tools

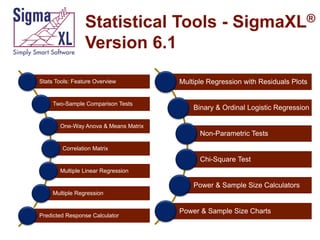
  • 1. Statistical Tools - SigmaXL® Version 6.1 Stats Tools: Feature Overview Two-Sample Comparison Tests Multiple Regression with Residuals Plots Binary & Ordinal Logistic Regression One-Way Anova & Means Matrix Non-Parametric Tests Correlation Matrix Chi-Square Test Multiple Linear Regression Power & Sample Size Calculators Multiple Regression Predicted Response Calculator Power & Sample Size Charts
  • 2. Statistical Tools      P-values turn red when results are significant (pvalue < alpha) Descriptive Statistics including Anderson-Darling Normality test, Skewness and Kurtosis with pvalues 1 Sample t-test and confidence intervals Paired t-test, 2 Sample t-test 2 Sample Comparison Tests   Normality, Mean, Variance, Median Yellow Highlight to aid Interpretation Back to Index
  • 3. Statistical Tools   One-Way ANOVA and Means Matrix Two-Way ANOVA   Equal Variance Tests:     Balanced and Unbalanced Bartlett Levene Welch’s ANOVA Correlation Matrix   Pearson’s Correlation Coefficient Spearman’s Rank Back to Index
  • 4. Statistical Tools       Multiple Linear Regression Binary and Ordinal Logistic Regression Chi-Square Test (Stacked Column data and Two-Way Table data) Nonparametric Tests Power and Sample Size Calculators Power and Sample Size Charts Back to Index
  • 5. Statistical Tools: Two-Sample Comparison Tests P-values turn red when results are significant! Rules based yellow highlight to aid interpretation! Back to Index
  • 6. Statistical Tools: One-Way ANOVA & Means Matrix 4.48 Mean/CI - Overall Satisfaction 4.28 4.08 3.88 3.68 3.48 3.28 3.08 1 2 3 Customer Type Back to Index
  • 8. Statistical Tools: Multiple Linear Regression  Accepts continuous and/or categorical (discrete) predictors.   Categorical Predictors are coded with a 0,1 scheme making the interpretation easier than the -1,0,1 scheme used by competitive products. Interactive Predicted Response Calculator with 95% Confidence Interval and 95% Prediction Interval. Back to Index
  • 9. Statistical Tools: Multiple Linear Regression         Residual plots: histogram, normal probability plot, residuals vs. time, residuals vs. predicted and residuals vs. X factors Residual types include Regular, Standardized, Studentized Cook's Distance (Influence), Leverage and DFITS Highlight of significant outliers in residuals Durbin-Watson Test for Autocorrelation in Residuals with p-value Pure Error and Lack-of-fit report Collinearity Variance Inflation Factor (VIF) and Tolerance report Back to Fit Intercept is optional Index
  • 10. Statistical Tools: Multiple Regression Multiple Regression accepts Continuous and/or Categorical Predictors! Back to Index
  • 11. Statistical Tools: Multiple Regression Durbin-Watson Test with p-values for positive and negative Back to Index autocorrelation!
  • 12. Statistical Tools: Multiple Regression – Predicted Response Calculator with Confidence Intervals Easy-to-use Calculator with Confidence Intervals and Prediction Intervals! Back to Index
  • 13. Statistical Tools: Multiple Regression with Residual Plots 2 40 1 NSCORE 3 50 30 0 1. 10 Residuals Regular Residuals 1.5 1.00 1 Regular Residuals 1.50 0.50 0.00 0.5 0 -0.5 Fitted Values 10 0. 00 80 .0 0 60 .0 0 40 .0 0 20 .0 0 12 0 10 0 80 40 20 60 Observation Order 0. 00 -1 -1.00 Back to Index 12 0. 00 -0.50 0 Regular Residuals 0. 60 0. 10 -0 .9 0 1. 19 1. 01 0. 84 0. 67 0. 50 0. 32 0. 15 -0 .0 2 -3 -0 .1 9 0 -0 .3 7 -2 -0 .5 4 10 -0 .7 1 -1 -0 .8 8 20 -0 .4 0 Frequency 60
  • 14. Statistical Tools: Binary and Ordinal Logistic Regression     Powerful and user-friendly logistic regression. Report includes a calculator to predict the response event probability for a given set of input X values. Categorical (discrete) predictors can be included in the model in addition to continuous predictors. Model summary and goodness of fit tests including Likelihood Ratio Chi-Square, Pseudo R-Square, Pearson Residuals Chi-Square, Deviance Residuals Chi-Square, Observed and Predicted Outcomes – Percent Correctly Predicted. Back to Index
  • 15. Statistical Tools: Nonparametric Tests        1 Sample Sign 1 Sample Wilcoxon 2 Sample Mann-Whitney Kruskal-Wallis Median Test Mood’s Median Test Kruskal-Wallis and Mood’s include a graph of Group Medians and 95% Median Confidence Intervals Runs Test Back to Index
  • 17. Statistical Tools: Power & Sample Size Calculators       1 Sample t-Test 2 Sample t-Test One-Way ANOVA 1 Proportion Test 2 Proportions Test The Power and Sample Size Calculators allow you to solve for Power (1 – Beta), Sample Size, or Difference (specify two, solve for the third). Back to Index
  • 18. Statistical Tools: Power & Sample Size Charts Power & Sample Size: 1 Sample t-Test 1.2 Power (1 - Beta) 1 Difference = 0.5 0.8 Difference = 1 Difference = 1.5 0.6 Difference = 2 Difference = 2.5 0.4 Difference = 3 0.2 0 0 10 20 30 40 50 60 Sample Size (N) Back to Index