More Income & Capital Appreciation, Listed and Private Real Estate, 1988Q4-2013Q3
•Als PPTX, PDF herunterladen•
0 gefällt mir•254 views

This is the same as the chart I uploaded previously (http://www.slideshare.net/casebrad/slide-qg-income-and-capital-appreciation-with-full-reinvestment), but uses the entire historical period available for all five forms of real estate investment, starting in 1988Q4 and extending through 2013Q3. Questions? Contact me at bcase@nareit.com.

Empfohlen
Weitere ähnliche Inhalte
Mehr von Brad Case, PhD, CFA, CAIA
Mehr von Brad Case, PhD, CFA, CAIA (12)
More Income & Capital Appreciation, Listed and Private Real Estate, 1988Q4-2013Q3
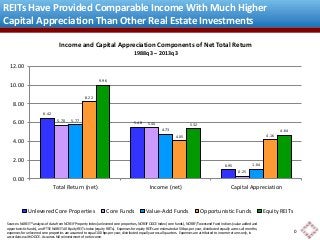
- 1. REITs Have Provided Comparable Income With Much Higher Capital Appreciation Than Other Real Estate Investments Income and Capital Appreciation Components of Net Total Return Income Component 5.32 1988q3 – 2013q3 4.05 4.16 0.95 0.25 1.04 Income Component 6.42 5.48 5.70 5.44 5.77 4.73 8.22 9.96 12.00 10.00 8.00 6.00 4.00 2.00 Sources: NAREIT® analysis of data from NCREIF Property Index (unlevered core properties, NCREIF ODCE Index (core funds), NCREIF/Townsend Fund Indices (value added and opportunistic funds), and FTSE NAREIT All Equity REITs Index (equity REITs). Expenses for equity REITs are estimated at 50 bps per year, distributed equally across all months; expenses for unlevered core properties are assumed to equal 100 bps per year, distributed equally across all quarters. Expenses are attributed to income returns only, in accordance with ODCE. Assumes full reinvestment of net income. 4.64 0.00 Total Return (net) Income (net) Capital Appreciation Unlevered Core Properties Core Funds Value-Add Funds Opportunistic Funds Equity REITs 0