SlideShare ist ein Scribd-Unternehmen logo
1 von 14
Downloaden Sie, um offline zu lesen
California: Changes in Hom e Prices Based on a Repeat Sales Model
                                                  (Jan 2000=100)

280
260

240
                            Excluding REOs
220
                            Including REOs
200
180

160
140

120
100
      2000


                  2001


                              2002


                                        2003


                                                   2004


                                                             2005


                                                                       2006


                                                                                 2007


                                                                                           2008


                                                                                                     2009
                                        Source: LPS Applied Analytics


                Florida: Changes in Hom e Prices Based on a Repeat Sales Model
                                                   (Jan 2000=100)

 280
 260

 240
                             Excluding REOs
 220
                             Including REOs
 200
 180

 160
 140

 120
 100
         2000


                     2001


                                 2002


                                           2003


                                                      2004


                                                                2005


                                                                          2006


                                                                                    2007


                                                                                              2008


                                                                                                        2009


                                         Source: LPS Applied Analytics
Ohio: Changes in Hom e Prices Based on a Repeat Sales Model
                                                      (Jan 2000=100)

130
125
120
                            Excluding REOs
115
110                         Including REOs

105
100
95
90
85
80
      2000


                  2001


                              2002


                                        2003


                                                       2004


                                                                     2005


                                                                                   2006


                                                                                                 2007


                                                                                                               2008


                                                                                                                             2009
                                        Source: LPS Applied Analytics


               New York: Changes in Hom e Prices Based on a Repeat Sales Model
                                                       (Jan 2000=100)

 220


 200
                             Excluding REOs
 180
                             Including REOs

 160


 140

 120


 100
        2000


                     2001


                                 2002


                                               2003


                                                              2004


                                                                            2005


                                                                                          2006


                                                                                                        2007


                                                                                                                      2008


                                                                                                                                    2009


                                         Source: LPS Applied Analytics
Michigan: Changes in Hom e Prices Based on a Repeat Sales Model
                                         (Jan 2000=100)

140
130

120
                        Excluding REOs
110
                        Including REOs
100
90

80
70

60
50
      2000


                 2001


                          2002


                                  2003


                                          2004


                                                  2005


                                                          2006


                                                                  2007


                                                                         2008


                                                                                2009
                                 Source: LPS Applied Analytics


              Illinois: Changes in Hom e Prices Based on a Repeat Sales Model
                                         (Jan 2000=100)

170

160

150                     Excluding REOs

                        Including REOs
140

130

120

110

100
      2000


                 2001


                          2002


                                  2003


                                           2004


                                                  2005


                                                          2006


                                                                  2007


                                                                         2008


                                                                                2009


                                  Source: LPS Applied Analytics
North Carolina: Changes in Hom e Prices Based on a Repeat Sales
                                              Model
                                          (Jan 2000=100)
140

135

130                     Excluding REOs
125                     Including REOs

120

115

110

105

100
      2000


                2001


                          2002


                                  2003


                                           2004


                                                      2005


                                                                 2006


                                                                          2007


                                                                                    2008


                                                                                              2009
                                 Source: LPS Applied Analytics


              New Jersey: Changes in Hom e Prices Based on a Repeat Sales
                                                  Model
                                          (Jan 2000=100)
240

220

200                     Excluding REOs

                        Including REOs
180

160

140

120

100
      2000


                 2001


                          2002


                                   2003


                                             2004


                                                          2005


                                                                   2006


                                                                             2007


                                                                                       2008


                                                                                                     2009
                                 Source: LPS Applied Analytics
Massachusetts: Changes in Hom e Prices Based on a Repeat Sales
                                                  Model
                                          (Jan 2000=100)
200
190
180
                        Excluding REOs
170
160                     Including REOs

150
140
130
120
110
100
      2000


                 2001


                          2002


                                   2003


                                           2004


                                                      2005


                                                             2006


                                                                    2007


                                                                           2008


                                                                                  2009
                                  Source: LPS Applied Analytics


             Pennsylvania: Changes in Hom e Prices Based on a Repeat Sales
                                              Model
                                          (Jan 2000=100)
200
190
180
                        Excluding REOs
170
160                     Including REOs

150
140
130
120
110
100
      2000


                 2001


                          2002


                                   2003


                                           2004


                                                      2005


                                                             2006


                                                                    2007


                                                                           2008


                                                                                  2009
                                  Source: LPS Applied Analytics


             Georgia: Changes in Hom e Prices Based on a Repeat Sales Model
                                          (Jan 2000=100)

135
130
                        Excluding REOs
125
                        Including REOs
120

115
110

105
100

95
90
      2000


                 2001


                          2002


                                   2003


                                           2004


                                                      2005


                                                             2006


                                                                    2007


                                                                           2008


                                                                                  2009


                                  Source: LPS Applied Analytics
Virginia: Changes in Hom e Prices Based on a Repeat Sales Model
                                            (Jan 2000=100)

270
250
                         Excluding REOs
230
                         Including REOs
210

190
170

150
130

110
90
      2000


                  2001


                           2002


                                    2003


                                             2004


                                                        2005


                                                                   2006


                                                                            2007


                                                                                      2008


                                                                                                2009
                                   Source: LPS Applied Analytics


               Tennessee: Changes in Hom e Prices Based on a Repeat Sales
                                                    Model
                                            (Jan 2000=100)
150


140                      Excluding REOs

                         Including REOs
130


120


110

100


90
      2000


                  2001


                           2002


                                    2003


                                             2004


                                                        2005


                                                                   2006


                                                                            2007


                                                                                      2008


                                                                                                2009
                                   Source: LPS Applied Analytics


             Wisconsin: Changes in Hom e Prices Based on a Repeat Sales Model
                                            (Jan 2000=100)

170

160
                         Excluding REOs
150
                         Including REOs
140

130

120

110

100

90
      2000


                  2001


                           2002


                                     2003


                                              2004


                                                            2005


                                                                     2006


                                                                               2007


                                                                                         2008


                                                                                                       2009


                                   Source: LPS Applied Analytics
Washington: Changes in Hom e Prices Based on a Repeat Sales
                                                   Model
                                           (Jan 2000=100)
210


190                      Excluding REOs

                         Including REOs
170


150


130

110


90
      2000


                  2001


                           2002


                                    2003


                                            2004


                                                       2005


                                                              2006


                                                                     2007


                                                                            2008


                                                                                   2009
                                   Source: LPS Applied Analytics


             Minnesota: Changes in Hom e Prices Based on a Repeat Sales Model
                                           (Jan 2000=100)

180

170
                         Excluding REOs
160
                         Including REOs
150

140

130

120

110

100
      2000


                  2001


                           2002


                                    2003


                                            2004


                                                       2005


                                                              2006


                                                                     2007


                                                                            2008


                                                                                   2009
                                   Source: LPS Applied Analytics


             Alabam a: Changes in Hom e Prices Based on a Repeat Sales Model
                                           (Jan 2000=100)

160


150                      Excluding REOs

                         Including REOs
140


130


120

110


100
      2000


                  2001


                           2002


                                    2003


                                            2004


                                                       2005


                                                              2006


                                                                     2007


                                                                            2008


                                                                                   2009


                                   Source: LPS Applied Analytics
Arizona: Changes in Hom e Prices Based on a Repeat Sales Model
                                          (Jan 2000=100)

240

220                     Excluding REOs

200                     Including REOs

180

160

140

120

100
      2000


                 2001


                          2002


                                   2003


                                           2004


                                                   2005


                                                           2006


                                                                  2007


                                                                         2008


                                                                                2009
                                  Source: LPS Applied Analytics


             Kentucky: Changes in Hom e Prices Based on a Repeat Sales Model
                                          (Jan 2000=100)

140

135
                        Excluding REOs
130
                        Including REOs
125

120

115

110

105

100
      2000


                 2001


                          2002


                                   2003


                                           2004


                                                   2005


                                                           2006


                                                                  2007


                                                                         2008


                                                                                2009
                                  Source: LPS Applied Analytics
Colorado: Changes in Hom e Prices Based on a Repeat Sales Model
                                            (Jan 2000=100)

145
140
                         Excluding REOs
135
                         Including REOs
130

125
120

115
110

105
100
      2000


                 2001


                           2002


                                    2003


                                             2004


                                                      2005


                                                               2006


                                                                        2007


                                                                                  2008


                                                                                            2009
                                   Source: LPS Applied Analytics


             Maryland: Changes in Hom e Prices Based on a Repeat Sales Model
                                            (Jan 2000=100)

240

220                      Excluding REOs

200                      Including REOs

180

160

140

120

100
      2000


                 2001


                           2002


                                    2003


                                             2004


                                                      2005


                                                               2006


                                                                        2007


                                                                                  2008


                                   Source: LPS Applied Analytics                            2009


             Oklahom a: Changes in Hom e Prices Based on a Repeat Sales Model
                                            (Jan 2000=100)

150
145
                         Excluding REOs
140
135                      Including REOs

130
125
120
115
110
105
100
      2000


                  2001


                            2002


                                     2003


                                               2004


                                                        2005


                                                                 2006


                                                                           2007


                                                                                     2008


                                                                                                   2009


                                   Source: LPS Applied Analytics
South Carolina: Changes in Hom e Prices Based on a Repeat Sales
                                                    Model
                                                (Jan 2000=100)
160


150                         Excluding REOs

                            Including REOs
140


130


120

110


100
      2000


                   2001


                              2002


                                       2003


                                                 2004


                                                            2005


                                                                     2006


                                                                              2007


                                                                                       2008


                                                                                                2009
                                       Source: LPS Applied Analytics


                Iow a: Changes in Hom e Prices Based on a Repeat Sales Model
                                                (Jan 2000=100)

135

130                         Excluding REOs

125                         Including REOs

120

115

110

105

100
      2000


                   2001


                              2002


                                       2003


                                                 2004


                                                            2005


                                                                     2006


                                                                              2007


                                                                                       2008


                                                                                                2009
                                       Source: LPS Applied Analytics


                Oregon: Changes in Hom e Prices Based on a Repeat Sales Model
                                                 (Jan 2000=100)

 200
 190
                             Excluding REOs
 180
 170                         Including REOs

 160
 150
 140
 130
 120
 110
 100
        2000


                     2001


                                2002


                                         2003


                                                   2004


                                                              2005


                                                                       2006


                                                                                2007


                                                                                         2008


                                                                                                  2009


                                        Source: LPS Applied Analytics
Connecticut: Changes in Hom e Prices Based on a Repeat Sales
                                                  Model
                                          (Jan 2000=100)
220


200                     Excluding REOs

                        Including REOs
180


160


140

120


100
      2000


                 2001


                          2002


                                   2003


                                           2004


                                                          2005


                                                                 2006


                                                                        2007


                                                                               2008


                                                                                      2009
                                  Source: LPS Applied Analytics


             Arkansas: Changes in Hom e Prices Based on a Repeat Sales Model
                                          (Jan 2000=100)

150
145
                        Excluding REOs
140
135                     Including REOs

130
125
120
115
110
105
100
      2000


                 2001


                          2002


                                   2003


                                           2004


                                                      2005


                                                                 2006


                                                                        2007


                                                                               2008


                                                                                      2009


                                  Source: LPS Applied Analytics
Nebraska: Changes in Hom e Prices Based on a Repeat Sales Model
                                          (Jan 2000=100)

135

130                     Excluding REOs

125                     Including REOs

120

115

110

105

100
      2000


                 2001


                          2002


                                   2003


                                           2004


                                                      2005


                                                             2006


                                                                    2007


                                                                           2008


                                                                                  2009
                                  Source: LPS Applied Analytics


              Nevada: Changes in Hom e Prices Based on a Repeat Sales Model
                                          (Jan 2000=100)

240

220
                        Excluding REOs
200
                        Including REOs
180

160

140

120

100

80
      2000


                 2001


                          2002


                                   2003


                                           2004


                                                      2005


                                                             2006


                                                                    2007


                                                                           2008


                                                                                  2009
                                  Source: LPS Applied Analytics


             New Ham pshire: Changes in Hom e Prices Based on a Repeat Sales
                                                  Model
                                          (Jan 2000=100)
220


200                     Excluding REOs

                        Including REOs
180


160


140

120


100
      2000


                 2001


                          2002


                                   2003


                                           2004


                                                      2005


                                                             2006


                                                                    2007


                                                                           2008


                                                                                  2009


                                  Source: LPS Applied Analytics
Rhode Island: Changes in Hom e Prices Based on a Repeat Sales
                                                 Model
                                         (Jan 2000=100)
260

240
                       Excluding REOs
220
                       Including REOs
200

180

160

140

120

100
      2000


                2001


                         2002


                                  2003


                                          2004


                                                     2005


                                                            2006


                                                                   2007


                                                                          2008


                                                                                 2009
                                 Source: LPS Applied Analytics


             Haw aii: Changes in Hom e Prices Based on a Repeat Sales Model
                                         (Jan 2000=100)

300
280
                       Excluding REOs
260
240                    Including REOs

220
200
180
160
140
120
100
      2000


                2001


                         2002


                                  2003


                                          2004


                                                     2005


                                                            2006


                                                                   2007


                                                                          2008


                                                                                 2009


                                 Source: LPS Applied Analytics
Delaw are: Changes in Hom e Prices Based on a Repeat Sales Model
                                                                       (Jan 2000=100)

                     200
                     190
                                               Excluding REOs
                     180
                     170                       Including REOs

                     160
                     150
                     140
                     130
                     120
                     110
                     100
                            2000


                                        2001


                                                   2002


                                                                2003


                                                                                2004


                                                                                              2005


                                                                                                            2006


                                                                                                                          2007


                                                                                                                                        2008
                                                          Source: LPS Applied Analytics


                                     District of Colum bia: Changes in Hom e Prices Based on a Repeat
                                                                        Sales Model
                                                                        (Jan 2000=100)
                      350


                                                Excluding REOs
                      300
                                                Including REOs

                      250


                      200


                      150


                      100
                              2000


                                        2001


                                                  2002


                                                           2003


                                                                         2004


                                                                                       2005


                                                                                                     2006


                                                                                                                   2007


                                                                                                                                 2008


                                                                                                                                           2009
                                                           Source: LPS Applied Analytics


Note: In some states, the data represents market activity in major metropolitan areas only.

Weitere ähnliche Inhalte

Was ist angesagt?

Expected us gdp growth rate presentation
Expected us gdp growth rate presentationExpected us gdp growth rate presentation
Expected us gdp growth rate presentationVictoria Rock
 
Residential Movement in the Greater Washington DC Area
Residential Movement in the Greater Washington DC AreaResidential Movement in the Greater Washington DC Area
Residential Movement in the Greater Washington DC AreaNar Res
 
Executive aviation embraer day 2011 03_25(final) vimp
Executive aviation embraer day 2011 03_25(final) vimpExecutive aviation embraer day 2011 03_25(final) vimp
Executive aviation embraer day 2011 03_25(final) vimpEmbraer RI
 
Executive aviation embraer_day_2011
Executive aviation embraer_day_2011Executive aviation embraer_day_2011
Executive aviation embraer_day_2011Embraer RI
 
Pending Home Sales - August 3, 2010
Pending Home Sales - August 3, 2010Pending Home Sales - August 3, 2010
Pending Home Sales - August 3, 2010NAR Research
 
Food Prices, Consumption and Nutrition in Ethiopia:Implications of Recent Pri...
Food Prices, Consumption and Nutrition in Ethiopia:Implications of Recent Pri...Food Prices, Consumption and Nutrition in Ethiopia:Implications of Recent Pri...
Food Prices, Consumption and Nutrition in Ethiopia:Implications of Recent Pri...guest9970726
 
World Economic Situation And Prospects 2009 2010
World Economic Situation And Prospects 2009 2010World Economic Situation And Prospects 2009 2010
World Economic Situation And Prospects 2009 2010icgfmconference
 
Roy Webb - national economic conditions
Roy Webb  - national economic conditionsRoy Webb  - national economic conditions
Roy Webb - national economic conditionslynchburg
 
Asia-Pacific Regional Economic Outlook: Navigating an Uncertain Global Enviro...
Asia-Pacific Regional Economic Outlook: Navigating an Uncertain Global Enviro...Asia-Pacific Regional Economic Outlook: Navigating an Uncertain Global Enviro...
Asia-Pacific Regional Economic Outlook: Navigating an Uncertain Global Enviro...ggrey
 
Calculation And Sensitivity Analysis Of The Infrastructure Leakage Index
Calculation And Sensitivity Analysis Of The Infrastructure Leakage IndexCalculation And Sensitivity Analysis Of The Infrastructure Leakage Index
Calculation And Sensitivity Analysis Of The Infrastructure Leakage IndexAaron Burton
 
Moz public invst-agriculture
Moz public invst-agricultureMoz public invst-agriculture
Moz public invst-agricultureIFPRI-Maputo
 
The Asia-Pacific Economic Outlook and Policy Challenges in an Uncertain Globa...
The Asia-Pacific Economic Outlook and Policy Challenges in an Uncertain Globa...The Asia-Pacific Economic Outlook and Policy Challenges in an Uncertain Globa...
The Asia-Pacific Economic Outlook and Policy Challenges in an Uncertain Globa...Arangkada Philippines
 
The future of academic library websites
The future of academic library websitesThe future of academic library websites
The future of academic library websitesPamela Carson
 
Summary of NOVEMBER 2010 Pending Home Sales Statistics
Summary of NOVEMBER 2010 Pending Home Sales StatisticsSummary of NOVEMBER 2010 Pending Home Sales Statistics
Summary of NOVEMBER 2010 Pending Home Sales StatisticsNAR Research
 
Disease Control and Prevention in Australia
Disease Control and Prevention in AustraliaDisease Control and Prevention in Australia
Disease Control and Prevention in AustraliaDepartment of Health
 
Amsa annual national leadership development seminar 30 aug 2010
Amsa annual national leadership development seminar   30 aug 2010Amsa annual national leadership development seminar   30 aug 2010
Amsa annual national leadership development seminar 30 aug 2010Department of Health
 
Execution 04 To 10[1]
Execution 04 To 10[1]Execution 04 To 10[1]
Execution 04 To 10[1]mcoombs57
 

Was ist angesagt? (20)

Expected us gdp growth rate presentation
Expected us gdp growth rate presentationExpected us gdp growth rate presentation
Expected us gdp growth rate presentation
 
Residential Movement in the Greater Washington DC Area
Residential Movement in the Greater Washington DC AreaResidential Movement in the Greater Washington DC Area
Residential Movement in the Greater Washington DC Area
 
Australia's Future Health
Australia's Future HealthAustralia's Future Health
Australia's Future Health
 
Executive aviation embraer day 2011 03_25(final) vimp
Executive aviation embraer day 2011 03_25(final) vimpExecutive aviation embraer day 2011 03_25(final) vimp
Executive aviation embraer day 2011 03_25(final) vimp
 
Executive aviation embraer_day_2011
Executive aviation embraer_day_2011Executive aviation embraer_day_2011
Executive aviation embraer_day_2011
 
Summer Institute 2012: Nebraska Office of Highway Safety
Summer Institute 2012: Nebraska Office of Highway SafetySummer Institute 2012: Nebraska Office of Highway Safety
Summer Institute 2012: Nebraska Office of Highway Safety
 
Pending Home Sales - August 3, 2010
Pending Home Sales - August 3, 2010Pending Home Sales - August 3, 2010
Pending Home Sales - August 3, 2010
 
Food Prices, Consumption and Nutrition in Ethiopia:Implications of Recent Pri...
Food Prices, Consumption and Nutrition in Ethiopia:Implications of Recent Pri...Food Prices, Consumption and Nutrition in Ethiopia:Implications of Recent Pri...
Food Prices, Consumption and Nutrition in Ethiopia:Implications of Recent Pri...
 
World Economic Situation And Prospects 2009 2010
World Economic Situation And Prospects 2009 2010World Economic Situation And Prospects 2009 2010
World Economic Situation And Prospects 2009 2010
 
Roy Webb - national economic conditions
Roy Webb  - national economic conditionsRoy Webb  - national economic conditions
Roy Webb - national economic conditions
 
Asia-Pacific Regional Economic Outlook: Navigating an Uncertain Global Enviro...
Asia-Pacific Regional Economic Outlook: Navigating an Uncertain Global Enviro...Asia-Pacific Regional Economic Outlook: Navigating an Uncertain Global Enviro...
Asia-Pacific Regional Economic Outlook: Navigating an Uncertain Global Enviro...
 
Calculation And Sensitivity Analysis Of The Infrastructure Leakage Index
Calculation And Sensitivity Analysis Of The Infrastructure Leakage IndexCalculation And Sensitivity Analysis Of The Infrastructure Leakage Index
Calculation And Sensitivity Analysis Of The Infrastructure Leakage Index
 
Moz public invst-agriculture
Moz public invst-agricultureMoz public invst-agriculture
Moz public invst-agriculture
 
The Asia-Pacific Economic Outlook and Policy Challenges in an Uncertain Globa...
The Asia-Pacific Economic Outlook and Policy Challenges in an Uncertain Globa...The Asia-Pacific Economic Outlook and Policy Challenges in an Uncertain Globa...
The Asia-Pacific Economic Outlook and Policy Challenges in an Uncertain Globa...
 
The future of academic library websites
The future of academic library websitesThe future of academic library websites
The future of academic library websites
 
Summary of NOVEMBER 2010 Pending Home Sales Statistics
Summary of NOVEMBER 2010 Pending Home Sales StatisticsSummary of NOVEMBER 2010 Pending Home Sales Statistics
Summary of NOVEMBER 2010 Pending Home Sales Statistics
 
Clinical Trials in Australia
Clinical Trials in AustraliaClinical Trials in Australia
Clinical Trials in Australia
 
Disease Control and Prevention in Australia
Disease Control and Prevention in AustraliaDisease Control and Prevention in Australia
Disease Control and Prevention in Australia
 
Amsa annual national leadership development seminar 30 aug 2010
Amsa annual national leadership development seminar   30 aug 2010Amsa annual national leadership development seminar   30 aug 2010
Amsa annual national leadership development seminar 30 aug 2010
 
Execution 04 To 10[1]
Execution 04 To 10[1]Execution 04 To 10[1]
Execution 04 To 10[1]
 

Andere mochten auch

Garden power point
Garden power pointGarden power point
Garden power pointzoekatleman
 
Dan Whitehead Arbor Day Flyer
Dan Whitehead Arbor Day FlyerDan Whitehead Arbor Day Flyer
Dan Whitehead Arbor Day Flyercarlahaight
 
GA: Schoolyard Wildlife Habitat Planning Guide
GA: Schoolyard Wildlife Habitat Planning GuideGA: Schoolyard Wildlife Habitat Planning Guide
GA: Schoolyard Wildlife Habitat Planning GuideSotirakou964
 
2009 Sfe Awards Presentation
2009 Sfe Awards Presentation2009 Sfe Awards Presentation
2009 Sfe Awards PresentationMonica David
 
Garden Tour Power Point test
Garden Tour Power Point testGarden Tour Power Point test
Garden Tour Power Point testcarlahaight
 
Impact Of Foreclosures On Home Prices
Impact Of Foreclosures On Home PricesImpact Of Foreclosures On Home Prices
Impact Of Foreclosures On Home Pricescarlahaight
 

Andere mochten auch (7)

Garden power point
Garden power pointGarden power point
Garden power point
 
Dan Whitehead Arbor Day Flyer
Dan Whitehead Arbor Day FlyerDan Whitehead Arbor Day Flyer
Dan Whitehead Arbor Day Flyer
 
School Community Gardens: School Ground Greening
School Community Gardens: School Ground GreeningSchool Community Gardens: School Ground Greening
School Community Gardens: School Ground Greening
 
GA: Schoolyard Wildlife Habitat Planning Guide
GA: Schoolyard Wildlife Habitat Planning GuideGA: Schoolyard Wildlife Habitat Planning Guide
GA: Schoolyard Wildlife Habitat Planning Guide
 
2009 Sfe Awards Presentation
2009 Sfe Awards Presentation2009 Sfe Awards Presentation
2009 Sfe Awards Presentation
 
Garden Tour Power Point test
Garden Tour Power Point testGarden Tour Power Point test
Garden Tour Power Point test
 
Impact Of Foreclosures On Home Prices
Impact Of Foreclosures On Home PricesImpact Of Foreclosures On Home Prices
Impact Of Foreclosures On Home Prices
 

Ähnlich wie Price Decline By States

Nci Funding Charts 2009
Nci Funding Charts 2009Nci Funding Charts 2009
Nci Funding Charts 2009pdallen1
 
Wind in our Sails - The coming of Europe's offshore wind energy industry
Wind in our Sails - The coming of Europe's offshore wind energy industryWind in our Sails - The coming of Europe's offshore wind energy industry
Wind in our Sails - The coming of Europe's offshore wind energy industryEWEA - European Wind Energy Association
 
Understanding The Recession
Understanding The RecessionUnderstanding The Recession
Understanding The RecessionnfpSynergy
 
The CEO’s Dilemma - How to drive efficient innovation in the organization
The CEO’s Dilemma - How to drive efficient innovation in the organizationThe CEO’s Dilemma - How to drive efficient innovation in the organization
The CEO’s Dilemma - How to drive efficient innovation in the organizationJoeBarkai
 
Measuring maize (Zea mays L.) cultivar coefficients for modeling water-limit...
Measuring maize (Zea mays L.) cultivar  coefficients for modeling water-limit...Measuring maize (Zea mays L.) cultivar  coefficients for modeling water-limit...
Measuring maize (Zea mays L.) cultivar coefficients for modeling water-limit...RUFORUM
 
03 05-13 ucan @ piedmont economics club
03 05-13 ucan @ piedmont economics club03 05-13 ucan @ piedmont economics club
03 05-13 ucan @ piedmont economics clubMatt Dunbar
 
The crisis in Ireland in graphs and maps
The crisis in Ireland in graphs and mapsThe crisis in Ireland in graphs and maps
The crisis in Ireland in graphs and mapsrobkitchin
 
Absolute Radio Network Q42012 RAJAR
Absolute Radio Network Q42012 RAJARAbsolute Radio Network Q42012 RAJAR
Absolute Radio Network Q42012 RAJARClive Dickens
 
Credit Suisse Chemical and Ag Science Conference
	 Credit Suisse Chemical and Ag Science Conference	 Credit Suisse Chemical and Ag Science Conference
Credit Suisse Chemical and Ag Science Conferencefinance5
 
GRI Conference - 27 May - Pinkse -Carbon Disclosure Panel
GRI Conference - 27 May - Pinkse -Carbon Disclosure PanelGRI Conference - 27 May - Pinkse -Carbon Disclosure Panel
GRI Conference - 27 May - Pinkse -Carbon Disclosure PanelGlobal Reporting Initiative
 
Presentation-Cyprus debt crisis
Presentation-Cyprus debt crisisPresentation-Cyprus debt crisis
Presentation-Cyprus debt crisisStavros A. Zenios
 

Ähnlich wie Price Decline By States (20)

Nci Funding Charts 2009
Nci Funding Charts 2009Nci Funding Charts 2009
Nci Funding Charts 2009
 
Wind in our Sails - The coming of Europe's offshore wind energy industry
Wind in our Sails - The coming of Europe's offshore wind energy industryWind in our Sails - The coming of Europe's offshore wind energy industry
Wind in our Sails - The coming of Europe's offshore wind energy industry
 
Strengthening pensions: the economic context
Strengthening pensions: the economic contextStrengthening pensions: the economic context
Strengthening pensions: the economic context
 
Visual CV
Visual CVVisual CV
Visual CV
 
Seminar 13 Mar 2013 - Session 4 - Smallholders oil palm production in Indones...
Seminar 13 Mar 2013 - Session 4 - Smallholders oil palm production in Indones...Seminar 13 Mar 2013 - Session 4 - Smallholders oil palm production in Indones...
Seminar 13 Mar 2013 - Session 4 - Smallholders oil palm production in Indones...
 
Expected u
Expected uExpected u
Expected u
 
Pilar Ramirez, Microcredit and Job Creation
Pilar Ramirez, Microcredit and Job CreationPilar Ramirez, Microcredit and Job Creation
Pilar Ramirez, Microcredit and Job Creation
 
Understanding The Recession
Understanding The RecessionUnderstanding The Recession
Understanding The Recession
 
The CEO’s Dilemma - How to drive efficient innovation in the organization
The CEO’s Dilemma - How to drive efficient innovation in the organizationThe CEO’s Dilemma - How to drive efficient innovation in the organization
The CEO’s Dilemma - How to drive efficient innovation in the organization
 
Liberty2012
Liberty2012Liberty2012
Liberty2012
 
Measuring maize (Zea mays L.) cultivar coefficients for modeling water-limit...
Measuring maize (Zea mays L.) cultivar  coefficients for modeling water-limit...Measuring maize (Zea mays L.) cultivar  coefficients for modeling water-limit...
Measuring maize (Zea mays L.) cultivar coefficients for modeling water-limit...
 
03 05-13 ucan @ piedmont economics club
03 05-13 ucan @ piedmont economics club03 05-13 ucan @ piedmont economics club
03 05-13 ucan @ piedmont economics club
 
The crisis in Ireland in graphs and maps
The crisis in Ireland in graphs and mapsThe crisis in Ireland in graphs and maps
The crisis in Ireland in graphs and maps
 
Heart Disease and Stroke in Utah 2010
Heart Disease and Stroke in Utah 2010Heart Disease and Stroke in Utah 2010
Heart Disease and Stroke in Utah 2010
 
Absolute Radio Network Q42012 RAJAR
Absolute Radio Network Q42012 RAJARAbsolute Radio Network Q42012 RAJAR
Absolute Radio Network Q42012 RAJAR
 
It Transformation
It TransformationIt Transformation
It Transformation
 
Uars status
Uars statusUars status
Uars status
 
Credit Suisse Chemical and Ag Science Conference
	 Credit Suisse Chemical and Ag Science Conference	 Credit Suisse Chemical and Ag Science Conference
Credit Suisse Chemical and Ag Science Conference
 
GRI Conference - 27 May - Pinkse -Carbon Disclosure Panel
GRI Conference - 27 May - Pinkse -Carbon Disclosure PanelGRI Conference - 27 May - Pinkse -Carbon Disclosure Panel
GRI Conference - 27 May - Pinkse -Carbon Disclosure Panel
 
Presentation-Cyprus debt crisis
Presentation-Cyprus debt crisisPresentation-Cyprus debt crisis
Presentation-Cyprus debt crisis
 

Kürzlich hochgeladen

Italy vs Albania Italy Euro 2024 squad Luciano Spalletti's full team ahead of...
Italy vs Albania Italy Euro 2024 squad Luciano Spalletti's full team ahead of...Italy vs Albania Italy Euro 2024 squad Luciano Spalletti's full team ahead of...
Italy vs Albania Italy Euro 2024 squad Luciano Spalletti's full team ahead of...Eticketing.co
 
Spain Vs Italy Spain to be banned from participating in Euro 2024.docx
Spain Vs Italy Spain to be banned from participating in Euro 2024.docxSpain Vs Italy Spain to be banned from participating in Euro 2024.docx
Spain Vs Italy Spain to be banned from participating in Euro 2024.docxWorld Wide Tickets And Hospitality
 
European Football Icons that Missed Opportunities at UEFA Euro 2024.docx
European Football Icons that Missed Opportunities at UEFA Euro 2024.docxEuropean Football Icons that Missed Opportunities at UEFA Euro 2024.docx
European Football Icons that Missed Opportunities at UEFA Euro 2024.docxEuro Cup 2024 Tickets
 
Albania Vs Spain South American coaches lead Albania to Euro 2024 spot.docx
Albania Vs Spain South American coaches lead Albania to Euro 2024 spot.docxAlbania Vs Spain South American coaches lead Albania to Euro 2024 spot.docx
Albania Vs Spain South American coaches lead Albania to Euro 2024 spot.docxWorld Wide Tickets And Hospitality
 
Sports Writing (Rules,Tips, Examples, etc)
Sports Writing (Rules,Tips, Examples, etc)Sports Writing (Rules,Tips, Examples, etc)
Sports Writing (Rules,Tips, Examples, etc)CMBustamante
 
Who Is Emmanuel Katto Uganda? His Career, personal life etc.
Who Is Emmanuel Katto Uganda? His Career, personal life etc.Who Is Emmanuel Katto Uganda? His Career, personal life etc.
Who Is Emmanuel Katto Uganda? His Career, personal life etc.Marina Costa
 
JORNADA 5 LIGA MURO 2024INSUGURACION.pdf
JORNADA 5 LIGA MURO 2024INSUGURACION.pdfJORNADA 5 LIGA MURO 2024INSUGURACION.pdf
JORNADA 5 LIGA MURO 2024INSUGURACION.pdfArturo Pacheco Alvarez
 
UEFA Euro 2024 Squad Check-in Who is Most Favorite.docx
UEFA Euro 2024 Squad Check-in Who is Most Favorite.docxUEFA Euro 2024 Squad Check-in Who is Most Favorite.docx
UEFA Euro 2024 Squad Check-in Who is Most Favorite.docxEuro Cup 2024 Tickets
 
Hire 💕 8617697112 Kasauli Call Girls Service Call Girls Agency
Hire 💕 8617697112 Kasauli Call Girls Service Call Girls AgencyHire 💕 8617697112 Kasauli Call Girls Service Call Girls Agency
Hire 💕 8617697112 Kasauli Call Girls Service Call Girls AgencyNitya salvi
 
JORNADA 6 LIGA MURO 2024TUXTEPECOAXACA.pdf
JORNADA 6 LIGA MURO 2024TUXTEPECOAXACA.pdfJORNADA 6 LIGA MURO 2024TUXTEPECOAXACA.pdf
JORNADA 6 LIGA MURO 2024TUXTEPECOAXACA.pdfArturo Pacheco Alvarez
 
Personal Brand Exploration - By Bradley Dennis
Personal Brand Exploration - By Bradley DennisPersonal Brand Exploration - By Bradley Dennis
Personal Brand Exploration - By Bradley Dennisjocksofalltradespodc
 
Technical Data | Sig Sauer Easy6 BDX 1-6x24 | Optics Trade
Technical Data | Sig Sauer Easy6 BDX 1-6x24 | Optics TradeTechnical Data | Sig Sauer Easy6 BDX 1-6x24 | Optics Trade
Technical Data | Sig Sauer Easy6 BDX 1-6x24 | Optics TradeOptics-Trade
 
Unveiling the Mystery of Main Bazar Chart
Unveiling the Mystery of Main Bazar ChartUnveiling the Mystery of Main Bazar Chart
Unveiling the Mystery of Main Bazar ChartChart Kalyan
 
Sector 62, Noida Call girls :8448380779 Model Escorts | 100% verified
Sector 62, Noida Call girls :8448380779 Model Escorts | 100% verifiedSector 62, Noida Call girls :8448380779 Model Escorts | 100% verified
Sector 62, Noida Call girls :8448380779 Model Escorts | 100% verifiedDelhi Call girls
 
2k Shots ≽ 9205541914 ≼ Call Girls In Sheikh Sarai (Delhi)
2k Shots ≽ 9205541914 ≼ Call Girls In Sheikh Sarai (Delhi)2k Shots ≽ 9205541914 ≼ Call Girls In Sheikh Sarai (Delhi)
2k Shots ≽ 9205541914 ≼ Call Girls In Sheikh Sarai (Delhi)Delhi Call girls
 
Slovenia Vs Serbia UEFA Euro 2024 Fixture Guide Every Fixture Detailed.docx
Slovenia Vs Serbia UEFA Euro 2024 Fixture Guide Every Fixture Detailed.docxSlovenia Vs Serbia UEFA Euro 2024 Fixture Guide Every Fixture Detailed.docx
Slovenia Vs Serbia UEFA Euro 2024 Fixture Guide Every Fixture Detailed.docxWorld Wide Tickets And Hospitality
 
Croatia vs Italy Euro Cup 2024 Three pitfalls for Spalletti’s Italy in Group ...
Croatia vs Italy Euro Cup 2024 Three pitfalls for Spalletti’s Italy in Group ...Croatia vs Italy Euro Cup 2024 Three pitfalls for Spalletti’s Italy in Group ...
Croatia vs Italy Euro Cup 2024 Three pitfalls for Spalletti’s Italy in Group ...Eticketing.co
 
Cricket Api Solution.pdfCricket Api Solution.pdf
Cricket Api Solution.pdfCricket Api Solution.pdfCricket Api Solution.pdfCricket Api Solution.pdf
Cricket Api Solution.pdfCricket Api Solution.pdfLatiyalinfotech
 
UEFA Euro 2024 Squad Check-in Which team is Top favorite.docx
UEFA Euro 2024 Squad Check-in Which team is Top favorite.docxUEFA Euro 2024 Squad Check-in Which team is Top favorite.docx
UEFA Euro 2024 Squad Check-in Which team is Top favorite.docxEuro Cup 2024 Tickets
 
WhatsApp Chat: 📞 8617697112 Birbhum Call Girl available for hotel room package
WhatsApp Chat: 📞 8617697112 Birbhum  Call Girl available for hotel room packageWhatsApp Chat: 📞 8617697112 Birbhum  Call Girl available for hotel room package
WhatsApp Chat: 📞 8617697112 Birbhum Call Girl available for hotel room packageNitya salvi
 

Kürzlich hochgeladen (20)

Italy vs Albania Italy Euro 2024 squad Luciano Spalletti's full team ahead of...
Italy vs Albania Italy Euro 2024 squad Luciano Spalletti's full team ahead of...Italy vs Albania Italy Euro 2024 squad Luciano Spalletti's full team ahead of...
Italy vs Albania Italy Euro 2024 squad Luciano Spalletti's full team ahead of...
 
Spain Vs Italy Spain to be banned from participating in Euro 2024.docx
Spain Vs Italy Spain to be banned from participating in Euro 2024.docxSpain Vs Italy Spain to be banned from participating in Euro 2024.docx
Spain Vs Italy Spain to be banned from participating in Euro 2024.docx
 
European Football Icons that Missed Opportunities at UEFA Euro 2024.docx
European Football Icons that Missed Opportunities at UEFA Euro 2024.docxEuropean Football Icons that Missed Opportunities at UEFA Euro 2024.docx
European Football Icons that Missed Opportunities at UEFA Euro 2024.docx
 
Albania Vs Spain South American coaches lead Albania to Euro 2024 spot.docx
Albania Vs Spain South American coaches lead Albania to Euro 2024 spot.docxAlbania Vs Spain South American coaches lead Albania to Euro 2024 spot.docx
Albania Vs Spain South American coaches lead Albania to Euro 2024 spot.docx
 
Sports Writing (Rules,Tips, Examples, etc)
Sports Writing (Rules,Tips, Examples, etc)Sports Writing (Rules,Tips, Examples, etc)
Sports Writing (Rules,Tips, Examples, etc)
 
Who Is Emmanuel Katto Uganda? His Career, personal life etc.
Who Is Emmanuel Katto Uganda? His Career, personal life etc.Who Is Emmanuel Katto Uganda? His Career, personal life etc.
Who Is Emmanuel Katto Uganda? His Career, personal life etc.
 
JORNADA 5 LIGA MURO 2024INSUGURACION.pdf
JORNADA 5 LIGA MURO 2024INSUGURACION.pdfJORNADA 5 LIGA MURO 2024INSUGURACION.pdf
JORNADA 5 LIGA MURO 2024INSUGURACION.pdf
 
UEFA Euro 2024 Squad Check-in Who is Most Favorite.docx
UEFA Euro 2024 Squad Check-in Who is Most Favorite.docxUEFA Euro 2024 Squad Check-in Who is Most Favorite.docx
UEFA Euro 2024 Squad Check-in Who is Most Favorite.docx
 
Hire 💕 8617697112 Kasauli Call Girls Service Call Girls Agency
Hire 💕 8617697112 Kasauli Call Girls Service Call Girls AgencyHire 💕 8617697112 Kasauli Call Girls Service Call Girls Agency
Hire 💕 8617697112 Kasauli Call Girls Service Call Girls Agency
 
JORNADA 6 LIGA MURO 2024TUXTEPECOAXACA.pdf
JORNADA 6 LIGA MURO 2024TUXTEPECOAXACA.pdfJORNADA 6 LIGA MURO 2024TUXTEPECOAXACA.pdf
JORNADA 6 LIGA MURO 2024TUXTEPECOAXACA.pdf
 
Personal Brand Exploration - By Bradley Dennis
Personal Brand Exploration - By Bradley DennisPersonal Brand Exploration - By Bradley Dennis
Personal Brand Exploration - By Bradley Dennis
 
Technical Data | Sig Sauer Easy6 BDX 1-6x24 | Optics Trade
Technical Data | Sig Sauer Easy6 BDX 1-6x24 | Optics TradeTechnical Data | Sig Sauer Easy6 BDX 1-6x24 | Optics Trade
Technical Data | Sig Sauer Easy6 BDX 1-6x24 | Optics Trade
 
Unveiling the Mystery of Main Bazar Chart
Unveiling the Mystery of Main Bazar ChartUnveiling the Mystery of Main Bazar Chart
Unveiling the Mystery of Main Bazar Chart
 
Sector 62, Noida Call girls :8448380779 Model Escorts | 100% verified
Sector 62, Noida Call girls :8448380779 Model Escorts | 100% verifiedSector 62, Noida Call girls :8448380779 Model Escorts | 100% verified
Sector 62, Noida Call girls :8448380779 Model Escorts | 100% verified
 
2k Shots ≽ 9205541914 ≼ Call Girls In Sheikh Sarai (Delhi)
2k Shots ≽ 9205541914 ≼ Call Girls In Sheikh Sarai (Delhi)2k Shots ≽ 9205541914 ≼ Call Girls In Sheikh Sarai (Delhi)
2k Shots ≽ 9205541914 ≼ Call Girls In Sheikh Sarai (Delhi)
 
Slovenia Vs Serbia UEFA Euro 2024 Fixture Guide Every Fixture Detailed.docx
Slovenia Vs Serbia UEFA Euro 2024 Fixture Guide Every Fixture Detailed.docxSlovenia Vs Serbia UEFA Euro 2024 Fixture Guide Every Fixture Detailed.docx
Slovenia Vs Serbia UEFA Euro 2024 Fixture Guide Every Fixture Detailed.docx
 
Croatia vs Italy Euro Cup 2024 Three pitfalls for Spalletti’s Italy in Group ...
Croatia vs Italy Euro Cup 2024 Three pitfalls for Spalletti’s Italy in Group ...Croatia vs Italy Euro Cup 2024 Three pitfalls for Spalletti’s Italy in Group ...
Croatia vs Italy Euro Cup 2024 Three pitfalls for Spalletti’s Italy in Group ...
 
Cricket Api Solution.pdfCricket Api Solution.pdf
Cricket Api Solution.pdfCricket Api Solution.pdfCricket Api Solution.pdfCricket Api Solution.pdf
Cricket Api Solution.pdfCricket Api Solution.pdf
 
UEFA Euro 2024 Squad Check-in Which team is Top favorite.docx
UEFA Euro 2024 Squad Check-in Which team is Top favorite.docxUEFA Euro 2024 Squad Check-in Which team is Top favorite.docx
UEFA Euro 2024 Squad Check-in Which team is Top favorite.docx
 
WhatsApp Chat: 📞 8617697112 Birbhum Call Girl available for hotel room package
WhatsApp Chat: 📞 8617697112 Birbhum  Call Girl available for hotel room packageWhatsApp Chat: 📞 8617697112 Birbhum  Call Girl available for hotel room package
WhatsApp Chat: 📞 8617697112 Birbhum Call Girl available for hotel room package
 

Price Decline By States

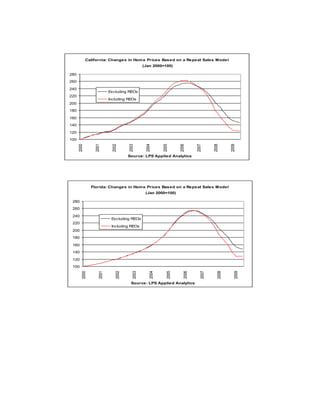
  • 1. California: Changes in Hom e Prices Based on a Repeat Sales Model (Jan 2000=100) 280 260 240 Excluding REOs 220 Including REOs 200 180 160 140 120 100 2000 2001 2002 2003 2004 2005 2006 2007 2008 2009 Source: LPS Applied Analytics Florida: Changes in Hom e Prices Based on a Repeat Sales Model (Jan 2000=100) 280 260 240 Excluding REOs 220 Including REOs 200 180 160 140 120 100 2000 2001 2002 2003 2004 2005 2006 2007 2008 2009 Source: LPS Applied Analytics
  • 2. Ohio: Changes in Hom e Prices Based on a Repeat Sales Model (Jan 2000=100) 130 125 120 Excluding REOs 115 110 Including REOs 105 100 95 90 85 80 2000 2001 2002 2003 2004 2005 2006 2007 2008 2009 Source: LPS Applied Analytics New York: Changes in Hom e Prices Based on a Repeat Sales Model (Jan 2000=100) 220 200 Excluding REOs 180 Including REOs 160 140 120 100 2000 2001 2002 2003 2004 2005 2006 2007 2008 2009 Source: LPS Applied Analytics
  • 3. Michigan: Changes in Hom e Prices Based on a Repeat Sales Model (Jan 2000=100) 140 130 120 Excluding REOs 110 Including REOs 100 90 80 70 60 50 2000 2001 2002 2003 2004 2005 2006 2007 2008 2009 Source: LPS Applied Analytics Illinois: Changes in Hom e Prices Based on a Repeat Sales Model (Jan 2000=100) 170 160 150 Excluding REOs Including REOs 140 130 120 110 100 2000 2001 2002 2003 2004 2005 2006 2007 2008 2009 Source: LPS Applied Analytics
  • 4. North Carolina: Changes in Hom e Prices Based on a Repeat Sales Model (Jan 2000=100) 140 135 130 Excluding REOs 125 Including REOs 120 115 110 105 100 2000 2001 2002 2003 2004 2005 2006 2007 2008 2009 Source: LPS Applied Analytics New Jersey: Changes in Hom e Prices Based on a Repeat Sales Model (Jan 2000=100) 240 220 200 Excluding REOs Including REOs 180 160 140 120 100 2000 2001 2002 2003 2004 2005 2006 2007 2008 2009 Source: LPS Applied Analytics
  • 5. Massachusetts: Changes in Hom e Prices Based on a Repeat Sales Model (Jan 2000=100) 200 190 180 Excluding REOs 170 160 Including REOs 150 140 130 120 110 100 2000 2001 2002 2003 2004 2005 2006 2007 2008 2009 Source: LPS Applied Analytics Pennsylvania: Changes in Hom e Prices Based on a Repeat Sales Model (Jan 2000=100) 200 190 180 Excluding REOs 170 160 Including REOs 150 140 130 120 110 100 2000 2001 2002 2003 2004 2005 2006 2007 2008 2009 Source: LPS Applied Analytics Georgia: Changes in Hom e Prices Based on a Repeat Sales Model (Jan 2000=100) 135 130 Excluding REOs 125 Including REOs 120 115 110 105 100 95 90 2000 2001 2002 2003 2004 2005 2006 2007 2008 2009 Source: LPS Applied Analytics
  • 6. Virginia: Changes in Hom e Prices Based on a Repeat Sales Model (Jan 2000=100) 270 250 Excluding REOs 230 Including REOs 210 190 170 150 130 110 90 2000 2001 2002 2003 2004 2005 2006 2007 2008 2009 Source: LPS Applied Analytics Tennessee: Changes in Hom e Prices Based on a Repeat Sales Model (Jan 2000=100) 150 140 Excluding REOs Including REOs 130 120 110 100 90 2000 2001 2002 2003 2004 2005 2006 2007 2008 2009 Source: LPS Applied Analytics Wisconsin: Changes in Hom e Prices Based on a Repeat Sales Model (Jan 2000=100) 170 160 Excluding REOs 150 Including REOs 140 130 120 110 100 90 2000 2001 2002 2003 2004 2005 2006 2007 2008 2009 Source: LPS Applied Analytics
  • 7. Washington: Changes in Hom e Prices Based on a Repeat Sales Model (Jan 2000=100) 210 190 Excluding REOs Including REOs 170 150 130 110 90 2000 2001 2002 2003 2004 2005 2006 2007 2008 2009 Source: LPS Applied Analytics Minnesota: Changes in Hom e Prices Based on a Repeat Sales Model (Jan 2000=100) 180 170 Excluding REOs 160 Including REOs 150 140 130 120 110 100 2000 2001 2002 2003 2004 2005 2006 2007 2008 2009 Source: LPS Applied Analytics Alabam a: Changes in Hom e Prices Based on a Repeat Sales Model (Jan 2000=100) 160 150 Excluding REOs Including REOs 140 130 120 110 100 2000 2001 2002 2003 2004 2005 2006 2007 2008 2009 Source: LPS Applied Analytics
  • 8. Arizona: Changes in Hom e Prices Based on a Repeat Sales Model (Jan 2000=100) 240 220 Excluding REOs 200 Including REOs 180 160 140 120 100 2000 2001 2002 2003 2004 2005 2006 2007 2008 2009 Source: LPS Applied Analytics Kentucky: Changes in Hom e Prices Based on a Repeat Sales Model (Jan 2000=100) 140 135 Excluding REOs 130 Including REOs 125 120 115 110 105 100 2000 2001 2002 2003 2004 2005 2006 2007 2008 2009 Source: LPS Applied Analytics
  • 9. Colorado: Changes in Hom e Prices Based on a Repeat Sales Model (Jan 2000=100) 145 140 Excluding REOs 135 Including REOs 130 125 120 115 110 105 100 2000 2001 2002 2003 2004 2005 2006 2007 2008 2009 Source: LPS Applied Analytics Maryland: Changes in Hom e Prices Based on a Repeat Sales Model (Jan 2000=100) 240 220 Excluding REOs 200 Including REOs 180 160 140 120 100 2000 2001 2002 2003 2004 2005 2006 2007 2008 Source: LPS Applied Analytics 2009 Oklahom a: Changes in Hom e Prices Based on a Repeat Sales Model (Jan 2000=100) 150 145 Excluding REOs 140 135 Including REOs 130 125 120 115 110 105 100 2000 2001 2002 2003 2004 2005 2006 2007 2008 2009 Source: LPS Applied Analytics
  • 10. South Carolina: Changes in Hom e Prices Based on a Repeat Sales Model (Jan 2000=100) 160 150 Excluding REOs Including REOs 140 130 120 110 100 2000 2001 2002 2003 2004 2005 2006 2007 2008 2009 Source: LPS Applied Analytics Iow a: Changes in Hom e Prices Based on a Repeat Sales Model (Jan 2000=100) 135 130 Excluding REOs 125 Including REOs 120 115 110 105 100 2000 2001 2002 2003 2004 2005 2006 2007 2008 2009 Source: LPS Applied Analytics Oregon: Changes in Hom e Prices Based on a Repeat Sales Model (Jan 2000=100) 200 190 Excluding REOs 180 170 Including REOs 160 150 140 130 120 110 100 2000 2001 2002 2003 2004 2005 2006 2007 2008 2009 Source: LPS Applied Analytics
  • 11. Connecticut: Changes in Hom e Prices Based on a Repeat Sales Model (Jan 2000=100) 220 200 Excluding REOs Including REOs 180 160 140 120 100 2000 2001 2002 2003 2004 2005 2006 2007 2008 2009 Source: LPS Applied Analytics Arkansas: Changes in Hom e Prices Based on a Repeat Sales Model (Jan 2000=100) 150 145 Excluding REOs 140 135 Including REOs 130 125 120 115 110 105 100 2000 2001 2002 2003 2004 2005 2006 2007 2008 2009 Source: LPS Applied Analytics
  • 12. Nebraska: Changes in Hom e Prices Based on a Repeat Sales Model (Jan 2000=100) 135 130 Excluding REOs 125 Including REOs 120 115 110 105 100 2000 2001 2002 2003 2004 2005 2006 2007 2008 2009 Source: LPS Applied Analytics Nevada: Changes in Hom e Prices Based on a Repeat Sales Model (Jan 2000=100) 240 220 Excluding REOs 200 Including REOs 180 160 140 120 100 80 2000 2001 2002 2003 2004 2005 2006 2007 2008 2009 Source: LPS Applied Analytics New Ham pshire: Changes in Hom e Prices Based on a Repeat Sales Model (Jan 2000=100) 220 200 Excluding REOs Including REOs 180 160 140 120 100 2000 2001 2002 2003 2004 2005 2006 2007 2008 2009 Source: LPS Applied Analytics
  • 13. Rhode Island: Changes in Hom e Prices Based on a Repeat Sales Model (Jan 2000=100) 260 240 Excluding REOs 220 Including REOs 200 180 160 140 120 100 2000 2001 2002 2003 2004 2005 2006 2007 2008 2009 Source: LPS Applied Analytics Haw aii: Changes in Hom e Prices Based on a Repeat Sales Model (Jan 2000=100) 300 280 Excluding REOs 260 240 Including REOs 220 200 180 160 140 120 100 2000 2001 2002 2003 2004 2005 2006 2007 2008 2009 Source: LPS Applied Analytics
  • 14. Delaw are: Changes in Hom e Prices Based on a Repeat Sales Model (Jan 2000=100) 200 190 Excluding REOs 180 170 Including REOs 160 150 140 130 120 110 100 2000 2001 2002 2003 2004 2005 2006 2007 2008 Source: LPS Applied Analytics District of Colum bia: Changes in Hom e Prices Based on a Repeat Sales Model (Jan 2000=100) 350 Excluding REOs 300 Including REOs 250 200 150 100 2000 2001 2002 2003 2004 2005 2006 2007 2008 2009 Source: LPS Applied Analytics Note: In some states, the data represents market activity in major metropolitan areas only.