1. ABSTRACT
Demonstrations are used worldwide as a way of responding to
grievances.This method of responding to grievances is actually a
growing phenomena especially among students.At the University of
Zambia,Great East Road Campus,Students demonstrations cannot be
overemphasized.They usually occur occur whenever the students
have a grievance to air to Management.This research,and thereof,
this research report focused on demonstrations as the best way of
expressing grievances by the University of Zambia students.
O b j e c t i v e : T h e a i m o f t h i s s t u d y w a s t o i d e n t i f y a n d a n a l ys e f a c t o r s
that lead to the use of demonstrations as the best way of expressing
grievances by UNZA students.The study was also aimed at providing
information that would help stakeholders to curb demonstrations at
UNZA.
Study methodology:In this research,the respondents were UNZA
students who reside on campus and are full time students.The sample
selected comprised 150 students of which 105 were male and 45
females.The sampling criteria used was simple random sampling
using Statistical Package for Social Sciences (SPSS) to ensure that
each student had an equal chance of being included in the
sample.The data was collected by way of self administered
questionnaires.which consisted of closed ended questions.
S t u d y f i n d i n g s : Q u a n t i t a t i v e a n a l ys e s o f d a t a w e r e d o n e u s i n g S P S S
and this was used to generate cross tabulations,frequencies and Chi-
Square statistical tests of association.The study findings showed
that 60.7% of the respondents had participated in students’
demonstrations compared to 38.7% of the respondents who had not
participated in demonstrations.It was further found that there was
no significant relationship between sex and participation in
d e m o n s t r a t i o n s . A d d i t i o n a l l y, t h e r e w a s n o s i g n i f i c a n t r e l a t i o n s h i p
between academic pressure and participation in
demonstrations.However,research showed that there was a strong
relationship between area of residence and participation in students’
demonstrations.Alcohol consumption and participation in
demonstrations were found to have a significant relationship.
Finally,findings were discussed,and a conclusion was drawn on the
Comparison of the actual findings in relation to the earlier
expectations and thereof,recommendations made.
1
2. 1.0 INTRODUCTION
Worldwide, the use of demonstrations as a way of expressing
grievances is a growing phenomenon. Zambia is not an exception to
the above assertion. The expressing of grievances by University of
Zambia students through the use of demonstrations cannot be
overemphasized. This has almost become the order of the day
whenever there is a misunderstanding between administration and
students. To this effect, academic life at UNZA is never such a
s m o o t h , o r d e r l y , d a y- t o - d a y r o u t i n e .
I n s p i t e o f t h e p r e s e n c e o f a l o t o f r e g u l a r i t i e s , t h e r e a r e a l w a ys
stresses, conflicts, unfulfilled aspirations and unexpected
disruptions. These may warrant the expressing of inner feelings
which are precipitated by a number of reasons and factors following
a d i s a g r e e m e n t o n s o m e i s s u e s i n t h e U n i v e r s i t y. T h i s i s m a i n l y
between administration and students. Hence the latter finding solace
in demonstrating as a way of venting their grievances. Factors that
cause demonstration among UNZA students range from political,
economic, administrative to academic pressure. The demonstrations
can either be destructive or non-destructive.
2
3. Therefore, apart from being an academic requirement in Research
Methods in Social Sciences (SS 241/242), this report is meant to
conclude a second year research project at UNZA during the 2007/8
academic year. In particular, it attempts to identify and analyse the
factors that lead to the use of demonstrations as the best way of
e x p r e s s i n g g r i e v a n c e s b y U N Z A s t u d e n t s . U l t i m a t e l y, i t i s h o p e d
that the information obtained will help stakeholders curb
demonstrations among UNZA students
.
2.0 STATEMENT OF THE PROBLEM
The use of dialogue and consultation as a way of expressing
grievances take a central position in solving unrest in institutions.
In institutions, dialogue helps administrators and students address
various problems affecting the smooth operations of the institution,
which ensures that problems are dealt with amicably. Despite the
use of such procedures in resolving grievances, aggrieved parties
sometimes opt to use demonstrations as a way of expressing their
grievances. Demonstrations sometimes result in breach of peace. In
more extreme cases, they result in confrontations with the police,
l e a d i n g t o i n j u r i e s , a r r e s t s a n d d e s t r u c t i o n o f p r o p e r t y.
It is on the basis of such a background that the University of Zambia
students are expected to exhibit a high degree of intellect. The
3
4. University of Zambia students are expected to portray a good picture
(image) to members of the public that they are intellectuals by
promoting the use of dialogue and consultative meetings with
A d m i n i s t r a t i o n t h r o u g h t h e i r r e p r e s e n t a t i v e b o d y, t h e U n i v e r s i t y o f
Zambia Students’ Union (UNZASU). Despite the existence of such a
respresentive body (UNZASU), the students often resort to the use
of demonstrations as the best way of expressing their grievances.
CONTEXT OF THE PROBLEM
The use of demonstrations by students has become a regular
occurrence at the University of Zambia, Great East Road Campus.
These demonstrations normally change from peaceful non-violent
form to open confrontations with the police, leading to injuries,
arrests and destruction of property both within and outside the
U n i v e r s i t y. T h e i n v o l v e m e n t o f t h e p o l i c e f u r t h e r l e a d s t o t h e
closure of the Great East Road that is situated next to the University
o f Z a m b i a , t h e r e b y, g r e a t l y i n c o n v e n i e n c i n g m o t o r i s t s . M o r e o v e r ,
the use of demonstrations also affects the academic calendar
resulting in compressed semesters, non-completion of syllabi and
premature closures.
FACTORS CONTRIBUTING TO THE PROBLEM
A number of factors contributing to use of demonstrations as the
best way of expressing grievances among UNZA students have been
4
5. identified. These include; academic, political, structural as well as
area of residence.
4.0 EXPECTED OUTCOMES
a. The research is expected to provide information to the
relevant stakeholders (Students, Administration and Government)
that will bring about the smooth running of the University.
b. The use of proper channels in airing grievances is
expected to reduce misunderstandings among the relevant
stakeholders.
c. The reduction in the rampancy of these demonstrations.
5.0 RESEARCH OBJECTIVES
The objectives of this research are twofold; the general and specific.
General Objectives
(a) To identify and analyze factors that lead to the use of
demonstrations as the best way of expressing grievances by
UNZA students.
(b) To provide information that will help stakeholders curb the
demonstrations at UNZA.
5
6. Specific Objectives
(a) To establish the extent to which gender contributes to
demonstrations by UNZA students.
(b) To investigate the influence of academic pressure on
demonstrations.
(c) To determine which area of residence is more prone to
demonstrations.
(d) To investigate the influence of alcohol on demonstrations
(e). To find out if politicians influence students to engage in
demonstrations.
6.0 LITERATURE REVIEW
In order to comprehend our research topic more clearly, literature
review was conducted and references made to various studies related
to the subject. There are a number of studies which have been
conducted on the subject of demonstrations and protests by
university and college students including lecturers.
Adams (1986) studied the participants in the freedom summer of
1964, involving hundreds of Northern College Students. Most of the
participants were whites, who were demonstrating to help in staffing
the Freedom Schools to register black voters. The total number of
participants was 720 students. The findings of the study indicated
6
7. that all the participants were actively involved in the
demonstrations. Adams attributed this active participation of the
students in the demonstrations to their belonging to different
political organizations. He also found that the education level or
status of students influenced them to participate in the
demonstrations. Furthermore, Adams attributed their participation to
prior experience in highly risk and costly activities such as sit-ins
and freedom riots.
In another study conducted by Adegoke and Akinboye (1980) it was
found that adolescent traits, poor welfare services, political and
economic conditions prevalent at a particular point in time cause
students’ demonstrations. They stressed that the failure by
institutions ’ administrations to provide adequate atmosphere for free
expression of views, deplorable infrastructural facilities as a result
of inadequate funding for maintenance and provision of new ones as
well as communication gap over the ban on student unions are also
causes of students’ demonstrations.
According to Tamuno (1980), there are three factors to
demonstrations; leadership, time and circumstances which explain
differences in the causes and consequences of students’ actorism. He
categorized students into more mature, active as well as passive
7
8. groups. He reasoned that this classification helped in knowing the
students’ leaders and followers.
Altbauch and Leuter (1973) however, identified factors of students’
d e m o n s t r a t i o n s a s t h e d e g e n e r a c y o f t h e e d u c a t i o n a l s ys t e m a n d
infrastructure facilities. They found that students’ demonstrations
can be traced to p s yc h o l o g i c a l traits. As part of their own
contribution towards solving student demonstrations, they suggested
dialogue and consultation as w a ys of expressing views and
grievances. They also suggested no-violent and non-destructive
demonstrations.
Another research which placed much emphasis on the political
factors was conducted by Hanna (1974), who attributed students’
demonstrations to lack of academic freedom, non-participation of
students in institutions ’ administration and the political situation in
Nigeria at the time. He opined that most of the demonstrations were
sparked by unpleasant policies such as the Structure Adjustment
Programmes (SAPs) of 1987, as well as the high handedness of the
administrators. Hanna concluded by stating that academic freedom,
political and economic factors were sources of students’
demonstrations in Asia, Latin America and Africa.
8
9. Still on the political causes of students’ demonstrations, Becande
(1973) stated that African students are more sensitive to political
and economic matters in their countries. He stressed further that
because of their contribution to political development through
agitation and military force, governments had to make certain
political decisions in their respective countries. This view is equally
shared by Adekanbi (1972), who stated that African students have
helped in reshaping the political pattern of their countries.
Explaining further on this, Rock (1973) stated that students had
exercised considerable influence on political decisions. He gave an
example of abrogation of Nigeria-British defence as one of the
political pressures which the Nigerian students exerted on the
n a t i o n ’ s p o l i t i c a l m a c h i n e r y.
D i g r e s s i n g f r o m t h e p o l i t i c a l p l a n e , N w a l a ( 1 9 8 0 ) a n a l yz i n g f r o m a
Marxist perspective, argued that students’ demonstrations in Nigeria
were a product of bastardized political economy which had to do
with the exploitation of the nation’s resources by the bourgeoisie
class at the expense of the people’s welfare. He stressed further that
it was this exploitation that made students, as the nation’s
conscience, rise to challenge the status quo through condemnation,
strikes and demonstrations.
9
10. It is clear from the studies above that a multiplicity of factors
account for demonstrations by university students. Among the
factors which the studies revealed are political, economic,
psychological, infrastructure dilapidation and the administration ’s
inertia to respond to students problems. These factors are in line
with those that have been identified in the statement of the problem
in this proposal.
7.0 THEORETICAL FRAMEWORK
In analyzing the problem of use of demonstrations among UNZA
students, two theories namely; convergence and emergent norm were
adopted.
According to Turner (1972), convergence theory states that people
merely reveal their true selves in a crowd, with the crowd serving
only as an excuse. This theory relies on the assumption that all
members of the human race posses unconscious, primitive tendencies
which are ordinarily held in check by organized society. These
instinctive tendencies include sexual desires, aggressions and
defensive reactions against danger, and remain imbedded in man’s
emotions ready to burn out under threatening circumstances and are
very contagious to others. Frustration is another aspect of
demonstrations because it creates aggression in proportion to the
10
11. extent of the frustration. When such aggression towards a perceived
source of frustration is blocked, aggression is redirected towards
other objects such as stoning of motorists.
In relating this theory to the research question of the “use of
demonstrations as the best way of expressing grievances” the theory
helps provide a probable explanation as to how individuals come
together to exhibit behavior that expresses their inner anxieties and
aggressions unlike resorting to dialogue.
I n t h e s a m e v e i n , t h e e m e r g e n t n o r m t h e o r y c a n a l s o h e l p u s a n a l yz e
the problem of demonstrations among UNZA students. This theory
which was developed by two sociologists, Ralph Turner and Lewis
Killian. It states that a combination of like minded individuals,
anonymity and shared emotions lead to crowd behavior. This theory
t a k e s a s ym b o l i c i n t e r a c t i o n i s t a p p r o a c h t o u n d e r s t a n d i n g c r o w d
behavior. It states that people come together with specific
expectations and norms, but in the interactions that follow, new
expectations and norms emerge, allowing for behavior that normally
would not take place (http://www.en-wiki-books.org/).
8.0 STATEMENT OF THE HYPOTHESES
I n p r e p a r i n g t h i s r e s e a r c h p r o p o s a l , t h e f o l l o w i n g h yp o t h e s e s w e r e
constructed:
11
12. (a) Male students are more likely to demonstrations than
female students.
(b) Students under more academic pressure are more likely to
demonstrate than those under less academic pressure.
(c) Students from the old residence are more likely to demonstrate
than those from the other residences.
(d) The greater the consumption of alcohol by students, the
higher the likelihood of demonstrations. Measurement of
variables
Conceptual and operational definitions
Independent variable Conceptual definition
Operational definition
(i) Does UNZA administration
Administration inertia Delay in resolving delay in resolving students’
grievances?
grievances. (ii) If your answer to question 1 is
yes, to what extent do these
delays contribute to your
participation in students’
demonstrations?
Political instigation Initiation of an act by (i) Do politicians influence
politicians. influence you to demonstrate?
(ii) If your answer to question
1 is yes,to what extent do
politicians influence you to
participate in students’
demonstrations?
The state of being male (i)What is your sex?
or female. 12
13. Sex
Age How old one is. (i) How old were you at your last
birthday?
(i) Do you experience academic
Academic pressure Too much school work pressure at UNZA?
to be done in a limited (ii) If your answer to question 1 is
period of time. yes, to what extent does academic
pressure influence you to
participate in demonstrations?
A r e a o f r e s i d e n c e A place where one lives.
(i)Where do you reside on
campus?
Alcohol abuse The excess intake of (i) Do you consume alcohol?
intoxicating liquor
(ii) If you answer to question
is yes, how many times per
week?
. (iii)Does consumption of
alcohol influence you to
participate in demonstrations?
13
14. Dependent variable Conceptual Definition
Operational definition
(i) Have you ever
Act of expressing participated in students’
Demonstrations
support or demonstrations?
resentment towards
a particular issue in (ii) if your answer to
a group. question 1 is yes,how
often?
RESEARCH DESIGN AND METHODOLOGY
The research was conducted on UNZA Students resident
oncompus.Distance and Part time students were not included because
they fell outside the sample space at the time the research was
conducted. The sample selected was 160 students.However, only 150
were used in the research. The extra 10 were meant to account for
non-response cases
.
SAMPLING
The sampling criteria comprised a sampling frame and table of
random numbers. Tables for random numbers were used to allow
each student have an equal non zero chance of included in sample.
T h e 2 0 0 7 U N Z A ye a r b o o k w a s u s e d f o r t h i s p u r p o s e . T h e y e a r b o o k
has advantage of having no foreign blank elements, being
exhaustive, and allows for easy tracing of respondents through their
Halls of residents
.
SAMPLING DESIGN AND PROCEDURE
The research design used was a non intervention design because the
study was conducted in uncontrolled and natural environment, the
University of Zambia, Great East Road Compus.This involved the
14
15. randomization. The sample comprised of 105 males and 45 females
resident on compus.Thus, simple random sampling method was used.
The justification of using simple random sampling method is that,
this method has ability to show the actual skew ness of the
population, the University population. The population is skewed
such that it had more males than females; this was reflected in the
sample.
METHODOLOGY AND DATA COLLECTION
Data was collected by way of self-administered questionnaires which
consisted of closed ended questions. This was because the
respondents are literate and responded easily to the
questionnares.The respondents also answered the questionnaires
privately which ensured honest responses and removed the shortfalls
of the interviewer effect. The other reasons were that questionnaires
are cheap and easy to administer.
DATA ANALYSIS AND INTERPRETATION
In analyzing the data, the Chi-square test was used to measure the
magnitude or variations between the hypotheses and the actual
observations. Analysis of data was done using Statistical Package
for Sciences (SPSS) and Excel. This is because of their ability to
generate stastistics useful in the hypotheses.
CHAPTER ONE: PRESENTATION OF BACKGROUND CHARACTERISTICS
Table 1.0a
Descriptive Statistics
N Minimum Maximum Mean Std. Deviation
How old were you
150 19 46 24.40 5.017
on your last birthday?
150
15
16. Table 1.0b
How old were you on your last birthday?
Frequency Percent
Valid 19 5 3.3
20 16 10.7
21 17 11.3
22 27 18.0
23 21 14.0
24 15 10.0
25 13 8.7
26 10 6.7
27 4 2.7
28 3 2.0
29 1 .7
30 3 2.0
31 2 1.3
33 3 2.0
34 2 1.3
37 1 .7
38 1 .7
40 2 1.3
41 2 1.3
43 1 .7
46 1 .7
Total 150 100.0
Tables 1.0a and 1.0b show the age distribution of respondents. The minimum age was 19,
the mean age was 24.4, the maximum age was 46. The standard deviation was 5.017. The
mean age of 24.4 meant that each of the student was expected to be 24.4 years. The
standard deviation of 5.017 meant that each of the student was expected to be 5.017 years
below or above that mean age of 24.4.
Table 1.1
16
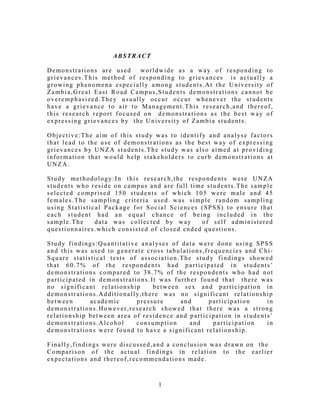
17. What is your sex?
Frequency Percent
Valid male 105 70.0
female 45 30.0
Total 150 100.0
17
22. Figure 1.1 and table 1.1 show the sex distribution of respondents. They indicate that of
the 150 respondents, 105 were male representing 70% while 45 were female representing
30%.
CHAPTER TWO: PRESENTATION OF HYPOTHESES
Table 2.1
Have you ever participated in students' demonstrations at UNZA? * What is your sex?
Cross tabulation
.what is your sex?
male female Total
have you ever participated 0 Count 1 0 1
in students' 1.0% .0% .7%
demonstrations at UNZA? yes Count 66 25 91
62.9% 55.6% 60.7%
no Count 38 20 58
36.2% 44.4% 38.7%
Total Count 105 45 150
100.0% 100.0% 100.0%
Chi-Square Tests
Asymp. Sig.
Value df (2-sided)
Pearson Chi-Square 1.260 2 .532
22
23. Table 2.1 seeks to test the hypothesis that male students are more prone to demonstrate
than female students. The table indicates that of the 105 male respondents, 66
representing 62.9%, said that they participated in student demonstrations, 38 respondents,
representing 36.2% said they did not participate, one respondent did not respond. The
table also indicates that of the 45 female respondents, 25 representing 55.6% said that
they participated in student demonstrations, 20 of them representing 44.4% said they did
not participate in the demonstrations. The table indicates that slightly more male
respondents (62.9%) compared to female respondents (55.6%) said they participated in
student demonstrations. However, the differences are not significant enough to justify the
assumption that male students are more prone to demonstrations. This therefore suggests
that there is no significant relationship between sex and participation in student
demonstrations. Therefore, the hypothesis that male students are more prone to
demonstrations than female students is rejected. The decision to reject the research
hypothesis is supported by the asymptotic significant value of 0.532 which is greater than
the probability value of 0.05 suggesting that we should reject the research hypothesis.
The conclusion is that the sex of a student does not influence his/her participation in
student demonstrations.
Table 2.2
Have you ever participated in students' demonstrations at UNZA? * Residence? Cross tabulation
residence?
old res new res vet Total
have you ever participated 0 Count 1 0 0 1
in students' 1.6% .0% .0% .7%
demonstrations at UNZA? yes Count 48 38 5 91
77.4% 48.7% 50.0% 60.7%
no Count 13 40 5 58
21.0% 51.3% 50.0% 38.7%
Total Count 62 78 10 150
100.0% 100.0% 100.0% 100.0%
Chi-Square Tests
Asymp. Sig.
Value df (2-sided)
Pearson Chi-Square 14.876 4 .005
23
24. It was hypothesized that students from the old residences are more likely to demonstrate
than students in the other halls of residences. Table 2.2 above attempts to present the
relationship between students’ halls of residences and their participation in student
demonstrations. The table shows that of the 150 respondents, 62 were from the old
residences, 78 were from the new residences and 10 were from the Vet hostels. Of the 62
respondents from the Old residences, 48 representing 77.4% said they participated in
student demonstrations, 13 representing 21% said they did not participate in
demonstrations. It also shows that of the 78 respondents from the New residences, 38
respondents, representing 48.7% said they participated in demonstrations and 40 of them,
representing 51.3% said they did not participate. Of the 10 respondents from the Vet
Hostels, 5 representing 50% said they participated while the other 50% said they did not
participate.
From the table, we can see that a higher proportion of respondents from the Old
residences (77.4%) indicated that they participated in demonstrations as compared to only
48.7% and 50% respectively from the New Residences and the Vet Hostels. This
difference is large enough to justify the claim that students from the Old Residences are
more likely to demonstrate than those from the other residences. We therefore accept the
research hypothesis that students from the old residences are more likely to demonstrate
than those from the other residences. The decision to accept the research hypothesis is
supported by the asymptotic significance value of 0.005 which is less than the probability
value (P – Value) of 0.05 indicating that we should accept the research hypothesis.
Table 2.3
24
25. Have you ever participated in students' demonstrations at UNZA? Do you experience academicc
pressure at UNZA? Cross tabulation
Do you experience
academic pressure at
UNZA?
yes no Total
Have you ever participated 0 Count 1 0 1
in students' .7% .0% .7%
demonstrations at UNZA? yes Count 86 5 91
60.6% 62.5% 60.7%
no Count 55 3 58
38.7% 37.5% 38.7%
Total Count 142 8 150
100.0% 100.0% 100.0%
Chi-Square Tests
Asymp. Sig.
Value df (2-sided)
Pearson Chi-Square .064 2 .969
Table 2.4 presents the hypothesis that students who experience academic pressure are
more likely to demonstrate than those who do not experience academic pressure. The
table shows that of the 150 respondents, 142 said they experienced academic pressure
while only 8 students said they did not experience academic pressure. Of the 142
respondents who reported that they experienced academic pressure, 86, representing
60.6% said they had participated in demonstrations while 55, representing 38.7% said
they had not participated in demonstrations. Of the 8 respondents who said they did not
experience academic pressure, 5, representing 62.5% said they had participated in
demonstrations while 3, representing 37.5% said they had not participated.
The table indicates that the majority (142 out of 150) of respondents said they
experienced academic pressure. The table does not show significant differences in levels
of participation in demonstrations between those who said they experienced academic
pressure and those who said they did not experience it. This means that there is not a
significant relationship between academic pressure and participation in demonstrations.
25
26. We therefore reject the research hypothesis that student who experience academic
pressure are more likely to demonstrate than those who do not experience academic
pressure. This decision is in fact supported by the asymptotic significant value of 0.969
which is greater than the probability Value (P – Value) of 0.05 indicating that we should
reject the research hypothesis.
Table 2.4
Have you ever participated in students' demonstrations at UNZA? Do you consume alcohol?
Cross tabulation
Do you consume
alcohol?
yes no Total
Have you ever participated 0 Count 0 1 1
in students' .0% 1.1% .7%
demonstrations at UNZA? yes Count 46 45 91
73.0% 51.7% 60.7%
no Count 17 41 58
27.0% 47.1% 38.7%
Total Count 63 87 150
100.0% 100.0% 100.0%
Chi-Square Tests
Asymp. Sig.
Value df (2-sided)
Pearson Chi-Square 7.289 2 .026
Table 2.4 above was constructed in an attempt to determine if alcohol consumption has
any influence on student participation in demonstrations. The hypothesis being tested
26
27. here was that the greater the consumption of alcohol by a student, the more likely it is
that he/she will participate in demonstrations. The table indicates that of the 150
respondents, 63 said they took alcohol while 87 said they did not. Of the 63 respondents
who said they took alcohol, 46, representing 73% said they had participated in
demonstrations while 17 representing 27% said they had not participated in
demonstrations. Of the 87 respondents who said they did not take alcohol, 45,
representing 51.7% said they had participated in demonstrations while the remaining 41,
representing 47.1% said they had not participated in demonstrations.
By comparison, a greater proportion of respondents who said they took alcohol (73%)
also participated in demonstrations while only 51.7% of those who said they did not take
alcohol indicated that they had participated in demonstrations. The differences in the
percentages are large enough to support the research hypothesis. Therefore, the research
hypothesis is accepted. The decision to accept the research hypothesis is supported by the
asymptotic significance value of 0.026 which is less than the probability value (P –
Value) of 0.05 indicating that we should accept the research hypothesis.
CHAPTER THREE: PRESENTATION OF GENERAL FINDING
Table 3.1
Does UNZA management delay in resolving grievances?
Frequency Percent
Valid 0 5 3.3
yes 130 86.7
no 15 10.0
Total 150 100.0
27
28. Figure3.1
Does UNZA management delay in resolving grievances?
140
120
100
80
Frequency 60
40
20
0
0 yes no
Does UNZA management delay in resolving grievances?
28
29. Table 3.2
To what extent do delays by management
contribute to your participation in demonstrations?
Frequency Percent
Valid 0 22 14.7
to a larger extent 36 24.0
to a large extent 51 34.0
to a less extent 26 17.3
to a lesser extent 15 10.0
Total 150 100.0
Figure 3.2
29
30. To what extent do delays by management in resolving grievances
contribute to your participation in demonstrations?
60
50
40
30
Frequency
20
10
0
0 to a larger to a large extent to a less extent to a lesser
extent extent
Table 3.1 above was constructed to determine if management delays in resolving
students` grievances contribute to student demonstrations. The hypothesis being tested
was, the longer management takes to respond to students` problems, the more likely
students are to demonstrate. The table indicates that of the 150 respondents, 130
representing 86.7% said that management delayed in responding to students` problems,
15 respondents representing 10% said management did not delay in responding to
students problems. 5 respondents representing 3.3% did not respond.
From table 3.2 and figure 3.2, the findings showed of the 150 respondents, 36,
representing 24% said that management delayed in resolving their grievances to a larger
extent, 51 representing 34% said that management delayed in resolving their grievances
30
31. to a large extent. 26 respondents representing 17.3% said that management delayed in
resolving their grievances to a less extent, 15 representing 10% said that management
delayed in resolving their grievances to a lesser extent, 22 representing 14.7% did not
respond.
Table 3.3
Do politicians influence you to demonstrate?
Frequency Percent
Valid yes 23 15.3
no 127 84.7
Total 150 100.0
31
32. Figure 3.3
Do politicians influence you to demonstrate?
140
120
100
80
Frequency
60
40
20
0
yes no
32
33. Table 3.3 and figure 3.3 above were constructed to determine if politicians influence
students to demonstrate. The hypothesis being tested was that the higher the influence of
politicians on students, the more likely the students are to demonstrate. From table 3.3
and figure 3.3, the findings showed that of the 150 respondents, 23 representing 15.3%
said that politicians influenced students to demonstrate, while 127 respondents
representing 84.7% said that politicians did not influence students to de
CHAPTER FOUR: DISCUSSION OF THE FINDINGS.
Originally, demonstrations were seen as a last alternative in expressing grievances among
University of Zambia students, but currently students view demonstrations as the first and
best way of expressing grievances. Its use is becoming popular as shown in Table 2.1
where 60.7% of the total 150 respondents indicated having participated in students’
demonstrations while 38.7% responded as not having ever participated in students’
demonstrations.
In relation to our findings, trends have shown no change in students’ attitudes towards
demonstrations. Adams (1986) studied the participants in the freedom summer
demonstrations of 1964 whose major participants where Northern College students. The
total number of students who participated in a voluntary questionnaire that he distributed
was 720. All these students were actively involved in demonstrations. He found that
educational level or status of students made them fully participate in the demonstrations.
Studies conducted by Hanna (1974) and Akinboye (1980), revealed that there are various
factors that lead to students demonstrations, among them include; Institutions
managements’ failure to respond to students grievances quickly, national polices, lack of
students participation in the management of the institution and lack of academic freedom.
33
34. In line with this, our research had one of its objectives as finding out which gender (male
or female students), participate more in demonstrations. Our findings as shown in Table
2.1 revealed that of the 105 male respondents, 66 representing 62.9% said they had
participated in students demonstrations. While of the 45 female respondents, 25
representing 55.6% said they participated in student demonstrations. This shows that
more male students participate in students’ demonstrations than female students but the
difference in proportion is not significant enough to justify the claim that more male
students are prone to participate in students’ demonstrations than female students.
Therefore, this hypothesis is rejected.
Another objective of this research was to test the hypothesis as to whether students from
the old residences are more likely to demonstrate than students from other halls of
residence. From the findings indicated in table 2.2, it can be seen that a higher proportion
of residents from the old residence, 48 representing 77.4% of the 150 respondent
participated in student demonstrations as compared to 38 representing 48% of the
respondents from the new residences and 5 representing 50% of respondents from Vet
hostels participated in student demonstrations. This difference is large enough to justify
the claim that students from the old residences are more likely to demonstrate than those
from other residences. We therefore, accept the hypothesis that students from the old
residence are more likely to demonstrate than those from other halls of residences.
Our research found out that management delays in resolving students’ problems is one
factor that contributes to students demonstrations. This is according to the results in
Figure 3.2 that show that out of the 150 respondents, 130 representing 86.7% said
management delay in resolving student grievances contribute to students demonstrations,
15 respondents representing 10% said management does not delay in responding to
student grievances. While 5 respondents representing 3.3% did not respond. It is clear
from figure 3.2 that delays by management in resolving students’ grievances contribute to
a large extent to student demonstrations.
34
35. Another factor that Hanna (1974) and Akiniboye (1980) found to contribute to student
demonstrations was student involvement in the politics of their nations. However, in
relation to our findings, political influence could not be identified as a contributing factor
to students’ demonstrations. This is according to figure 3.3 that showed out of the 150
respondents, 23 representing 15.3% said that politicians influenced students to
demonstrate, while 127 respondents representing 84.7% said that politicians did not
influence students to demonstrate. It is clear according to the results that political
influence does not contribute to students’ demonstrations. This hypothesis is thus
rejected.
Adegoke (1980) identified academic pressure or lack of academic freedom as a
contributing factor to students’ demonstrations. In our research, Table 2.4 shows that of
the 150 respondents, 142 said they experience academic pressure, of which 86
representing 60.6% said they had participated in demonstrations, while 55, representing
38.7% said they had not participated in demonstrations. Of the 8 respondents who said
they did not experience academic pressure, 5, representing 62.5% said they participated
in demonstrations while 3 representing 37.5% said they had not participated. Therefore, it
is clear according to the table that there is no significant difference between those who
said they had experienced academic pressure and those who said they had not
experienced it. Hence, it can be concluded that there is no significant difference between
academic pressure and students’ demonstrations. This rejects the research hypothesis that
stated that students who experience academic pressure are more likely to demonstrate
than those who do not experience academic pressure.
Another objective was to test the hypothesis that the greater the consumption of alcohol
by a student, the more likely it is that the student will participate in students’
demonstrations. From the findings in table 2.5, it can be seen that of the 150 respondents,
87 did not take alcohol while 63 took alcohol. The results further show that of those who
take alcohol, 46, representing 73% participated in demonstrations while 17 representing
27% did not participate in demonstrations. Of the respondents who said they did not take
alcohol 45, representing 51.7% participated in demonstrations while 41, representing
35
36. 47.1% did not participate in demonstrations. It is clear from these findings that the
majority of those who take alcohol participate in students’ demonstrations. This is
because the differences in percentages between those who take alcohol and participate in
demonstrations from those who participate in demonstrations but do not take alcohol are
statistically significant. Therefore, this hypothesis is correct.
Originally, demonstrations were seen as a last alternative in expressing grievances among
University of Zambia students, but currently students view demonstrations as the first and
best way of expressing grievances. Its use is becoming popular as shown in Table 2.1
where 60.7% of the total 150 respondents indicated having participated in students’
demonstrations while 38.7% responded as not having ever participated in students’
demonstrations.
In relation to our findings, trends have shown no change in students’ attitudes towards
demonstrations. Adams (1986) studied the participants in the freedom summer
demonstrations of 1964 whose major participants where Northern College students. The
total number of students who participated in a voluntary questionnaire that he distributed
was 720. All these students were actively involved in demonstrations. He found that
educational level or status of students made them fully participate in the demonstrations.
Studies conducted by Hanna (1974) and Akinboye (1980), revealed that there are various
factors that lead to students demonstrations, among them include; Institutions
managements’ failure to respond to students grievances quickly, national polices, lack of
students participation in the management of the institution and lack of academic freedom.
In line with this, our research had one of its objectives as finding out which gender (male
or female students), participate more in demonstrations. Our findings as shown in Table
2.1 revealed that of the 105 male respondents, 66 representing 62.9% said they had
participated in students demonstrations. While of the 45 female respondents, 25
representing 55.6% said they participated in student demonstrations. This shows that
more male students participate in students’ demonstrations than female students but the
36
37. difference in proportion is not significant enough to justify the claim that more male
students are prone to participate in students’ demonstrations than female students.
Therefore, this hypothesis is rejected.
Another objective of this research was to test the hypothesis as to whether students from
the old residences are more likely to demonstrate than students from other halls of
residence. From the findings indicated in table 2.2, it can be seen that a higher proportion
of residents from the old residence, 48 representing 77.4% of the 150 respondent
participated in student demonstrations as compared to 38 representing 48% of the
respondents from the new residences and 5 representing 50% of respondents from Vet
hostels participated in student demonstrations. This difference is large enough to justify
the claim that students from the old residences are more likely to demonstrate than those
from other residences. We therefore, accept the hypothesis that students from the old
residence are more likely to demonstrate than those from other halls of residences.
Our research found out that management delays in resolving students’ problems is one
factor that contributes to students demonstrations. This is according to the results in
Figure 3.2 that show that out of the 150 respondents, 130 representing 86.7% said
management delay in resolving student grievances contribute to students demonstrations,
15 respondents representing 10% said management does not delay in responding to
student grievances. While 5 respondents representing 3.3% did not respond. It is clear
from figure 3.2 that delays by management in resolving students’ grievances contribute to
a large extent to student demonstrations.
Another factor that Hanna (1974) and Akiniboye (1980) found to contribute to student
demonstrations was student involvement in the politics of their nations. However, in
relation to our findings, political influence could not be identified as a contributing factor
to students’ demonstrations. This is according to figure 3.3 that showed out of the 150
respondents, 23 representing 15.3% said that politicians influenced students to
demonstrate, while 127 respondents representing 84.7% said that politicians did not
influence students to demonstrate. It is clear according to the results that political
37
38. influence does not contribute to students’ demonstrations. This hypothesis is thus
rejected.
Adegoke (1980) identified academic pressure or lack of academic freedom as a
contributing factor to students’ demonstrations. In our research, Table 2.4 shows that of
the 150 respondents, 142 said they experience academic pressure, of which 86
representing 60.6% said they had participated in demonstrations, while 55, representing
38.7% said they had not participated in demonstrations. Of the 8 respondents who said
they did not experience academic pressure, 5, representing 62.5% said they participated
in demonstrations while 3 representing 37.5% said they had not participated. Therefore, it
is clear according to the table that there is no significant difference between those who
said they had experienced academic pressure and those who said they had not
experienced it. Hence, it can be concluded that there is no significant difference between
academic pressure and students’ demonstrations. This rejects the research hypothesis that
stated that students who experience academic pressure are more likely to demonstrate
than those who do not experience academic pressure.
Another objective was to test the hypothesis that the greater the consumption of alcohol
by a student, the more likely it is that the student will participate in students’
demonstrations. From the findings in table 2.5, it can be seen that of the 150 respondents,
did not take alcohol while 63 took alcohol. The results further show that of those who
take alcohol, 46, representing 73% participated in demonstrations while 17 representing
27% did not participate in demonstrations. Of the respondents who said they did not take
alcohol 45, representing 51.7% participated in demonstrations while 41, representing
47.1% did not participate in demonstrations. It is clear from these findings that the
majority of those who take alcohol participate in students’ demonstrations. This is
because the differences in percentages between those who take alcohol and participate in
38
39. demonstrations from those who participate in demonstrations but do not take alcohol are
statistically significant. Therefore, this hypothesis is correct.
11.0 LIMITATIONS
• A few respondents were not cooperative when answering
questions,hence,making data analysis difficulty especially in
cases were respondents decided not to answer.
• Difficulties in accessing computers,especially those installed
w i t h S P S S f o r d a t a e n t r y a n d a n a l ys i s w e r e e x p e r i e n c e d .
• Re-administering of questionnaires had to be undertaken due
to some respondents not being available and others had
exchanged rooms.
• There was limited time in which to conduct the research
carefully and also to effectively master the Statistical Package
for Social Sciences (SPSS).
CONCLUSION
C o n s i d e r i n g t h e f i n d i n g s o f t h e s t u d y, i t i s e v i d e n t t h a t f a c t o r s s u c h
as management’s delay in resolving students grievances as well as
alcohol consumption among students contributes to the use of
demonstrations as a way of expressing grievances by the UNZA
students.However,the findings showed that there is no relationship
39
40. between sex,academic pressure and political influence.This is
contrary to the assertion that politicians,academic pressure and sex
influence one’s participation in demonstrations.Nevertheless,there is
need for further research in this area in order to draw conclusions
with certainty.
RECOMMENDATIONS
Based on research findings, it is recommended that:
(a).Associations should be set up in universities and colleges to
sensitize students on the need not to consume alcohol.
(b).Universities and colleges should be situated in areas far away
from the main roads.
(c).Managements of universities and colleges should be quick in
responding to students’ grievances.
40