SlideShare ist ein Scribd-Unternehmen logo
1 von 31
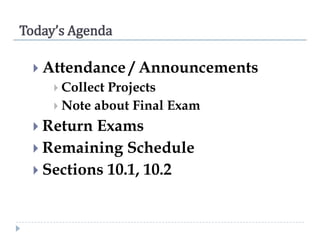
Today’s Agenda
 Attendance

/ Announcements

 Collect

Projects
 Note about Final Exam
 Return

Exams
 Remaining Schedule
 Sections 10.1, 10.2
Exam Schedule
 Exam

5 (Ch 10)
Thur 12/5
 Final Exam (All)
Thur 12/12
Intro to Statistics
Statistics is the science that deals with the
collection and summarization of data.
Methods of stat analysis allow us to make
conclusions about a population based on
sampling.
Statistics is more a field of
Communications, than one of
Mathematics!
Intro to Statistics
1.
2.
3.
4.
5.

Organize Data
Display Data
Identify the “averages” of the data
Identify the “spread” of the data
Make conclusions
Obtaining Data
• Want to represent a Population
• Collect data from a Sample
–Should be a Random Sample to be
a fair representation of the
population
Tuition for a random sample of 30
private, 4-year colleges
(thousands)
23
15
21
39
24

22
26
36
17
27

38
23
36
27
22

25
24
28
24
24

11
37
18
10
28

16
18
9
32
39
23
15
21
39
24

22
26
36
17
27

38
23
36
27
22

25
24
28
24
24

11
37
18
10
28

16
18
9
32
39

There are 30 Data Items, so n = 30
Where each can be called x i
So, x4 25
“21”, “37”, etc. are Data Values
Organizing Data
• Frequency Distribution Table
– Organize data into Classes
• Usually between 5 - 15

– Each class must have the same Class Width

Class width* =

Max data value – Min data value
Number of classes

*Round up to nearest integer
Organizing Data
Let’s make a Freq. Dist. Table with 7 classes to organize
the tuition data…Need Class Width!
39 9
CW *
7

So, each class will have a class width of 5!

4.28
Organizing Data
Make
this
column
first!

Note: Class width is not (9 – 5)!!!
It is the distance between the lower
limit of each class.
Displaying Data
1. An account ing firm select ed 24 complex t ax ret urns prepared by a cert a in t ax preparer. T he number of
errors per ret urn were as follows. Group t he dat a int o 5 classes, and make a frequency t able and
hist ogram/ polygon t o represent t he dat a.
Your Class Widt h =

8

12

0

6

10

8

0

14

8

12

14

16

4

14

7

11

9

12

7

15

11

21

22

19
Displaying Data
• Frequency Histogram (bar graph)
– Each class is its own “bar”
• No spaces between classes (bars)

– Must label each axis (classes vs.
frequency)
– Use straightedge to make lines
Tuition

35-39

30-34

25-29

20-24

15-19

10-14

5-9

frequency
9

8
7

6

5

4
3

2
1
Displaying Data
• Frequency Polygon (line graph)
– Connects the midpoints of the top of each
class.
– Then connect to ground on each side
– Use straightedge to make lines
Tuition

35-39

30-34

25-29

20-24

15-19

10-14

5-9

frequency
9

8
7

6

5

4
3

2

1
Characterizing Data
Displaying Data
1. An account ing firm select ed 24 complex t ax ret urns prepared by a cert a in t ax preparer. T he number of
errors per ret urn were as follows. Group t he dat a int o 5 classes, and make a frequency t able and
hist ogram/ polygon t o represent t he dat a.
Your Class Widt h =

8

12

0

6

10

8

0

14

8

12

14

16

4

14

7

11

9

12

7

15

11

21

22

19
10.2 Measures of Central Tendency
• Ways to describe “on average…”
– Mean
• What is commonly thought of as
“average”
– Median
• The “middle” of the data
– Mode
• The data value that occurs most often
We need some data…
• Number of hits during spring training for 15
Phillies players: (alphabetical order)

21 19 10 1 6
28 32 11 2 15
2 17 21 29 21
Sample Mean
• The mean of a sample set of data
The sum of all
data values

“x bar” is the
sample mean.
Round to
nearest
hundredth. (2
decimal places)

x

x
n
The number of
data items
• Number of hits for 15 Phillies players:

21 19 10 1 6
28 32 11 2 15
2 17 21 29 21
x

x
n

21 19
15

21

15 .67
Median
• The “middle” of an ordered data set
– Arrange data in order
– Find middle value

position

n 1
2

• If n is odd, simply select middle value as the
median.
• If n is even, the median value will be the
mean of the two central values (since a
“middle” does not exist)
Median
Find the median for each data set.
Age (years) in the intensive care unit at a local hospital.
68, 64, 3, 68, 70, 72, 72, 68

Starting teaching salaries (U.S. dollars).
$38,400, $39,720, $28,458, $29,679, $33,679
Median
• When is median a better indicator of
“average” than the mean?
Mode
• The data value that appears most often
– Single Mode
• One data value appears more than any other

– No Mode
• No data values repeat

– Multi-Mode
• There is a “tie” for the value that appears the most
Mode
• Mode of Phillies data?

• 2, 3, 3, 3, 5, 6, 6, 6, 7, 7, 10
• 18, 34, 61, 62, 85
• 9.5, 9.2, 9, 9, 9.1, 8.9
Classwork / Homework

• Page 604
• 1, 7, 21 – 25

• Page 614
• 1 – 19 odd, 29

Weitere ähnliche Inhalte

Was ist angesagt?

Significant test using student T test
Significant test using student T testSignificant test using student T test
Significant test using student T testLawrence kok
 
Significant test using One Way Anova
Significant test using One Way AnovaSignificant test using One Way Anova
Significant test using One Way AnovaLawrence kok
 
An Introduction to Statistics
An Introduction to StatisticsAn Introduction to Statistics
An Introduction to StatisticsNazrul Islam
 
Day2 session i&ii - spss
Day2 session i&ii - spssDay2 session i&ii - spss
Day2 session i&ii - spssabir hossain
 
Statistics Math project class 10th
Statistics Math project class 10thStatistics Math project class 10th
Statistics Math project class 10thRiya Singh
 
Source of DATA
Source of DATASource of DATA
Source of DATANahid Amin
 
Aed1222 lesson 5
Aed1222 lesson 5Aed1222 lesson 5
Aed1222 lesson 5nurun2010
 
NOTE STATISTIC BA301
NOTE STATISTIC BA301NOTE STATISTIC BA301
NOTE STATISTIC BA301faijmsk
 
Statistics Based On Ncert X Class
Statistics Based On Ncert X ClassStatistics Based On Ncert X Class
Statistics Based On Ncert X ClassRanveer Kumar
 
Graphs, charts, and tables ppt @ bec doms
Graphs, charts, and tables ppt @ bec domsGraphs, charts, and tables ppt @ bec doms
Graphs, charts, and tables ppt @ bec domsBabasab Patil
 
Measure of central tendency
Measure of central tendencyMeasure of central tendency
Measure of central tendencyHajrahMughal
 
Utilization of Data: Introduction to Statistics
Utilization of Data: Introduction to StatisticsUtilization of Data: Introduction to Statistics
Utilization of Data: Introduction to StatisticsChristine Mejino
 
Assessment of Learning 1: Chapter 5 - Utilization of Assessment Data
Assessment of Learning 1: Chapter 5 - Utilization of Assessment DataAssessment of Learning 1: Chapter 5 - Utilization of Assessment Data
Assessment of Learning 1: Chapter 5 - Utilization of Assessment DataDonna Domulot
 

Was ist angesagt? (20)

Significant test using student T test
Significant test using student T testSignificant test using student T test
Significant test using student T test
 
Significant test using One Way Anova
Significant test using One Way AnovaSignificant test using One Way Anova
Significant test using One Way Anova
 
An Introduction to Statistics
An Introduction to StatisticsAn Introduction to Statistics
An Introduction to Statistics
 
Measure of Central Tendancy
Measure of Central TendancyMeasure of Central Tendancy
Measure of Central Tendancy
 
Day2 session i&ii - spss
Day2 session i&ii - spssDay2 session i&ii - spss
Day2 session i&ii - spss
 
Statistics Math project class 10th
Statistics Math project class 10thStatistics Math project class 10th
Statistics Math project class 10th
 
Source of DATA
Source of DATASource of DATA
Source of DATA
 
Aed1222 lesson 5
Aed1222 lesson 5Aed1222 lesson 5
Aed1222 lesson 5
 
NOTE STATISTIC BA301
NOTE STATISTIC BA301NOTE STATISTIC BA301
NOTE STATISTIC BA301
 
Statistics Based On Ncert X Class
Statistics Based On Ncert X ClassStatistics Based On Ncert X Class
Statistics Based On Ncert X Class
 
Graphs, charts, and tables ppt @ bec doms
Graphs, charts, and tables ppt @ bec domsGraphs, charts, and tables ppt @ bec doms
Graphs, charts, and tables ppt @ bec doms
 
Measure of central tendency
Measure of central tendencyMeasure of central tendency
Measure of central tendency
 
Mean and median
Mean and medianMean and median
Mean and median
 
Utilization of Data: Introduction to Statistics
Utilization of Data: Introduction to StatisticsUtilization of Data: Introduction to Statistics
Utilization of Data: Introduction to Statistics
 
Assessment of Learning 1: Chapter 5 - Utilization of Assessment Data
Assessment of Learning 1: Chapter 5 - Utilization of Assessment DataAssessment of Learning 1: Chapter 5 - Utilization of Assessment Data
Assessment of Learning 1: Chapter 5 - Utilization of Assessment Data
 
Methods of data presention
Methods of data presentionMethods of data presention
Methods of data presention
 
Medidas de tendencia central
Medidas de tendencia centralMedidas de tendencia central
Medidas de tendencia central
 
Psychological Statistics Chapter 2
Psychological Statistics Chapter 2Psychological Statistics Chapter 2
Psychological Statistics Chapter 2
 
Tabular and Graphical Representation of Data
Tabular and Graphical Representation of Data Tabular and Graphical Representation of Data
Tabular and Graphical Representation of Data
 
Data Handling
Data HandlingData Handling
Data Handling
 

Andere mochten auch (12)

Content schedule bt
Content schedule btContent schedule bt
Content schedule bt
 
Lecture 4.1 bt
Lecture 4.1 btLecture 4.1 bt
Lecture 4.1 bt
 
Geo 6.4 6.5
Geo 6.4 6.5Geo 6.4 6.5
Geo 6.4 6.5
 
Lecture 7.1 bt
Lecture 7.1 btLecture 7.1 bt
Lecture 7.1 bt
 
Carpentry
CarpentryCarpentry
Carpentry
 
Geo 7.2 b
Geo 7.2 bGeo 7.2 b
Geo 7.2 b
 
Geo 6.1 bt
Geo 6.1 btGeo 6.1 bt
Geo 6.1 bt
 
Lecture 7.3 bt
Lecture 7.3 btLecture 7.3 bt
Lecture 7.3 bt
 
Geo 6.1 bt
Geo 6.1 btGeo 6.1 bt
Geo 6.1 bt
 
Chapter 3.2 bt
Chapter 3.2 btChapter 3.2 bt
Chapter 3.2 bt
 
Chapter 2.5, 3.1 bt
Chapter 2.5, 3.1 btChapter 2.5, 3.1 bt
Chapter 2.5, 3.1 bt
 
Chapter 2 bt
Chapter 2 btChapter 2 bt
Chapter 2 bt
 

Ähnlich wie Lecture 10.1 10.2 bt

First term notes 2020 econs ss2 1
First term notes 2020 econs ss2 1First term notes 2020 econs ss2 1
First term notes 2020 econs ss2 1OmotaraAkinsowon
 
MEASURES OF CENTRAL TENDENCY OF AN UNGROUPED STATISTICAL DATA week 4 math 7.pptx
MEASURES OF CENTRAL TENDENCY OF AN UNGROUPED STATISTICAL DATA week 4 math 7.pptxMEASURES OF CENTRAL TENDENCY OF AN UNGROUPED STATISTICAL DATA week 4 math 7.pptx
MEASURES OF CENTRAL TENDENCY OF AN UNGROUPED STATISTICAL DATA week 4 math 7.pptxJOANNAMAEDAVID
 
Measure of central tendency
Measure of central tendency Measure of central tendency
Measure of central tendency Kannan Iyanar
 
More about data science post.pdf
More about data science post.pdfMore about data science post.pdf
More about data science post.pdfSheetalDandge
 
Lecture 1 Descriptives.pptx
Lecture 1 Descriptives.pptxLecture 1 Descriptives.pptx
Lecture 1 Descriptives.pptxABCraftsman
 
Basic biostatistics dr.eezn
Basic biostatistics dr.eeznBasic biostatistics dr.eezn
Basic biostatistics dr.eeznEhealthMoHS
 
Mean_Median_Mode.ppthhhhhhhhhhhhhhhhhhhhhhhhhhhhhhhhhhhhhhhhhhhhhhhhhhhhhhhhh...
Mean_Median_Mode.ppthhhhhhhhhhhhhhhhhhhhhhhhhhhhhhhhhhhhhhhhhhhhhhhhhhhhhhhhh...Mean_Median_Mode.ppthhhhhhhhhhhhhhhhhhhhhhhhhhhhhhhhhhhhhhhhhhhhhhhhhhhhhhhhh...
Mean_Median_Mode.ppthhhhhhhhhhhhhhhhhhhhhhhhhhhhhhhhhhhhhhhhhhhhhhhhhhhhhhhhh...JuliusRomano3
 
20- Tabular & Graphical Presentation of data(UG2017-18).ppt
20- Tabular & Graphical Presentation of data(UG2017-18).ppt20- Tabular & Graphical Presentation of data(UG2017-18).ppt
20- Tabular & Graphical Presentation of data(UG2017-18).pptRAJESHKUMAR428748
 
2-L2 Presentation of data.pptx
2-L2 Presentation of data.pptx2-L2 Presentation of data.pptx
2-L2 Presentation of data.pptxssuser03ba7c
 
STATISTICS-AND-PROBABLITY-A-REVIEW-FOR-SHS.pdf
STATISTICS-AND-PROBABLITY-A-REVIEW-FOR-SHS.pdfSTATISTICS-AND-PROBABLITY-A-REVIEW-FOR-SHS.pdf
STATISTICS-AND-PROBABLITY-A-REVIEW-FOR-SHS.pdfMariaCatherineErfeLa
 
Descriptive statistics
Descriptive statisticsDescriptive statistics
Descriptive statisticsBurak Mızrak
 
Numerical measures stat ppt @ bec doms
Numerical measures stat ppt @ bec domsNumerical measures stat ppt @ bec doms
Numerical measures stat ppt @ bec domsBabasab Patil
 
Penggambaran Data dengan Grafik
Penggambaran Data dengan GrafikPenggambaran Data dengan Grafik
Penggambaran Data dengan Grafikanom0164
 
descriptive statistics.pptx
descriptive statistics.pptxdescriptive statistics.pptx
descriptive statistics.pptxTeddyteddy53
 

Ähnlich wie Lecture 10.1 10.2 bt (20)

First term notes 2020 econs ss2 1
First term notes 2020 econs ss2 1First term notes 2020 econs ss2 1
First term notes 2020 econs ss2 1
 
MEASURES OF CENTRAL TENDENCY OF AN UNGROUPED STATISTICAL DATA week 4 math 7.pptx
MEASURES OF CENTRAL TENDENCY OF AN UNGROUPED STATISTICAL DATA week 4 math 7.pptxMEASURES OF CENTRAL TENDENCY OF AN UNGROUPED STATISTICAL DATA week 4 math 7.pptx
MEASURES OF CENTRAL TENDENCY OF AN UNGROUPED STATISTICAL DATA week 4 math 7.pptx
 
Measure of central tendency
Measure of central tendency Measure of central tendency
Measure of central tendency
 
Statistics1
Statistics1Statistics1
Statistics1
 
Statistics 3, 4
Statistics 3, 4Statistics 3, 4
Statistics 3, 4
 
Statistics.ppt
Statistics.pptStatistics.ppt
Statistics.ppt
 
More about data science post.pdf
More about data science post.pdfMore about data science post.pdf
More about data science post.pdf
 
Lecture 1 Descriptives.pptx
Lecture 1 Descriptives.pptxLecture 1 Descriptives.pptx
Lecture 1 Descriptives.pptx
 
Basic biostatistics dr.eezn
Basic biostatistics dr.eeznBasic biostatistics dr.eezn
Basic biostatistics dr.eezn
 
Mean_Median_Mode.ppthhhhhhhhhhhhhhhhhhhhhhhhhhhhhhhhhhhhhhhhhhhhhhhhhhhhhhhhh...
Mean_Median_Mode.ppthhhhhhhhhhhhhhhhhhhhhhhhhhhhhhhhhhhhhhhhhhhhhhhhhhhhhhhhh...Mean_Median_Mode.ppthhhhhhhhhhhhhhhhhhhhhhhhhhhhhhhhhhhhhhhhhhhhhhhhhhhhhhhhh...
Mean_Median_Mode.ppthhhhhhhhhhhhhhhhhhhhhhhhhhhhhhhhhhhhhhhhhhhhhhhhhhhhhhhhh...
 
20- Tabular & Graphical Presentation of data(UG2017-18).ppt
20- Tabular & Graphical Presentation of data(UG2017-18).ppt20- Tabular & Graphical Presentation of data(UG2017-18).ppt
20- Tabular & Graphical Presentation of data(UG2017-18).ppt
 
2-L2 Presentation of data.pptx
2-L2 Presentation of data.pptx2-L2 Presentation of data.pptx
2-L2 Presentation of data.pptx
 
STATISTICS-AND-PROBABLITY-A-REVIEW-FOR-SHS.pdf
STATISTICS-AND-PROBABLITY-A-REVIEW-FOR-SHS.pdfSTATISTICS-AND-PROBABLITY-A-REVIEW-FOR-SHS.pdf
STATISTICS-AND-PROBABLITY-A-REVIEW-FOR-SHS.pdf
 
Descriptive statistics
Descriptive statisticsDescriptive statistics
Descriptive statistics
 
SP and R.pptx
SP and R.pptxSP and R.pptx
SP and R.pptx
 
Statistics with R
Statistics with R Statistics with R
Statistics with R
 
Numerical measures stat ppt @ bec doms
Numerical measures stat ppt @ bec domsNumerical measures stat ppt @ bec doms
Numerical measures stat ppt @ bec doms
 
Descriptive
DescriptiveDescriptive
Descriptive
 
Penggambaran Data dengan Grafik
Penggambaran Data dengan GrafikPenggambaran Data dengan Grafik
Penggambaran Data dengan Grafik
 
descriptive statistics.pptx
descriptive statistics.pptxdescriptive statistics.pptx
descriptive statistics.pptx
 

Mehr von btmathematics (20)

Derivative power point
Derivative power pointDerivative power point
Derivative power point
 
3.1 derivative of a function
3.1 derivative of a function3.1 derivative of a function
3.1 derivative of a function
 
Carpentry2
Carpentry2Carpentry2
Carpentry2
 
Carpentry
CarpentryCarpentry
Carpentry
 
I book presentation nfd bt
I book presentation nfd btI book presentation nfd bt
I book presentation nfd bt
 
Lecture 10.4 bt
Lecture 10.4 btLecture 10.4 bt
Lecture 10.4 bt
 
Geo 7.3
Geo 7.3Geo 7.3
Geo 7.3
 
Geo 7.1 7.2
Geo 7.1 7.2Geo 7.1 7.2
Geo 7.1 7.2
 
Lecture 7.1 to 7.2 bt
Lecture 7.1 to 7.2 btLecture 7.1 to 7.2 bt
Lecture 7.1 to 7.2 bt
 
Lecture 6.1 6.2 bt
Lecture 6.1 6.2 btLecture 6.1 6.2 bt
Lecture 6.1 6.2 bt
 
Lecture 4.4 bt
Lecture 4.4 btLecture 4.4 bt
Lecture 4.4 bt
 
Geo 6.2 6.3 bt
Geo 6.2 6.3 btGeo 6.2 6.3 bt
Geo 6.2 6.3 bt
 
Geo 6.2 6.3 bt
Geo 6.2 6.3 btGeo 6.2 6.3 bt
Geo 6.2 6.3 bt
 
Lecture 4.2 bt
Lecture 4.2 btLecture 4.2 bt
Lecture 4.2 bt
 
Lecture 4.1 bt
Lecture 4.1 btLecture 4.1 bt
Lecture 4.1 bt
 
Geo 5.1 bt
Geo 5.1 btGeo 5.1 bt
Geo 5.1 bt
 
Lecture 3.6 bt
Lecture 3.6 btLecture 3.6 bt
Lecture 3.6 bt
 
Chapter 4.3 bt
Chapter 4.3 btChapter 4.3 bt
Chapter 4.3 bt
 
Chapter 4.2 bt
Chapter 4.2 btChapter 4.2 bt
Chapter 4.2 bt
 
Lecture 3.1 to 3.2 bt
Lecture 3.1 to 3.2 btLecture 3.1 to 3.2 bt
Lecture 3.1 to 3.2 bt
 

Kürzlich hochgeladen

Sample pptx for embedding into website for demo
Sample pptx for embedding into website for demoSample pptx for embedding into website for demo
Sample pptx for embedding into website for demoHarshalMandlekar2
 
Transcript: New from BookNet Canada for 2024: Loan Stars - Tech Forum 2024
Transcript: New from BookNet Canada for 2024: Loan Stars - Tech Forum 2024Transcript: New from BookNet Canada for 2024: Loan Stars - Tech Forum 2024
Transcript: New from BookNet Canada for 2024: Loan Stars - Tech Forum 2024BookNet Canada
 
Time Series Foundation Models - current state and future directions
Time Series Foundation Models - current state and future directionsTime Series Foundation Models - current state and future directions
Time Series Foundation Models - current state and future directionsNathaniel Shimoni
 
Generative AI for Technical Writer or Information Developers
Generative AI for Technical Writer or Information DevelopersGenerative AI for Technical Writer or Information Developers
Generative AI for Technical Writer or Information DevelopersRaghuram Pandurangan
 
2024 April Patch Tuesday
2024 April Patch Tuesday2024 April Patch Tuesday
2024 April Patch TuesdayIvanti
 
Merck Moving Beyond Passwords: FIDO Paris Seminar.pptx
Merck Moving Beyond Passwords: FIDO Paris Seminar.pptxMerck Moving Beyond Passwords: FIDO Paris Seminar.pptx
Merck Moving Beyond Passwords: FIDO Paris Seminar.pptxLoriGlavin3
 
Manual 508 Accessibility Compliance Audit
Manual 508 Accessibility Compliance AuditManual 508 Accessibility Compliance Audit
Manual 508 Accessibility Compliance AuditSkynet Technologies
 
TrustArc Webinar - How to Build Consumer Trust Through Data Privacy
TrustArc Webinar - How to Build Consumer Trust Through Data PrivacyTrustArc Webinar - How to Build Consumer Trust Through Data Privacy
TrustArc Webinar - How to Build Consumer Trust Through Data PrivacyTrustArc
 
Potential of AI (Generative AI) in Business: Learnings and Insights
Potential of AI (Generative AI) in Business: Learnings and InsightsPotential of AI (Generative AI) in Business: Learnings and Insights
Potential of AI (Generative AI) in Business: Learnings and InsightsRavi Sanghani
 
TeamStation AI System Report LATAM IT Salaries 2024
TeamStation AI System Report LATAM IT Salaries 2024TeamStation AI System Report LATAM IT Salaries 2024
TeamStation AI System Report LATAM IT Salaries 2024Lonnie McRorey
 
The Fit for Passkeys for Employee and Consumer Sign-ins: FIDO Paris Seminar.pptx
The Fit for Passkeys for Employee and Consumer Sign-ins: FIDO Paris Seminar.pptxThe Fit for Passkeys for Employee and Consumer Sign-ins: FIDO Paris Seminar.pptx
The Fit for Passkeys for Employee and Consumer Sign-ins: FIDO Paris Seminar.pptxLoriGlavin3
 
Why device, WIFI, and ISP insights are crucial to supporting remote Microsoft...
Why device, WIFI, and ISP insights are crucial to supporting remote Microsoft...Why device, WIFI, and ISP insights are crucial to supporting remote Microsoft...
Why device, WIFI, and ISP insights are crucial to supporting remote Microsoft...panagenda
 
A Framework for Development in the AI Age
A Framework for Development in the AI AgeA Framework for Development in the AI Age
A Framework for Development in the AI AgeCprime
 
A Deep Dive on Passkeys: FIDO Paris Seminar.pptx
A Deep Dive on Passkeys: FIDO Paris Seminar.pptxA Deep Dive on Passkeys: FIDO Paris Seminar.pptx
A Deep Dive on Passkeys: FIDO Paris Seminar.pptxLoriGlavin3
 
The State of Passkeys with FIDO Alliance.pptx
The State of Passkeys with FIDO Alliance.pptxThe State of Passkeys with FIDO Alliance.pptx
The State of Passkeys with FIDO Alliance.pptxLoriGlavin3
 
UiPath Community: Communication Mining from Zero to Hero
UiPath Community: Communication Mining from Zero to HeroUiPath Community: Communication Mining from Zero to Hero
UiPath Community: Communication Mining from Zero to HeroUiPathCommunity
 
Passkey Providers and Enabling Portability: FIDO Paris Seminar.pptx
Passkey Providers and Enabling Portability: FIDO Paris Seminar.pptxPasskey Providers and Enabling Portability: FIDO Paris Seminar.pptx
Passkey Providers and Enabling Portability: FIDO Paris Seminar.pptxLoriGlavin3
 
Genislab builds better products and faster go-to-market with Lean project man...
Genislab builds better products and faster go-to-market with Lean project man...Genislab builds better products and faster go-to-market with Lean project man...
Genislab builds better products and faster go-to-market with Lean project man...Farhan Tariq
 
Testing tools and AI - ideas what to try with some tool examples
Testing tools and AI - ideas what to try with some tool examplesTesting tools and AI - ideas what to try with some tool examples
Testing tools and AI - ideas what to try with some tool examplesKari Kakkonen
 
Assure Ecommerce and Retail Operations Uptime with ThousandEyes
Assure Ecommerce and Retail Operations Uptime with ThousandEyesAssure Ecommerce and Retail Operations Uptime with ThousandEyes
Assure Ecommerce and Retail Operations Uptime with ThousandEyesThousandEyes
 

Kürzlich hochgeladen (20)

Sample pptx for embedding into website for demo
Sample pptx for embedding into website for demoSample pptx for embedding into website for demo
Sample pptx for embedding into website for demo
 
Transcript: New from BookNet Canada for 2024: Loan Stars - Tech Forum 2024
Transcript: New from BookNet Canada for 2024: Loan Stars - Tech Forum 2024Transcript: New from BookNet Canada for 2024: Loan Stars - Tech Forum 2024
Transcript: New from BookNet Canada for 2024: Loan Stars - Tech Forum 2024
 
Time Series Foundation Models - current state and future directions
Time Series Foundation Models - current state and future directionsTime Series Foundation Models - current state and future directions
Time Series Foundation Models - current state and future directions
 
Generative AI for Technical Writer or Information Developers
Generative AI for Technical Writer or Information DevelopersGenerative AI for Technical Writer or Information Developers
Generative AI for Technical Writer or Information Developers
 
2024 April Patch Tuesday
2024 April Patch Tuesday2024 April Patch Tuesday
2024 April Patch Tuesday
 
Merck Moving Beyond Passwords: FIDO Paris Seminar.pptx
Merck Moving Beyond Passwords: FIDO Paris Seminar.pptxMerck Moving Beyond Passwords: FIDO Paris Seminar.pptx
Merck Moving Beyond Passwords: FIDO Paris Seminar.pptx
 
Manual 508 Accessibility Compliance Audit
Manual 508 Accessibility Compliance AuditManual 508 Accessibility Compliance Audit
Manual 508 Accessibility Compliance Audit
 
TrustArc Webinar - How to Build Consumer Trust Through Data Privacy
TrustArc Webinar - How to Build Consumer Trust Through Data PrivacyTrustArc Webinar - How to Build Consumer Trust Through Data Privacy
TrustArc Webinar - How to Build Consumer Trust Through Data Privacy
 
Potential of AI (Generative AI) in Business: Learnings and Insights
Potential of AI (Generative AI) in Business: Learnings and InsightsPotential of AI (Generative AI) in Business: Learnings and Insights
Potential of AI (Generative AI) in Business: Learnings and Insights
 
TeamStation AI System Report LATAM IT Salaries 2024
TeamStation AI System Report LATAM IT Salaries 2024TeamStation AI System Report LATAM IT Salaries 2024
TeamStation AI System Report LATAM IT Salaries 2024
 
The Fit for Passkeys for Employee and Consumer Sign-ins: FIDO Paris Seminar.pptx
The Fit for Passkeys for Employee and Consumer Sign-ins: FIDO Paris Seminar.pptxThe Fit for Passkeys for Employee and Consumer Sign-ins: FIDO Paris Seminar.pptx
The Fit for Passkeys for Employee and Consumer Sign-ins: FIDO Paris Seminar.pptx
 
Why device, WIFI, and ISP insights are crucial to supporting remote Microsoft...
Why device, WIFI, and ISP insights are crucial to supporting remote Microsoft...Why device, WIFI, and ISP insights are crucial to supporting remote Microsoft...
Why device, WIFI, and ISP insights are crucial to supporting remote Microsoft...
 
A Framework for Development in the AI Age
A Framework for Development in the AI AgeA Framework for Development in the AI Age
A Framework for Development in the AI Age
 
A Deep Dive on Passkeys: FIDO Paris Seminar.pptx
A Deep Dive on Passkeys: FIDO Paris Seminar.pptxA Deep Dive on Passkeys: FIDO Paris Seminar.pptx
A Deep Dive on Passkeys: FIDO Paris Seminar.pptx
 
The State of Passkeys with FIDO Alliance.pptx
The State of Passkeys with FIDO Alliance.pptxThe State of Passkeys with FIDO Alliance.pptx
The State of Passkeys with FIDO Alliance.pptx
 
UiPath Community: Communication Mining from Zero to Hero
UiPath Community: Communication Mining from Zero to HeroUiPath Community: Communication Mining from Zero to Hero
UiPath Community: Communication Mining from Zero to Hero
 
Passkey Providers and Enabling Portability: FIDO Paris Seminar.pptx
Passkey Providers and Enabling Portability: FIDO Paris Seminar.pptxPasskey Providers and Enabling Portability: FIDO Paris Seminar.pptx
Passkey Providers and Enabling Portability: FIDO Paris Seminar.pptx
 
Genislab builds better products and faster go-to-market with Lean project man...
Genislab builds better products and faster go-to-market with Lean project man...Genislab builds better products and faster go-to-market with Lean project man...
Genislab builds better products and faster go-to-market with Lean project man...
 
Testing tools and AI - ideas what to try with some tool examples
Testing tools and AI - ideas what to try with some tool examplesTesting tools and AI - ideas what to try with some tool examples
Testing tools and AI - ideas what to try with some tool examples
 
Assure Ecommerce and Retail Operations Uptime with ThousandEyes
Assure Ecommerce and Retail Operations Uptime with ThousandEyesAssure Ecommerce and Retail Operations Uptime with ThousandEyes
Assure Ecommerce and Retail Operations Uptime with ThousandEyes
 

Lecture 10.1 10.2 bt

  • 1. Today’s Agenda  Attendance / Announcements  Collect Projects  Note about Final Exam  Return Exams  Remaining Schedule  Sections 10.1, 10.2
  • 2. Exam Schedule  Exam 5 (Ch 10) Thur 12/5  Final Exam (All) Thur 12/12
  • 3. Intro to Statistics Statistics is the science that deals with the collection and summarization of data. Methods of stat analysis allow us to make conclusions about a population based on sampling. Statistics is more a field of Communications, than one of Mathematics!
  • 4. Intro to Statistics 1. 2. 3. 4. 5. Organize Data Display Data Identify the “averages” of the data Identify the “spread” of the data Make conclusions
  • 5.
  • 6.
  • 7.
  • 8.
  • 9. Obtaining Data • Want to represent a Population • Collect data from a Sample –Should be a Random Sample to be a fair representation of the population
  • 10. Tuition for a random sample of 30 private, 4-year colleges (thousands) 23 15 21 39 24 22 26 36 17 27 38 23 36 27 22 25 24 28 24 24 11 37 18 10 28 16 18 9 32 39
  • 11. 23 15 21 39 24 22 26 36 17 27 38 23 36 27 22 25 24 28 24 24 11 37 18 10 28 16 18 9 32 39 There are 30 Data Items, so n = 30 Where each can be called x i So, x4 25 “21”, “37”, etc. are Data Values
  • 12. Organizing Data • Frequency Distribution Table – Organize data into Classes • Usually between 5 - 15 – Each class must have the same Class Width Class width* = Max data value – Min data value Number of classes *Round up to nearest integer
  • 13. Organizing Data Let’s make a Freq. Dist. Table with 7 classes to organize the tuition data…Need Class Width! 39 9 CW * 7 So, each class will have a class width of 5! 4.28
  • 14. Organizing Data Make this column first! Note: Class width is not (9 – 5)!!! It is the distance between the lower limit of each class.
  • 15. Displaying Data 1. An account ing firm select ed 24 complex t ax ret urns prepared by a cert a in t ax preparer. T he number of errors per ret urn were as follows. Group t he dat a int o 5 classes, and make a frequency t able and hist ogram/ polygon t o represent t he dat a. Your Class Widt h = 8 12 0 6 10 8 0 14 8 12 14 16 4 14 7 11 9 12 7 15 11 21 22 19
  • 16. Displaying Data • Frequency Histogram (bar graph) – Each class is its own “bar” • No spaces between classes (bars) – Must label each axis (classes vs. frequency) – Use straightedge to make lines
  • 18. Displaying Data • Frequency Polygon (line graph) – Connects the midpoints of the top of each class. – Then connect to ground on each side – Use straightedge to make lines
  • 21. Displaying Data 1. An account ing firm select ed 24 complex t ax ret urns prepared by a cert a in t ax preparer. T he number of errors per ret urn were as follows. Group t he dat a int o 5 classes, and make a frequency t able and hist ogram/ polygon t o represent t he dat a. Your Class Widt h = 8 12 0 6 10 8 0 14 8 12 14 16 4 14 7 11 9 12 7 15 11 21 22 19
  • 22. 10.2 Measures of Central Tendency • Ways to describe “on average…” – Mean • What is commonly thought of as “average” – Median • The “middle” of the data – Mode • The data value that occurs most often
  • 23. We need some data… • Number of hits during spring training for 15 Phillies players: (alphabetical order) 21 19 10 1 6 28 32 11 2 15 2 17 21 29 21
  • 24. Sample Mean • The mean of a sample set of data The sum of all data values “x bar” is the sample mean. Round to nearest hundredth. (2 decimal places) x x n The number of data items
  • 25. • Number of hits for 15 Phillies players: 21 19 10 1 6 28 32 11 2 15 2 17 21 29 21 x x n 21 19 15 21 15 .67
  • 26. Median • The “middle” of an ordered data set – Arrange data in order – Find middle value position n 1 2 • If n is odd, simply select middle value as the median. • If n is even, the median value will be the mean of the two central values (since a “middle” does not exist)
  • 27. Median Find the median for each data set. Age (years) in the intensive care unit at a local hospital. 68, 64, 3, 68, 70, 72, 72, 68 Starting teaching salaries (U.S. dollars). $38,400, $39,720, $28,458, $29,679, $33,679
  • 28. Median • When is median a better indicator of “average” than the mean?
  • 29. Mode • The data value that appears most often – Single Mode • One data value appears more than any other – No Mode • No data values repeat – Multi-Mode • There is a “tie” for the value that appears the most
  • 30. Mode • Mode of Phillies data? • 2, 3, 3, 3, 5, 6, 6, 6, 7, 7, 10 • 18, 34, 61, 62, 85 • 9.5, 9.2, 9, 9, 9.1, 8.9
  • 31. Classwork / Homework • Page 604 • 1, 7, 21 – 25 • Page 614 • 1 – 19 odd, 29