SlideShare ist ein Scribd-Unternehmen logo
1 von 11
Downloaden Sie, um offline zu lesen
FOR IMMEDIATE RELEASE

            YAHOO! REPORTS SECOND QUARTER 2009 RESULTS
               Company Exceeds Midpoint of Revenue Outlook Range
  Maintains Strong Balance Sheet with over $4 Billion in Cash and Marketable Debt
                                    Securities


SUNNYVALE, Calif., July 21, 2009 – Yahoo! Inc. (NASDAQ: YHOO) today reported
revenues of $1,573 million for the quarter ended June 30, 2009, a decrease of 13
percent from the second quarter of 2008. Excluding the impact of currency rate
fluctuations, revenues for the second quarter of 2009 would have declined 8 percent
from the second quarter of 2008.

Net income per diluted share for the second quarter of 2009 was $0.10, compared to
$0.09 for the second quarter of 2008. Non-GAAP net income per diluted share for the
second quarter of 2009 and 2008 was $0.16.

“I’m pleased with our results this past quarter. We established a clear, simple vision to
be the center of people’s lives online, and we’re backing that vision with important
initiatives to create ‘wow’ experiences for our users,” said Yahoo! chief executive officer
Carol Bartz. “We’re confident that this vision will put us on the right path to growth and
profitability long term. Our new homepage is a perfect example of our efforts to create
innovative products aimed at increasing user engagement while offering the most
compelling advertising proposition in the industry.”

Financial Highlights

        GAAP Results (in millions, except percentages and per share amounts)
                               Q2 2008             Q2 2009             Change
Revenues                       $1,798               $1,573              (13%)
Income from operations          $101                  $76               (25%)
Net income                      $131                 $141                 8%
Net income per diluted
                                $0.09                $0.10               11%
share

       Non-GAAP Results (in millions, except percentages and per share amounts)
                              Q2 2008               Q2 2009             Change
Operating cash flow              $427                $385                (10%)
Non-GAAP net income              $225                $229                 2%
Non-GAAP net income
                                 $0.16               $0.16                 —
per diluted share

“Even in this challenging economic environment, Yahoo! had a solid quarter, reflecting
the strength of our offerings for our users and advertisers,” said Yahoo! chief financial
officer Tim Morse. “Moving forward, our goal is to invest in the long-term health of the
business so that we are positioned to capture the growth opportunities created by the
economic recovery and the ongoing shift to online advertising.”
Revenues

       Total revenues were reduced by the effects of currency rate fluctuations, the sale
       of Kelkoo in late 2008 and lower fees revenues from voice-over IP services and
       subscription music offerings. Excluding the effects of these items, revenues
       would have declined 6 percent.
       Marketing services revenues declined 13 percent and fees revenues declined 8
       percent, compared to the second quarter of 2008.
       Marketing services revenues from Owned and Operated sites were $858 million
       for the second quarter of 2009, a 16 percent decrease compared to $1,016
       million for the same period of 2008. The decrease was driven by a 15 percent
       decline in search advertising revenue and a 14 percent decline in display
       advertising revenue.
       Marketing services revenues from Affiliate sites were $520 million for the second
       quarter of 2009, a 9 percent decrease compared to $571 million for the same
       period of 2008. The decrease was driven primarily by a shift to lower yielding
       inventory.

Cost Initiatives

During the second quarter of 2009, the Company recorded a $65 million net
restructuring charge for real estate facilities exited, changes in sublease income
estimates for previously exited facilities, write-off of property and equipment for exited
facilities, and personnel severance and related costs offset by a reversal of stock-based
compensation expense for forfeited awards. The Company is also continuing to
implement non-headcount cost reductions.

Cash Flow and Cash Balance

       Cash flow from operating activities for the second quarter of 2009 was $342
       million, a 20 percent decrease compared to $426 million for the same period of
       2008.
       Free cash flow for the second quarter of 2009 was $266 million, a 15 percent
       increase compared to $231 million for the same period of 2008.
       Cash, cash equivalents and investments in marketable debt securities were
       $4,197 million at June 30, 2009 compared to $3,522 million at December 31,
       2008, an increase of $675 million.

Business Outlook

GAAP revenue for the third quarter of 2009 is expected to be in the range of $1,450
million to $1,550 million. Non-GAAP operating income before depreciation, amortization,
and stock-based compensation expense for the third quarter of 2009 is expected to be in
the range of $330 million to $370 million. Income from operations for the third quarter of
2009 is expected to be in the range of $55 million to $65 million.
Conference Call

Yahoo! will host a conference call to discuss second quarter 2009 results at 5:00 p.m.
Eastern Time today. A live webcast of the conference call, together with supplemental
financial information, can be accessed through the Company's Investor Relations
website at http://yhoo.client.shareholder.com/results.cfm. In addition, an archive of the
webcast can be accessed through the same link. An audio replay of the call will be
available for one week following the conference call by calling (888) 286-8010 or (617)
801-6888, reservation number: 71179022.

Note Regarding Non-GAAP Financial Measures

This press release and its attachments include the following financial measures defined
as non-GAAP financial measures by the Securities and Exchange Commission (“SEC”):
revenues excluding traffic acquisition costs or TAC; operating income before
depreciation, amortization, and stock-based compensation expense (also referred to as
operating cash flow); free cash flow; and non-GAAP net income and non-GAAP net
income per diluted share. These measures may be different than non-GAAP financial
measures used by other companies. The presentation of this financial information is not
intended to be considered in isolation or as a substitute for the financial information
prepared and presented in accordance with generally accepted accounting principles
(“GAAP”).     Explanations of the Company’s non-GAAP financial measures and
reconciliations of these financial measures to the GAAP financial measures the
Company considers most comparable are included in the accompanying “Note to
Unaudited Condensed Consolidated Statements of Income,” “Reconciliations to
Unaudited Condensed Consolidated Statements of Income,” “Reconciliation of GAAP
Net Income and GAAP Net Income Per Diluted Share to Non-GAAP Net Income and
Non-GAAP Net Income Per Diluted Share” and “Business Outlook.”

About Yahoo!

Yahoo! Inc. (“Yahoo!” or the “Company”) is a leading global consumer brand and one of
the most trafficked Internet destinations worldwide. Yahoo! is where millions of people
go every day to see what is happening with the people and things that matter to them
most. Yahoo! helps marketers reach that audience with its unique and compelling
advertiser proposition. Yahoo! is headquartered in Sunnyvale, California. For more
information, visit http://pressroom.yahoo.com or the Company’s blog, Yodel Anecdotal
(http://yodel.yahoo.com).
“Owned and Operated sites” refers to Yahoo!’s owned and operated online properties
and services.

“Affiliate sites” refers to Yahoo!'s distribution network of third-party entities who have
integrated Yahoo!'s advertising offerings into their websites or their other offerings.

This press release and its attachments contain forward-looking statements that involve
risks and uncertainties concerning Yahoo!'s expected financial performance (including
without limitation the statements and information in the Business Outlook section and the
quotations from management in this press release), as well as Yahoo!'s strategic and
operational plans. Actual results may differ materially from the results predicted and
reported results should not be considered as an indication of future performance. The
potential risks and uncertainties include, among others, the impact of management and
organizational changes; the implementation and results of Yahoo!'s ongoing strategic
and cost initiatives; Yahoo!'s ability to compete with new or existing competitors;
reduction in spending by, or loss of, marketing services customers; the demand by
customers for Yahoo!'s premium services; acceptance by users of new products and
services; risks related to joint ventures and the integration of acquisitions; risks related to
Yahoo!'s international operations; failure to manage growth and diversification; adverse
results in litigation, including intellectual property infringement claims; Yahoo!'s ability to
protect its intellectual property and the value of its brands; dependence on key
personnel; dependence on third parties for technology, services, content, and
distribution; general economic conditions and changes in economic conditions; and the
possibility that third parties may in the future make proposals to acquire all or a part of
Yahoo! or take other actions which may create uncertainty for our employees,
publishers, advertisers, and other business partners. All information set forth in this
press release and its attachments is as of July 21, 2009. Yahoo! does not intend, and
undertakes no duty, to update this information to reflect future events or circumstances.
More information about potential factors that could affect the Company's business and
financial results is included under the captions "Risk Factors" and "Management's
Discussion and Analysis of Financial Condition and Results of Operations" in the
Company's Annual Report on Form 10-K for the year ended December 31, 2008, and
Quarterly Report on Form 10-Q for the quarter ended March 31, 2009, which are on file
with the SEC and available on the SEC's website at www.sec.gov. Additional information
will also be set forth in those sections in Yahoo!’s Quarterly Report on Form 10-Q for the
quarter ended June 30, 2009, which will be filed with the SEC in the third quarter of
2009.

Yahoo! and the Yahoo! logos are trademarks and/or registered trademarks of Yahoo!
Inc. All other names are trademarks and/or registered trademarks of their respective
owners.

Media Relations Contact:

Kim Rubey, Yahoo! Inc., (408) 349-8910, krubey@yahoo-inc.com

Investor Relations Contact:

Cathy La Rocca, Yahoo! Inc., (408) 349-5188, cathy@yahoo-inc.com
Yahoo! Inc.
                                                          Unaudited Condensed Consolidated Statements of Income
                                                                 (in thousands, except per share amounts)


                                                                                                       Three Months Ended                      Six Months Ended
                                                                                                             June 30,                               June 30,
                                                                                                      2008             2009                   2008             2009


      Revenues                                                                                 $     1,798,085     $      1,572,897     $    3,615,687     $      3,152,939

      Cost of revenues                                                                                 765,911             712,453           1,520,994            1,413,190

      Gross profit                                                                                   1,032,174             860,444           2,094,693            1,739,749

      Operating expenses:
          Sales and marketing                                                                          404,899             280,386             829,490              601,498
          Product development                                                                          314,719             291,398             620,325              597,441
          General and administrative                                                                   188,811             138,652             359,891              275,649
          Amortization of intangibles                                                                   23,224                9,253             46,964               18,920
          Restructuring charges, net                                                                          -             65,002              16,885               69,803
          Total operating expenses                                                                     931,653             784,691           1,873,555            1,563,311

      Income from operations                                                                           100,521              75,753             221,138              176,438

      Other income, net                                                                                 24,583              72,010              39,248               76,970

      Income before income taxes and earnings in equity interests                                      125,104             147,763             260,386              253,408

      Provision for income taxes                                                                        (47,656)            (68,879)          (100,955)            (104,763)
      Earnings in equity interests (1)                                                                  54,927              64,156             509,709              113,090

      Net income                                                                                       132,375             143,040             669,140              261,735

          Less: Net income attributable to noncontrolling interests                                      (1,214)             (1,653)             (1,139)             (2,790)

      Net income attributable to Yahoo! Inc.                                                   $       131,161     $       141,387     $       668,001     $        258,945

      Net income attributable to Yahoo! Inc. common stockholders per share - diluted(2)        $           0.09    $           0.10     $          0.46    $           0.18

      Shares used in per share calculation - diluted                                                 1,397,839            1,414,295          1,391,930            1,410,348

      Stock-based compensation expense was allocated as follows:
          Cost of revenues                                                                     $          3,549    $          2,663     $         6,829    $          6,242
          Sales and marketing                                                                           56,306              35,651             121,844               85,548
          Product development                                                                           46,442              51,647              94,524              105,925
          General and administrative                                                                    16,871              22,565              37,260               41,531
          Restructuring expense reversals                                                                     -              (7,600)            (12,284)             (7,600)


      Supplemental Financial Data:
      Revenues excluding TAC                                                                   $     1,345,969     $      1,136,346     $    2,698,027     $      2,292,593
      Operating income before depreciation, amortization, and stock-based compensation
      expense (or operating cash flow)                                                         $       427,046     $       385,444      $      860,179     $        794,422
      Free cash flow (3)                                                                       $       230,999     $       266,034      $      877,511     $        480,029
      Non-GAAP net income per share - diluted                                                  $           0.16    $           0.16     $          0.34    $           0.31


(1) The six months ended June 30, 2008 includes Yahoo!'s net non-cash gain of $401 million recorded in the first quarter of 2008 related to Alibaba Group's initial public
    offering of Alibaba.com, net of tax.
(2) The impact of outstanding stock awards of entities in which the Company holds equity interests that are accounted for using the equity method reduced the Company's

    diluted earnings per share by $0.02 for the six months ended June 30, 2008.
(3) The six months ended June 30, 2008 includes a $350 million one-time payment from AT&T Inc. recorded in the first quarter of 2008.
Yahoo! Inc.
                                  Note to Unaudited Condensed Consolidated Statements of Income
This press release and its attachments include the non-GAAP financial measures of revenues excluding traffic acquisition costs or TAC, operating income
before depreciation, amortization, and stock-based compensation expense (also referred to as operating cash flow), free cash flow, non-GAAP net income,
and non-GAAP net income per diluted share, which are reconciled to GAAP revenue, income from operations, cash flow from operating activities, net
income attributable to Yahoo! Inc., and net income attributable to Yahoo! Inc. common stockholders per diluted share, respectively, which we believe are
the most comparable GAAP measures. We use these non-GAAP financial measures for internal managerial purposes, when publicly providing our
business outlook, and to facilitate period-to-period comparisons. We describe limitations specific to each non-GAAP financial measure below.
Management generally compensates for limitations in the use of non-GAAP financial measures by relying on comparable GAAP financial measures and
providing investors with a reconciliation of the non-GAAP financial measure to the most directly comparable GAAP financial measure or measures.
Further, management uses non-GAAP financial measures only in addition to and in conjunction with results presented in accordance with GAAP. We
believe that these non-GAAP financial measures reflect an additional way of viewing aspects of our operations that, when viewed with our GAAP results,
provide a more complete understanding of factors and trends affecting our business. These non-GAAP measures should be considered as a supplement to,
and not as a substitute for, or superior to, GAAP revenues, income from operations, cash flow from operating activities, net income attributable to Yahoo!
Inc., and net income attributable to Yahoo! Inc. common stockholders per diluted share calculated in accordance with GAAP.

Revenues excluding TAC is defined as GAAP revenues less TAC. TAC consists of payments made to Affiliate sites and payments made to companies
that direct consumer and business traffic to the Yahoo! website. We present revenues excluding TAC: (1) to provide a metric for our investors to analyze
and value our Company and (2) to provide investors one of the primary metrics used by the Company for evaluation and decision-making purposes. We
provide revenues excluding TAC because we believe it is useful to investors in valuing our Company. One of the ways investors value companies is to
apply a multiple to revenues. Since a significant portion of the GAAP revenues associated with our sponsored search offerings is paid to our Affiliate
sites, we believe investors find it more meaningful to apply multiples to revenues excluding TAC to assess our value as this avoids “double counting”
revenues that are paid to, and being reported by, our Affiliate sites. Further, management uses revenues excluding TAC for evaluating the performance of
our business, making operating decisions, budgeting purposes, and as a factor in determining management compensation. A limitation of revenues
excluding TAC is that it is a measure which we have defined for internal and investor purposes that may be unique to the Company, and therefore it may
not enhance the comparability of our results to other companies in our industry who have similar business arrangements but address the impact of TAC
differently. Management compensates for these limitations by also relying on the comparable GAAP financial measures of revenues, cost of revenues,
and gross profit, each of which includes the impact of TAC.

Operating income before depreciation, amortization, and stock-based compensation expense (also referred to as operating cash flow) is defined as
income/(loss) from operations before depreciation, amortization of intangible assets, and stock-based compensation expense. We consider this measure to
be an important indicator of the operational strength of the Company. We exclude depreciation and amortization because while tangible and intangible
assets support our businesses, we do not believe the related depreciation and amortization costs are directly attributable to the operating performance of
our business. This measure is used by some investors when assessing the performance of our Company. In addition, because of the variety of equity
awards used by companies, the varying methodologies for determining stock-based compensation expense, and the subjective assumptions involved in
those determinations, we believe excluding stock-based compensation expense enhances the ability of management and investors to understand the impact
of stock-based compensation expense on our operating income. We do not include depreciation, amortization, and stock-based compensation expense in
our internal measures or in the measures used by the Company to formulate our business outlook presented with our quarterly financial information to
investors. A limitation associated with the non-GAAP measure of operating income before depreciation, amortization, and stock-based compensation
expense is that it does not reflect the periodic costs of certain capitalized tangible and intangible assets used in generating revenues in our businesses.
Management evaluates the costs of such tangible and intangible assets through other financial measures such as capital expenditures. A further limitation
associated with this measure is that it does not include stock-based compensation expense related to the Company’s workforce. Management compensates
for these limitations by also relying on the comparable GAAP financial measure of income from operations, which includes depreciation, amortization,
and stock-based compensation expense.

Free cash flow is a non-GAAP financial measure defined as cash flow from operating activities (adjusted to include excess tax benefits from stock-based
compensation), less net capital expenditures and dividends received. We consider free cash flow to be a liquidity measure which provides useful
information to management and investors about the amount of cash generated by the business after the acquisition of property and equipment, which can
then be used for strategic opportunities including, among others, investing in the Company's business, making strategic acquisitions, strengthening the
balance sheet, and repurchasing stock. A limitation of free cash flow is that it does not represent the total increase or decrease in the cash balance for the
period. Management compensates for this limitation by also relying on the net change in cash and cash equivalents as presented in the Company’s
unaudited condensed consolidated statements of cash flows prepared in accordance with GAAP which incorporates all cash movements during the period.

Non-GAAP net income is defined as net income excluding certain gains, losses, expenses, and their related tax effects that we do not believe are indicative
of our ongoing operating results and further adjusted to exclude stock-based compensation expense. In our calculation of non-GAAP net income and non-
GAAP net income per diluted share, we have excluded stock-based compensation expense and its related tax effects. Because of the variety of equity
awards used by companies, the varying methodologies for determining stock-based compensation expense, and the subjective assumptions involved in
those determinations, we believe excluding stock-based compensation expense enhances the ability of management and investors to understand the impact
of stock-based compensation expense on net income and net income per diluted share. We also consider non-GAAP net income and non-GAAP net
income per diluted share to be profitability measures which facilitate the forecasting of our operating results for future periods and allow for the
comparison of our results to historical periods. A limitation of non-GAAP net income and non-GAAP net income per diluted share is that they do not
include all items that impact our net income and net income per diluted share for the period. Management compensates for this limitation by also relying
on the comparable GAAP financial measures of net income attributable to Yahoo! Inc. and net income attributable to Yahoo! Inc. common stockholders
per diluted share, both of which include the gains, losses, expenses and related tax effects that are excluded from non-GAAP net income and non-GAAP
net income per diluted share.
Yahoo! Inc.
                                       Reconciliations to Unaudited Condensed Consolidated Statements of Income
                                                                     (in thousands)


                                                                                           Three Months Ended                         Six Months Ended
                                                                                                 June 30,                                  June 30,
                                                                                           2008             2009                    2008                 2009
Revenues for groups of similar services:
   Marketing services:
      Owned and Operated sites                                                     $      1,015,688       $     858,160    $       1,981,328       $   1,730,063
      Affiliate sites                                                                       571,268             519,690            1,178,072           1,030,968
   Marketing services                                                                     1,586,956           1,377,850            3,159,400           2,761,031
   Fees                                                                                     211,129             195,047              456,287             391,908
       Total revenues                                                              $      1,798,085       $   1,572,897    $       3,615,687       $   3,152,939

Revenues by segment:
   United States                                                                   $      1,262,191       $   1,152,393    $       2,567,531       $   2,340,323
   International                                                                            535,894             420,504            1,048,156             812,616
   Total revenues                                                                  $      1,798,085       $   1,572,897    $       3,615,687       $   3,152,939

Revenues excluding traffic acquisition costs ("TAC"):
   GAAP revenue                                                                    $        1,798,085     $   1,572,897    $         3,615,687     $   3,152,939
   TAC                                                                                        (452,116)        (436,551)               (917,660)        (860,346)
   Revenues excluding TAC                                                          $        1,345,969     $   1,136,346    $         2,698,027     $   2,292,593

Revenues excluding TAC by segment:
   United States:
   GAAP revenue                                                                    $      1,262,191       $   1,152,393    $       2,567,531       $   2,340,323
   TAC                                                                                     (270,875)           (290,536)            (548,291)           (580,679)
   Revenues excluding TAC                                                          $        991,316       $     861,857    $       2,019,240       $   1,759,644

       International:
       GAAP revenue                                                                $        535,894       $     420,504    $       1,048,156       $      812,616
       TAC                                                                                 (181,241)           (146,015)            (369,369)            (279,667)
       Revenues excluding TAC                                                      $        354,653       $     274,489    $         678,787       $      532,949

Operating income before depreciation, amortization, and stock-based
compensation expense (or operating cash flow):
   Income from operations                                                          $        100,521       $     75,753     $         221,138       $     176,438
   Depreciation and amortization                                                            203,357            204,765               390,868             386,338
   Stock-based compensation expense                                                         123,168            104,926               248,173             231,646
       Operating income before depreciation, amortization, and stock-based
       compensation expense                                                        $        427,046       $    385,444     $         860,179       $     794,422

Operating income before depreciation, amortization, and stock-based
compensation expense (or operating cash flow) by segment:
   Operating income before depreciation, amortization, and stock-based
   compensation expense - United States                                            $        295,537       $    268,205     $         608,630       $     560,937
   Operating income before depreciation, amortization, and stock-based
   compensation expense - International                                                     131,509            117,239               251,549             233,485
   Operating income before depreciation, amortization, and stock-based
   compensation expense                                                            $        427,046       $    385,444     $         860,179       $     794,422

       United States:
       Income/(loss) from operations                                               $         19,380       $     (8,553)    $          66,475       $      12,274
       Depreciation and amortization                                                        168,457            182,810               321,640             342,661
       Stock-based compensation expense                                                     107,700             93,948               220,515             206,002
       Operating income before depreciation, amortization, and stock-based
       compensation expense - United States                                        $        295,537       $    268,205     $         608,630       $     560,937

       International:
       Income from operations                                                      $          81,141      $     84,306     $         154,663       $     164,164
       Depreciation and amortization                                                          34,900            21,955                69,228              43,677
       Stock-based compensation expense                                                       15,468            10,978                27,658              25,644
       Operating income before depreciation, amortization, and stock-based
       compensation expense - International                                        $        131,509       $    117,239     $         251,549       $     233,485

Free cash flow:
    Cash flow from operating activities (3)                                        $        425,838       $    341,794     $       1,212,143       $      604,143
    Acquisition of property and equipment, net                                             (175,897)           (94,674)             (315,690)            (165,155)
    Dividends received                                                                      (18,942)           (26,145)              (18,942)             (26,145)
    Excess tax benefits from stock-based awards                                                   -             45,059                     -               67,186
    Free cash flow (3)                                                             $        230,999       $    266,034     $         877,511       $      480,029


 (3)   The six months ended June 30, 2008 includes a $350 million one-time payment from AT&T Inc. recorded in the first quarter of 2008.
Yahoo! Inc.
               Reconciliation of GAAP Net Income and GAAP Net Income Per Diluted Share to Non-GAAP Net Income and Non-GAAP Net Income Per Diluted Share
                                                                 (in thousands, except per share amounts)

                                                                                                                                              Three Months Ended
                                                                                                                                                    June 30,
                                                                                                                                             2008               2009

GAAP Net income attributable to Yahoo! Inc.                                                                                              $    131,161       $        141,387

(a)         Stock-based compensation expense (4)                                                                                              123,168                112,526

(b)                                                                                                    (5)
            Incremental costs for advisors related to the strategic alternatives and related matters                                            22,300                      -

(c)         Restructuring charges, net                                                                                                                -               65,002

(d)         Gain on sale of Gmarket investment                                                                                                        -               (66,684)

(e)         To adjust the provision for income taxes to exclude the tax impact of items (a) through (d) above for the three months
            ended June 30, 2008 and 2009, respectively                                                                                         (38,385)               (25,646)

(f)         To adjust the provision for income taxes to reflect an adjusted effective tax rate (calculated excluding the full year
            impact of items (a) through (d) above) of 37% and 36% for the three months ended June 30, 2008 and 2009,
            respectively                                                                                                                       (12,989)                 2,720

Non-GAAP Net income                                                                                                                      $    225,255       $        229,305


GAAP Net income attributable to Yahoo! Inc. common stockholders per share - diluted                                                      $        0.09      $            0.10

Non-GAAP Net income per share - diluted                                                                                                  $        0.16      $            0.16


Shares used in non-GAAP per share calculation - diluted                                                                                      1,397,839             1,414,295


                                                                                                                                               Six Months Ended
                                                                                                                                                    June 30,
                                                                                                                                             2008               2009

GAAP Net income attributable to Yahoo! Inc.                                                                                              $    668,001       $        258,945

(a)         Stock-based compensation expense (4)                                                                                              260,457                239,246

(b)                                                                                                    (5)
            Incremental costs for advisors related to the strategic alternatives and related matters                                            36,156                      -

(c)         Restructuring charges, net                                                                                                          16,885                69,803

(d)         Gain on sale of Gmarket investment                                                                                                        -               (66,684)

(e)         To adjust the provision for income taxes to exclude the tax impact of items (a) through (d) above for the six months
            ended June 30, 2008 and 2009, respectively                                                                                         (83,420)               (54,368)

(f)         To adjust the provision for income taxes to reflect an adjusted effective tax rate (calculated excluding the full year
            impact of items (a) through (d) above) of 37% and 33% for the six months ended June 30, 2008 and 2009, respectively
                                                                                                                                               (25,666)                (2,952)

(g)         Yahoo!'s non-cash gain related to Alibaba Group's initial public offering of Alibaba.com, net of tax, which is included in
            earnings in equity interests                                                                                                      (401,090)                     -

Non-GAAP Net income                                                                                                                      $    471,323       $        443,990


GAAP Net income attributable to Yahoo! Inc. common stockholders per share - diluted (2)                                                  $        0.46      $            0.18

Non-GAAP Net income per share - diluted                                                                                                  $        0.34      $            0.31


Shares used in non-GAAP per share calculation - diluted                                                                                      1,391,930             1,410,348


      (2) The impact of outstanding stock awards of entities in which the Company holds equity interests that are accounted for using the equity method reduced the
          Company's diluted earnings per share by $0.02 for the six months ended June 30, 2008.
      (4) The stock-based compensation restructuring expense reversals are included in restructuring charges net, footnote (c), for the three and six months ended

          June 30, 2008 and 2009.
      (5) Includes incremental costs for advisors related to Microsoft's proposals to acquire all or a part of the Company, other strategic alternatives, including the Google

          agreement, the proxy contest, and related litigation defense. These costs were immaterial for the three and six months ended June 30, 2009.
Yahoo! Inc.
                                              Business Outlook


The following business outlook is based on current information and expectations as of July 21, 2009. Yahoo!'s business outlook
as of today is expected to be available on the Company's Investor Relations website throughout the current quarter. Yahoo! does
not expect, and undertakes no obligation, to update the business outlook prior to the release of the Company's next quarterly
earnings announcement, notwithstanding subsequent developments; however, Yahoo! may update the business outlook or any
portion thereof at any time at its discretion.


                                                                                                   Three Months
                                                                                                      Ending
                                                                                                   September 30,
                                                                                                      2009 (6)

Revenues (in millions):                                                                        $     1,450 - 1,550


Operating income before depreciation, amortization, and stock-based
                                                       (7)
     compensation expense (or operating cash flow)           outlook (in millions):
              Income from operations                                                           $        55 - 65
              Depreciation and amortization                                                            160 - 180
              Stock-based compensation expense                                                         115 - 125
              Operating income before depreciation, amortization, and stock-based
              compensation expense (or operating cash flow)                                    $       330 - 370

        (6)   This business outlook for the three months ending September 30, 2009 excludes any restructuring charges
              arising from our ongoing cost initiatives.
        (7)   Refer to Note to Unaudited Condensed Consolidated Statements of Income.
Yahoo! Inc.
                                                            Unaudited Condensed Consolidated Statements of Cash Flows
                                                                                 (in thousands)


                                                                                                    Three Months Ended                       Six Months Ended
                                                                                                          June 30,                                June 30,
                                                                                                  2008              2009                 2008                2009

CASH FLOWS FROM OPERATING ACTIVITIES:
   Net income                                                                               $     132,375      $         143,040     $    669,140     $       261,735
   Adjustments to reconcile net income to net cash provided by
       operating activities:
         Depreciation                                                                             125,913                138,636          243,470             273,502
         Amortization of intangible assets                                                         77,444                 59,104          147,398             105,811
         Stock-based compensation expense, net                                                    123,168                104,926          248,173             231,646
         Non-cash restructuring charges                                                                 -                  7,025                -               6,467
         Tax benefits from stock-based awards                                                      31,133                 19,241           31,133              16,536
         Excess tax benefits from stock-based awards                                                    -                (45,059)               -             (67,186)
         Deferred income taxes                                                                      7,891                 18,915           37,527              24,741
         Earnings in equity interests                                                             (54,927)               (64,156)        (509,709)           (113,090)
         Dividends received from equity investee                                                   18,942                 26,145           18,942              26,145
         (Gain)/loss from sale of investments, assets, and other, net                                (512)               (69,102)           5,365             (72,243)
         Changes in assets and liabilities, net of effects of acquisitions:
           Accounts receivable, net                                                                (3,544)                26,727            23,636            163,262
           Prepaid expenses and other                                                               2,660                  2,351            (5,647)             4,618
           Accounts payable                                                                         4,891                (39,932)          (39,452)           (69,621)
           Accrued expenses and other liabilities                                                   8,381                 31,102            54,616           (139,378)
           Deferred revenue                                                                       (47,977)               (17,169)          287,551            (48,802)
   Net cash provided by operating activities                                                      425,838                341,794         1,212,143            604,143

CASH FLOWS FROM INVESTING ACTIVITIES:
   Acquisition of property and equipment, net                                                     (175,897)              (94,674)        (315,690)           (165,155)
   Purchases of marketable debt securities                                                        (856,710)             (932,412)        (889,467)         (2,173,606)
   Proceeds from sales of marketable debt securities                                                69,309                 1,141          199,301              56,159
   Proceeds from maturities of marketable debt securities                                          124,427               394,146          370,977           1,439,837
   Proceeds from sales of marketable equity securities                                                   -               119,987                -             119,987
   Acquisitions, net of cash acquired                                                              (13,476)                    -         (179,609)                  -
   Purchase of intangible assets                                                                   (42,302)              (16,386)         (51,160)            (21,751)
   Other investing activities, net                                                                   2,714                   (86)          (7,877)                (86)
   Net cash used in investing activities                                                          (891,935)             (528,284)        (873,525)           (744,615)

CASH FLOWS FROM FINANCING ACTIVITIES:
   Proceeds from issuance of common stock, net                                                    190,875                 67,120          317,445              71,052
   Repurchases of common stock                                                                          -                      -          (79,236)                  -
   Excess tax benefits from stock-based awards                                                          -                 45,059                -              67,186
   Tax withholdings related to net share settlements of restricted stock awards
       and restricted stock units                                                                  (4,119)                (16,279)        (56,612)            (26,618)
   Other financing activities, net                                                                    (74)                      -             (74)                  -
   Net cash provided by financing activities                                                      186,682                  95,900         181,523             111,620

Effect of exchange rate changes on cash and cash equivalents                                       (10,420)               56,167           17,299              20,642

Net change in cash and cash equivalents                                                           (289,835)               (34,423)         537,440             (8,210)
Cash and cash equivalents, beginning of period                                                   2,341,205              2,318,509        1,513,930          2,292,296

Cash and cash equivalents, end of period                                                    $    2,051,370     $        2,284,086    $   2,051,370    $     2,284,086
Yahoo! Inc.
                                 Unaudited Condensed Consolidated Balance Sheets
                                                 (in thousands)


                                                                             December 31,           June 30,
                                                                                 2008                2009

ASSETS
Current assets:
    Cash and cash equivalents                                            $          2,292,296   $     2,284,086
    Short-term marketable debt securities                                           1,159,691         1,594,226
    Accounts receivable, net                                                        1,060,450           907,276
    Prepaid expenses and other current assets                                         233,061           243,263
    Total current assets                                                            4,745,498         5,028,851

Long-term marketable debt securities                                                   69,986           319,137
Property and equipment, net                                                         1,536,181         1,430,377
Goodwill                                                                            3,440,889         3,461,604
Intangible assets, net                                                                485,860           396,128
Other long-term assets                                                                233,989           131,730
Investments in equity interests                                                     3,177,445         3,308,402

Total assets                                                             $         13,689,848   $   14,076,229


LIABILITIES AND EQUITY
Current liabilities:
    Accounts payable                                                     $            151,897   $        81,803
    Accrued expenses and other current liabilities                                  1,139,894           964,422
    Deferred revenue                                                                  413,224           416,659
    Total current liabilities                                                       1,705,015         1,462,884

Long-term deferred revenue                                                            218,438           167,685
Capital lease and other long-term liabilities                                          77,062            87,197
Deferred and other long-term tax liabilities, net                                     420,372           438,014
Total liabilities                                                                   2,420,887         2,155,780

Total Yahoo! Inc. stockholders' equity                                             11,250,942       11,899,641
Noncontrolling interests                                                               18,019           20,808
Total equity                                                                       11,268,961       11,920,449

Total liabilities and equity                                             $         13,689,848   $   14,076,229

Weitere ähnliche Inhalte

Was ist angesagt?

Q2 2007 Earnings Release and Financial Tables
Q2 2007 Earnings Release and Financial TablesQ2 2007 Earnings Release and Financial Tables
Q2 2007 Earnings Release and Financial Tablesfinance7
 
Yahoo! Q2 2013 Earnings Report
Yahoo! Q2 2013 Earnings ReportYahoo! Q2 2013 Earnings Report
Yahoo! Q2 2013 Earnings ReportEarnings
 
Evine earnings presentation f17 q2
Evine earnings presentation f17 q2Evine earnings presentation f17 q2
Evine earnings presentation f17 q2evine2015
 
Evine earnings presentation f18 q2
Evine earnings presentation f18 q2Evine earnings presentation f18 q2
Evine earnings presentation f18 q2evine2015
 
meadwestvaco 1Q08_Earnings_Slides
 meadwestvaco 1Q08_Earnings_Slides meadwestvaco 1Q08_Earnings_Slides
meadwestvaco 1Q08_Earnings_Slidesfinance33
 
Evine earnings presentation f17 q4
Evine earnings presentation f17 q4Evine earnings presentation f17 q4
Evine earnings presentation f17 q4evine2015
 
Third Quarter 2016 Investor Presentation
Third Quarter 2016 Investor PresentationThird Quarter 2016 Investor Presentation
Third Quarter 2016 Investor Presentationevine2015
 
Final q2 fy16 quarterly earnings presentation
Final q2 fy16 quarterly earnings presentationFinal q2 fy16 quarterly earnings presentation
Final q2 fy16 quarterly earnings presentationrockwell_collins
 
pitney bowes 44B330C0-AAF8-412A-8D3C-CD5D3C3E3E07_Q408_Release
pitney bowes 44B330C0-AAF8-412A-8D3C-CD5D3C3E3E07_Q408_Releasepitney bowes 44B330C0-AAF8-412A-8D3C-CD5D3C3E3E07_Q408_Release
pitney bowes 44B330C0-AAF8-412A-8D3C-CD5D3C3E3E07_Q408_Releasefinance47
 
Evine earnings investor presentation f16 q4
Evine earnings investor presentation f16 q4Evine earnings investor presentation f16 q4
Evine earnings investor presentation f16 q4evine2015
 
Q2’ 2010 • investor fact sheet
Q2’ 2010 • investor fact sheetQ2’ 2010 • investor fact sheet
Q2’ 2010 • investor fact sheet20-20 Technologies
 
Evine earnings presentation f18 q1 final
Evine earnings presentation f18 q1 finalEvine earnings presentation f18 q1 final
Evine earnings presentation f18 q1 finalevine2015
 
Q2 2016 Earnings Presentation - Bruker Corporation
Q2 2016 Earnings Presentation - Bruker CorporationQ2 2016 Earnings Presentation - Bruker Corporation
Q2 2016 Earnings Presentation - Bruker CorporationInvestorBruker
 
dover 4Q05_Release
dover 4Q05_Releasedover 4Q05_Release
dover 4Q05_Releasefinance30
 

Was ist angesagt? (17)

Q2 2007 Earnings Release and Financial Tables
Q2 2007 Earnings Release and Financial TablesQ2 2007 Earnings Release and Financial Tables
Q2 2007 Earnings Release and Financial Tables
 
Yahoo! Q2 2013 Earnings Report
Yahoo! Q2 2013 Earnings ReportYahoo! Q2 2013 Earnings Report
Yahoo! Q2 2013 Earnings Report
 
Evine earnings presentation f17 q2
Evine earnings presentation f17 q2Evine earnings presentation f17 q2
Evine earnings presentation f17 q2
 
Q1 2009 Earning report of Ncr Corp
Q1 2009 Earning report of Ncr CorpQ1 2009 Earning report of Ncr Corp
Q1 2009 Earning report of Ncr Corp
 
Q1 2009 Earning Report of Equifax Inc.
Q1 2009 Earning Report of Equifax Inc.Q1 2009 Earning Report of Equifax Inc.
Q1 2009 Earning Report of Equifax Inc.
 
Evine earnings presentation f18 q2
Evine earnings presentation f18 q2Evine earnings presentation f18 q2
Evine earnings presentation f18 q2
 
Extr 4 q fy pr 2011
Extr 4 q fy pr 2011Extr 4 q fy pr 2011
Extr 4 q fy pr 2011
 
meadwestvaco 1Q08_Earnings_Slides
 meadwestvaco 1Q08_Earnings_Slides meadwestvaco 1Q08_Earnings_Slides
meadwestvaco 1Q08_Earnings_Slides
 
Evine earnings presentation f17 q4
Evine earnings presentation f17 q4Evine earnings presentation f17 q4
Evine earnings presentation f17 q4
 
Third Quarter 2016 Investor Presentation
Third Quarter 2016 Investor PresentationThird Quarter 2016 Investor Presentation
Third Quarter 2016 Investor Presentation
 
Final q2 fy16 quarterly earnings presentation
Final q2 fy16 quarterly earnings presentationFinal q2 fy16 quarterly earnings presentation
Final q2 fy16 quarterly earnings presentation
 
pitney bowes 44B330C0-AAF8-412A-8D3C-CD5D3C3E3E07_Q408_Release
pitney bowes 44B330C0-AAF8-412A-8D3C-CD5D3C3E3E07_Q408_Releasepitney bowes 44B330C0-AAF8-412A-8D3C-CD5D3C3E3E07_Q408_Release
pitney bowes 44B330C0-AAF8-412A-8D3C-CD5D3C3E3E07_Q408_Release
 
Evine earnings investor presentation f16 q4
Evine earnings investor presentation f16 q4Evine earnings investor presentation f16 q4
Evine earnings investor presentation f16 q4
 
Q2’ 2010 • investor fact sheet
Q2’ 2010 • investor fact sheetQ2’ 2010 • investor fact sheet
Q2’ 2010 • investor fact sheet
 
Evine earnings presentation f18 q1 final
Evine earnings presentation f18 q1 finalEvine earnings presentation f18 q1 final
Evine earnings presentation f18 q1 final
 
Q2 2016 Earnings Presentation - Bruker Corporation
Q2 2016 Earnings Presentation - Bruker CorporationQ2 2016 Earnings Presentation - Bruker Corporation
Q2 2016 Earnings Presentation - Bruker Corporation
 
dover 4Q05_Release
dover 4Q05_Releasedover 4Q05_Release
dover 4Q05_Release
 

Andere mochten auch

High Court Of New Delhi Legalizes+Gay+Sex
High  Court Of New Delhi Legalizes+Gay+SexHigh  Court Of New Delhi Legalizes+Gay+Sex
High Court Of New Delhi Legalizes+Gay+SexBreaking news
 
Simplicity Crib Recall 2009
Simplicity Crib Recall 2009Simplicity Crib Recall 2009
Simplicity Crib Recall 2009Breaking news
 
Options For Financing Health Reform Comparing The Impact Of Selected Policy O...
Options For Financing Health Reform Comparing The Impact Of Selected Policy O...Options For Financing Health Reform Comparing The Impact Of Selected Policy O...
Options For Financing Health Reform Comparing The Impact Of Selected Policy O...Breaking news
 
Venture Capital Investment Report Q2 2009
Venture Capital Investment Report Q2 2009Venture Capital Investment Report Q2 2009
Venture Capital Investment Report Q2 2009Breaking news
 
Ustream Sued by Square Ring Productions
Ustream Sued by Square Ring ProductionsUstream Sued by Square Ring Productions
Ustream Sued by Square Ring ProductionsBreaking news
 
Concealed Weapons Law 2009
Concealed Weapons Law 2009Concealed Weapons Law 2009
Concealed Weapons Law 2009Breaking news
 

Andere mochten auch (7)

Rnc health Survey
Rnc health SurveyRnc health Survey
Rnc health Survey
 
High Court Of New Delhi Legalizes+Gay+Sex
High  Court Of New Delhi Legalizes+Gay+SexHigh  Court Of New Delhi Legalizes+Gay+Sex
High Court Of New Delhi Legalizes+Gay+Sex
 
Simplicity Crib Recall 2009
Simplicity Crib Recall 2009Simplicity Crib Recall 2009
Simplicity Crib Recall 2009
 
Options For Financing Health Reform Comparing The Impact Of Selected Policy O...
Options For Financing Health Reform Comparing The Impact Of Selected Policy O...Options For Financing Health Reform Comparing The Impact Of Selected Policy O...
Options For Financing Health Reform Comparing The Impact Of Selected Policy O...
 
Venture Capital Investment Report Q2 2009
Venture Capital Investment Report Q2 2009Venture Capital Investment Report Q2 2009
Venture Capital Investment Report Q2 2009
 
Ustream Sued by Square Ring Productions
Ustream Sued by Square Ring ProductionsUstream Sued by Square Ring Productions
Ustream Sued by Square Ring Productions
 
Concealed Weapons Law 2009
Concealed Weapons Law 2009Concealed Weapons Law 2009
Concealed Weapons Law 2009
 

Ähnlich wie Yahoo Q2 Earnings Press Release

Keynote Reports Fiscal Q1 2009 Results
Keynote Reports Fiscal Q1 2009 ResultsKeynote Reports Fiscal Q1 2009 Results
Keynote Reports Fiscal Q1 2009 Resultsearningsreport
 
yahoo Q32008pressreleaseFINAL
yahoo Q32008pressreleaseFINALyahoo Q32008pressreleaseFINAL
yahoo Q32008pressreleaseFINALfinance32
 
yahoo Q1FY08PressReleaseFinal.
yahoo Q1FY08PressReleaseFinal.yahoo Q1FY08PressReleaseFinal.
yahoo Q1FY08PressReleaseFinal.finance32
 
Adobe Q4 and FY2008 earnings release
Adobe Q4 and FY2008 earnings releaseAdobe Q4 and FY2008 earnings release
Adobe Q4 and FY2008 earnings releaseearningsreport
 
Q2 2009 Earning Report of Sonoco Products Company
Q2 2009 Earning Report of Sonoco Products CompanyQ2 2009 Earning Report of Sonoco Products Company
Q2 2009 Earning Report of Sonoco Products Companyearningreport earningreport
 
Hewlett-Packard Q3 FY09 Earnings Announcement
Hewlett-Packard Q3 FY09 Earnings AnnouncementHewlett-Packard Q3 FY09 Earnings Announcement
Hewlett-Packard Q3 FY09 Earnings Announcementinvestorrelation
 
pitney bowes 44B330C0-AAF8-412A-8D3C-CD5D3C3E3E07_Q408_Release
pitney bowes 44B330C0-AAF8-412A-8D3C-CD5D3C3E3E07_Q408_Releasepitney bowes 44B330C0-AAF8-412A-8D3C-CD5D3C3E3E07_Q408_Release
pitney bowes 44B330C0-AAF8-412A-8D3C-CD5D3C3E3E07_Q408_Releasefinance47
 
pitney bowes 44B330C0-AAF8-412A-8D3C-CD5D3C3E3E07_Q408_Release
pitney bowes 44B330C0-AAF8-412A-8D3C-CD5D3C3E3E07_Q408_Releasepitney bowes 44B330C0-AAF8-412A-8D3C-CD5D3C3E3E07_Q408_Release
pitney bowes 44B330C0-AAF8-412A-8D3C-CD5D3C3E3E07_Q408_Releasefinance47
 
pitney bowes 44B330C0-AAF8-412A-8D3C-CD5D3C3E3E07_Q408_Release
pitney bowes  44B330C0-AAF8-412A-8D3C-CD5D3C3E3E07_Q408_Releasepitney bowes  44B330C0-AAF8-412A-8D3C-CD5D3C3E3E07_Q408_Release
pitney bowes 44B330C0-AAF8-412A-8D3C-CD5D3C3E3E07_Q408_Releasefinance47
 
intel Quarter 2008Earnings Release Q 4th
intel Quarter 2008Earnings Release Q 4thintel Quarter 2008Earnings Release Q 4th
intel Quarter 2008Earnings Release Q 4thfinance6
 
20180509 sauc q1 2018 teleconference slides final
20180509 sauc q1 2018 teleconference slides final20180509 sauc q1 2018 teleconference slides final
20180509 sauc q1 2018 teleconference slides finaldrhincorporated
 
2 q09 earnings_press_release_final
2 q09 earnings_press_release_final2 q09 earnings_press_release_final
2 q09 earnings_press_release_finalmanoranjanpattanayak
 
2 q09 earnings_press_release_final (1)
2 q09 earnings_press_release_final (1)2 q09 earnings_press_release_final (1)
2 q09 earnings_press_release_final (1)manoranjanpattanayak
 

Ähnlich wie Yahoo Q2 Earnings Press Release (20)

Keynote Reports Fiscal Q1 2009 Results
Keynote Reports Fiscal Q1 2009 ResultsKeynote Reports Fiscal Q1 2009 Results
Keynote Reports Fiscal Q1 2009 Results
 
Read the Earnings Release
Read the Earnings ReleaseRead the Earnings Release
Read the Earnings Release
 
Read the Earnings Release
Read the Earnings ReleaseRead the Earnings Release
Read the Earnings Release
 
yahoo Q32008pressreleaseFINAL
yahoo Q32008pressreleaseFINALyahoo Q32008pressreleaseFINAL
yahoo Q32008pressreleaseFINAL
 
yahoo Q1FY08PressReleaseFinal.
yahoo Q1FY08PressReleaseFinal.yahoo Q1FY08PressReleaseFinal.
yahoo Q1FY08PressReleaseFinal.
 
Adobe Q4 and FY2008 earnings release
Adobe Q4 and FY2008 earnings releaseAdobe Q4 and FY2008 earnings release
Adobe Q4 and FY2008 earnings release
 
Q2 2009 Earning Report of Sonoco Products Company
Q2 2009 Earning Report of Sonoco Products CompanyQ2 2009 Earning Report of Sonoco Products Company
Q2 2009 Earning Report of Sonoco Products Company
 
Hewlett-Packard Q3 FY09 Earnings Announcement
Hewlett-Packard Q3 FY09 Earnings AnnouncementHewlett-Packard Q3 FY09 Earnings Announcement
Hewlett-Packard Q3 FY09 Earnings Announcement
 
pitney bowes 44B330C0-AAF8-412A-8D3C-CD5D3C3E3E07_Q408_Release
pitney bowes 44B330C0-AAF8-412A-8D3C-CD5D3C3E3E07_Q408_Releasepitney bowes 44B330C0-AAF8-412A-8D3C-CD5D3C3E3E07_Q408_Release
pitney bowes 44B330C0-AAF8-412A-8D3C-CD5D3C3E3E07_Q408_Release
 
pitney bowes 44B330C0-AAF8-412A-8D3C-CD5D3C3E3E07_Q408_Release
pitney bowes 44B330C0-AAF8-412A-8D3C-CD5D3C3E3E07_Q408_Releasepitney bowes 44B330C0-AAF8-412A-8D3C-CD5D3C3E3E07_Q408_Release
pitney bowes 44B330C0-AAF8-412A-8D3C-CD5D3C3E3E07_Q408_Release
 
pitney bowes 44B330C0-AAF8-412A-8D3C-CD5D3C3E3E07_Q408_Release
pitney bowes  44B330C0-AAF8-412A-8D3C-CD5D3C3E3E07_Q408_Releasepitney bowes  44B330C0-AAF8-412A-8D3C-CD5D3C3E3E07_Q408_Release
pitney bowes 44B330C0-AAF8-412A-8D3C-CD5D3C3E3E07_Q408_Release
 
Q2 2009 Earning Report of Unify Corporation
Q2 2009 Earning Report of Unify CorporationQ2 2009 Earning Report of Unify Corporation
Q2 2009 Earning Report of Unify Corporation
 
intel Quarter 2008Earnings Release Q 4th
intel Quarter 2008Earnings Release Q 4thintel Quarter 2008Earnings Release Q 4th
intel Quarter 2008Earnings Release Q 4th
 
20180509 sauc q1 2018 teleconference slides final
20180509 sauc q1 2018 teleconference slides final20180509 sauc q1 2018 teleconference slides final
20180509 sauc q1 2018 teleconference slides final
 
2 q09 earnings_press_release_final
2 q09 earnings_press_release_final2 q09 earnings_press_release_final
2 q09 earnings_press_release_final
 
2 q09 earnings_press_release_final (1)
2 q09 earnings_press_release_final (1)2 q09 earnings_press_release_final (1)
2 q09 earnings_press_release_final (1)
 
Extr 4 q fy pr 2010
Extr 4 q fy pr 2010Extr 4 q fy pr 2010
Extr 4 q fy pr 2010
 
Q1 2009 Earning Report of Google Inc.
Q1 2009 Earning Report of Google Inc.Q1 2009 Earning Report of Google Inc.
Q1 2009 Earning Report of Google Inc.
 
Q1 2009 Earning Report of Illinois Tool Works
Q1 2009 Earning Report of Illinois Tool WorksQ1 2009 Earning Report of Illinois Tool Works
Q1 2009 Earning Report of Illinois Tool Works
 
Q3 2009 Earning Report of Accenture
Q3 2009 Earning Report of AccentureQ3 2009 Earning Report of Accenture
Q3 2009 Earning Report of Accenture
 

Mehr von Breaking news

Saez U Stopincomes 2007
Saez U Stopincomes 2007Saez U Stopincomes 2007
Saez U Stopincomes 2007Breaking news
 
Template Twitter Strategy for Government Departments
Template Twitter Strategy for Government DepartmentsTemplate Twitter Strategy for Government Departments
Template Twitter Strategy for Government DepartmentsBreaking news
 
Lawsuit Against Ruth Madoff (Irving Picard)
Lawsuit Against Ruth Madoff (Irving Picard)Lawsuit Against Ruth Madoff (Irving Picard)
Lawsuit Against Ruth Madoff (Irving Picard)Breaking news
 
Unlocking Energy Efficiency In The Us Economy
Unlocking Energy Efficiency In The Us EconomyUnlocking Energy Efficiency In The Us Economy
Unlocking Energy Efficiency In The Us EconomyBreaking news
 
Projection Map Of The Eclipse Path
Projection Map Of The Eclipse PathProjection Map Of The Eclipse Path
Projection Map Of The Eclipse PathBreaking news
 
Us Department Of Labor Mass Layoffs June 2009
Us Department Of Labor Mass Layoffs June 2009Us Department Of Labor Mass Layoffs June 2009
Us Department Of Labor Mass Layoffs June 2009Breaking news
 
I 9 Audit Krispy Kreme
I 9 Audit  Krispy KremeI 9 Audit  Krispy Kreme
I 9 Audit Krispy KremeBreaking news
 
Jackson Kids Birth Certificates
Jackson Kids Birth CertificatesJackson Kids Birth Certificates
Jackson Kids Birth CertificatesBreaking news
 
F As In Fat Obesity Report
F As In Fat Obesity ReportF As In Fat Obesity Report
F As In Fat Obesity ReportBreaking news
 
WHITE HOUSE Staff Salaries 2009
WHITE HOUSE Staff Salaries 2009WHITE HOUSE Staff Salaries 2009
WHITE HOUSE Staff Salaries 2009Breaking news
 

Mehr von Breaking news (11)

Saez U Stopincomes 2007
Saez U Stopincomes 2007Saez U Stopincomes 2007
Saez U Stopincomes 2007
 
Template Twitter Strategy for Government Departments
Template Twitter Strategy for Government DepartmentsTemplate Twitter Strategy for Government Departments
Template Twitter Strategy for Government Departments
 
Lawsuit Against Ruth Madoff (Irving Picard)
Lawsuit Against Ruth Madoff (Irving Picard)Lawsuit Against Ruth Madoff (Irving Picard)
Lawsuit Against Ruth Madoff (Irving Picard)
 
Unlocking Energy Efficiency In The Us Economy
Unlocking Energy Efficiency In The Us EconomyUnlocking Energy Efficiency In The Us Economy
Unlocking Energy Efficiency In The Us Economy
 
Projection Map Of The Eclipse Path
Projection Map Of The Eclipse PathProjection Map Of The Eclipse Path
Projection Map Of The Eclipse Path
 
Rnc Memo 1
Rnc Memo 1Rnc Memo 1
Rnc Memo 1
 
Us Department Of Labor Mass Layoffs June 2009
Us Department Of Labor Mass Layoffs June 2009Us Department Of Labor Mass Layoffs June 2009
Us Department Of Labor Mass Layoffs June 2009
 
I 9 Audit Krispy Kreme
I 9 Audit  Krispy KremeI 9 Audit  Krispy Kreme
I 9 Audit Krispy Kreme
 
Jackson Kids Birth Certificates
Jackson Kids Birth CertificatesJackson Kids Birth Certificates
Jackson Kids Birth Certificates
 
F As In Fat Obesity Report
F As In Fat Obesity ReportF As In Fat Obesity Report
F As In Fat Obesity Report
 
WHITE HOUSE Staff Salaries 2009
WHITE HOUSE Staff Salaries 2009WHITE HOUSE Staff Salaries 2009
WHITE HOUSE Staff Salaries 2009
 

Kürzlich hochgeladen

Quiz for Heritage Indian including all the rounds
Quiz for Heritage Indian including all the roundsQuiz for Heritage Indian including all the rounds
Quiz for Heritage Indian including all the roundsnaxymaxyy
 
Experience the Future of the Web3 Gaming Trend
Experience the Future of the Web3 Gaming TrendExperience the Future of the Web3 Gaming Trend
Experience the Future of the Web3 Gaming TrendFabwelt
 
Manipur-Book-Final-2-compressed.pdfsal'rpk
Manipur-Book-Final-2-compressed.pdfsal'rpkManipur-Book-Final-2-compressed.pdfsal'rpk
Manipur-Book-Final-2-compressed.pdfsal'rpkbhavenpr
 
16042024_First India Newspaper Jaipur.pdf
16042024_First India Newspaper Jaipur.pdf16042024_First India Newspaper Jaipur.pdf
16042024_First India Newspaper Jaipur.pdfFIRST INDIA
 
Rohan Jaitley: Central Gov't Standing Counsel for Justice
Rohan Jaitley: Central Gov't Standing Counsel for JusticeRohan Jaitley: Central Gov't Standing Counsel for Justice
Rohan Jaitley: Central Gov't Standing Counsel for JusticeAbdulGhani778830
 
Global Terrorism and its types and prevention ppt.
Global Terrorism and its types and prevention ppt.Global Terrorism and its types and prevention ppt.
Global Terrorism and its types and prevention ppt.NaveedKhaskheli1
 
57 Bidens Annihilation Nation Policy.pdf
57 Bidens Annihilation Nation Policy.pdf57 Bidens Annihilation Nation Policy.pdf
57 Bidens Annihilation Nation Policy.pdfGerald Furnkranz
 
VIP Girls Available Call or WhatsApp 9711199012
VIP Girls Available Call or WhatsApp 9711199012VIP Girls Available Call or WhatsApp 9711199012
VIP Girls Available Call or WhatsApp 9711199012ankitnayak356677
 
complaint-ECI-PM-media-1-Chandru.pdfra;;prfk
complaint-ECI-PM-media-1-Chandru.pdfra;;prfkcomplaint-ECI-PM-media-1-Chandru.pdfra;;prfk
complaint-ECI-PM-media-1-Chandru.pdfra;;prfkbhavenpr
 
IndiaWest: Your Trusted Source for Today's Global News
IndiaWest: Your Trusted Source for Today's Global NewsIndiaWest: Your Trusted Source for Today's Global News
IndiaWest: Your Trusted Source for Today's Global NewsIndiaWest2
 

Kürzlich hochgeladen (10)

Quiz for Heritage Indian including all the rounds
Quiz for Heritage Indian including all the roundsQuiz for Heritage Indian including all the rounds
Quiz for Heritage Indian including all the rounds
 
Experience the Future of the Web3 Gaming Trend
Experience the Future of the Web3 Gaming TrendExperience the Future of the Web3 Gaming Trend
Experience the Future of the Web3 Gaming Trend
 
Manipur-Book-Final-2-compressed.pdfsal'rpk
Manipur-Book-Final-2-compressed.pdfsal'rpkManipur-Book-Final-2-compressed.pdfsal'rpk
Manipur-Book-Final-2-compressed.pdfsal'rpk
 
16042024_First India Newspaper Jaipur.pdf
16042024_First India Newspaper Jaipur.pdf16042024_First India Newspaper Jaipur.pdf
16042024_First India Newspaper Jaipur.pdf
 
Rohan Jaitley: Central Gov't Standing Counsel for Justice
Rohan Jaitley: Central Gov't Standing Counsel for JusticeRohan Jaitley: Central Gov't Standing Counsel for Justice
Rohan Jaitley: Central Gov't Standing Counsel for Justice
 
Global Terrorism and its types and prevention ppt.
Global Terrorism and its types and prevention ppt.Global Terrorism and its types and prevention ppt.
Global Terrorism and its types and prevention ppt.
 
57 Bidens Annihilation Nation Policy.pdf
57 Bidens Annihilation Nation Policy.pdf57 Bidens Annihilation Nation Policy.pdf
57 Bidens Annihilation Nation Policy.pdf
 
VIP Girls Available Call or WhatsApp 9711199012
VIP Girls Available Call or WhatsApp 9711199012VIP Girls Available Call or WhatsApp 9711199012
VIP Girls Available Call or WhatsApp 9711199012
 
complaint-ECI-PM-media-1-Chandru.pdfra;;prfk
complaint-ECI-PM-media-1-Chandru.pdfra;;prfkcomplaint-ECI-PM-media-1-Chandru.pdfra;;prfk
complaint-ECI-PM-media-1-Chandru.pdfra;;prfk
 
IndiaWest: Your Trusted Source for Today's Global News
IndiaWest: Your Trusted Source for Today's Global NewsIndiaWest: Your Trusted Source for Today's Global News
IndiaWest: Your Trusted Source for Today's Global News
 

Yahoo Q2 Earnings Press Release

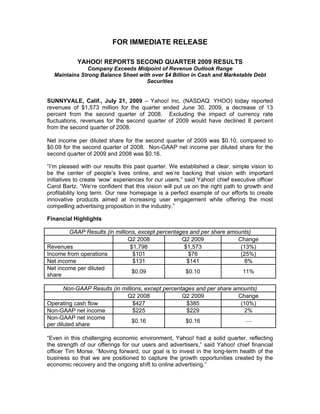
  • 1. FOR IMMEDIATE RELEASE YAHOO! REPORTS SECOND QUARTER 2009 RESULTS Company Exceeds Midpoint of Revenue Outlook Range Maintains Strong Balance Sheet with over $4 Billion in Cash and Marketable Debt Securities SUNNYVALE, Calif., July 21, 2009 – Yahoo! Inc. (NASDAQ: YHOO) today reported revenues of $1,573 million for the quarter ended June 30, 2009, a decrease of 13 percent from the second quarter of 2008. Excluding the impact of currency rate fluctuations, revenues for the second quarter of 2009 would have declined 8 percent from the second quarter of 2008. Net income per diluted share for the second quarter of 2009 was $0.10, compared to $0.09 for the second quarter of 2008. Non-GAAP net income per diluted share for the second quarter of 2009 and 2008 was $0.16. “I’m pleased with our results this past quarter. We established a clear, simple vision to be the center of people’s lives online, and we’re backing that vision with important initiatives to create ‘wow’ experiences for our users,” said Yahoo! chief executive officer Carol Bartz. “We’re confident that this vision will put us on the right path to growth and profitability long term. Our new homepage is a perfect example of our efforts to create innovative products aimed at increasing user engagement while offering the most compelling advertising proposition in the industry.” Financial Highlights GAAP Results (in millions, except percentages and per share amounts) Q2 2008 Q2 2009 Change Revenues $1,798 $1,573 (13%) Income from operations $101 $76 (25%) Net income $131 $141 8% Net income per diluted $0.09 $0.10 11% share Non-GAAP Results (in millions, except percentages and per share amounts) Q2 2008 Q2 2009 Change Operating cash flow $427 $385 (10%) Non-GAAP net income $225 $229 2% Non-GAAP net income $0.16 $0.16 — per diluted share “Even in this challenging economic environment, Yahoo! had a solid quarter, reflecting the strength of our offerings for our users and advertisers,” said Yahoo! chief financial officer Tim Morse. “Moving forward, our goal is to invest in the long-term health of the business so that we are positioned to capture the growth opportunities created by the economic recovery and the ongoing shift to online advertising.”
  • 2. Revenues Total revenues were reduced by the effects of currency rate fluctuations, the sale of Kelkoo in late 2008 and lower fees revenues from voice-over IP services and subscription music offerings. Excluding the effects of these items, revenues would have declined 6 percent. Marketing services revenues declined 13 percent and fees revenues declined 8 percent, compared to the second quarter of 2008. Marketing services revenues from Owned and Operated sites were $858 million for the second quarter of 2009, a 16 percent decrease compared to $1,016 million for the same period of 2008. The decrease was driven by a 15 percent decline in search advertising revenue and a 14 percent decline in display advertising revenue. Marketing services revenues from Affiliate sites were $520 million for the second quarter of 2009, a 9 percent decrease compared to $571 million for the same period of 2008. The decrease was driven primarily by a shift to lower yielding inventory. Cost Initiatives During the second quarter of 2009, the Company recorded a $65 million net restructuring charge for real estate facilities exited, changes in sublease income estimates for previously exited facilities, write-off of property and equipment for exited facilities, and personnel severance and related costs offset by a reversal of stock-based compensation expense for forfeited awards. The Company is also continuing to implement non-headcount cost reductions. Cash Flow and Cash Balance Cash flow from operating activities for the second quarter of 2009 was $342 million, a 20 percent decrease compared to $426 million for the same period of 2008. Free cash flow for the second quarter of 2009 was $266 million, a 15 percent increase compared to $231 million for the same period of 2008. Cash, cash equivalents and investments in marketable debt securities were $4,197 million at June 30, 2009 compared to $3,522 million at December 31, 2008, an increase of $675 million. Business Outlook GAAP revenue for the third quarter of 2009 is expected to be in the range of $1,450 million to $1,550 million. Non-GAAP operating income before depreciation, amortization, and stock-based compensation expense for the third quarter of 2009 is expected to be in the range of $330 million to $370 million. Income from operations for the third quarter of 2009 is expected to be in the range of $55 million to $65 million.
  • 3. Conference Call Yahoo! will host a conference call to discuss second quarter 2009 results at 5:00 p.m. Eastern Time today. A live webcast of the conference call, together with supplemental financial information, can be accessed through the Company's Investor Relations website at http://yhoo.client.shareholder.com/results.cfm. In addition, an archive of the webcast can be accessed through the same link. An audio replay of the call will be available for one week following the conference call by calling (888) 286-8010 or (617) 801-6888, reservation number: 71179022. Note Regarding Non-GAAP Financial Measures This press release and its attachments include the following financial measures defined as non-GAAP financial measures by the Securities and Exchange Commission (“SEC”): revenues excluding traffic acquisition costs or TAC; operating income before depreciation, amortization, and stock-based compensation expense (also referred to as operating cash flow); free cash flow; and non-GAAP net income and non-GAAP net income per diluted share. These measures may be different than non-GAAP financial measures used by other companies. The presentation of this financial information is not intended to be considered in isolation or as a substitute for the financial information prepared and presented in accordance with generally accepted accounting principles (“GAAP”). Explanations of the Company’s non-GAAP financial measures and reconciliations of these financial measures to the GAAP financial measures the Company considers most comparable are included in the accompanying “Note to Unaudited Condensed Consolidated Statements of Income,” “Reconciliations to Unaudited Condensed Consolidated Statements of Income,” “Reconciliation of GAAP Net Income and GAAP Net Income Per Diluted Share to Non-GAAP Net Income and Non-GAAP Net Income Per Diluted Share” and “Business Outlook.” About Yahoo! Yahoo! Inc. (“Yahoo!” or the “Company”) is a leading global consumer brand and one of the most trafficked Internet destinations worldwide. Yahoo! is where millions of people go every day to see what is happening with the people and things that matter to them most. Yahoo! helps marketers reach that audience with its unique and compelling advertiser proposition. Yahoo! is headquartered in Sunnyvale, California. For more information, visit http://pressroom.yahoo.com or the Company’s blog, Yodel Anecdotal (http://yodel.yahoo.com).
  • 4. “Owned and Operated sites” refers to Yahoo!’s owned and operated online properties and services. “Affiliate sites” refers to Yahoo!'s distribution network of third-party entities who have integrated Yahoo!'s advertising offerings into their websites or their other offerings. This press release and its attachments contain forward-looking statements that involve risks and uncertainties concerning Yahoo!'s expected financial performance (including without limitation the statements and information in the Business Outlook section and the quotations from management in this press release), as well as Yahoo!'s strategic and operational plans. Actual results may differ materially from the results predicted and reported results should not be considered as an indication of future performance. The potential risks and uncertainties include, among others, the impact of management and organizational changes; the implementation and results of Yahoo!'s ongoing strategic and cost initiatives; Yahoo!'s ability to compete with new or existing competitors; reduction in spending by, or loss of, marketing services customers; the demand by customers for Yahoo!'s premium services; acceptance by users of new products and services; risks related to joint ventures and the integration of acquisitions; risks related to Yahoo!'s international operations; failure to manage growth and diversification; adverse results in litigation, including intellectual property infringement claims; Yahoo!'s ability to protect its intellectual property and the value of its brands; dependence on key personnel; dependence on third parties for technology, services, content, and distribution; general economic conditions and changes in economic conditions; and the possibility that third parties may in the future make proposals to acquire all or a part of Yahoo! or take other actions which may create uncertainty for our employees, publishers, advertisers, and other business partners. All information set forth in this press release and its attachments is as of July 21, 2009. Yahoo! does not intend, and undertakes no duty, to update this information to reflect future events or circumstances. More information about potential factors that could affect the Company's business and financial results is included under the captions "Risk Factors" and "Management's Discussion and Analysis of Financial Condition and Results of Operations" in the Company's Annual Report on Form 10-K for the year ended December 31, 2008, and Quarterly Report on Form 10-Q for the quarter ended March 31, 2009, which are on file with the SEC and available on the SEC's website at www.sec.gov. Additional information will also be set forth in those sections in Yahoo!’s Quarterly Report on Form 10-Q for the quarter ended June 30, 2009, which will be filed with the SEC in the third quarter of 2009. Yahoo! and the Yahoo! logos are trademarks and/or registered trademarks of Yahoo! Inc. All other names are trademarks and/or registered trademarks of their respective owners. Media Relations Contact: Kim Rubey, Yahoo! Inc., (408) 349-8910, krubey@yahoo-inc.com Investor Relations Contact: Cathy La Rocca, Yahoo! Inc., (408) 349-5188, cathy@yahoo-inc.com
  • 5. Yahoo! Inc. Unaudited Condensed Consolidated Statements of Income (in thousands, except per share amounts) Three Months Ended Six Months Ended June 30, June 30, 2008 2009 2008 2009 Revenues $ 1,798,085 $ 1,572,897 $ 3,615,687 $ 3,152,939 Cost of revenues 765,911 712,453 1,520,994 1,413,190 Gross profit 1,032,174 860,444 2,094,693 1,739,749 Operating expenses: Sales and marketing 404,899 280,386 829,490 601,498 Product development 314,719 291,398 620,325 597,441 General and administrative 188,811 138,652 359,891 275,649 Amortization of intangibles 23,224 9,253 46,964 18,920 Restructuring charges, net - 65,002 16,885 69,803 Total operating expenses 931,653 784,691 1,873,555 1,563,311 Income from operations 100,521 75,753 221,138 176,438 Other income, net 24,583 72,010 39,248 76,970 Income before income taxes and earnings in equity interests 125,104 147,763 260,386 253,408 Provision for income taxes (47,656) (68,879) (100,955) (104,763) Earnings in equity interests (1) 54,927 64,156 509,709 113,090 Net income 132,375 143,040 669,140 261,735 Less: Net income attributable to noncontrolling interests (1,214) (1,653) (1,139) (2,790) Net income attributable to Yahoo! Inc. $ 131,161 $ 141,387 $ 668,001 $ 258,945 Net income attributable to Yahoo! Inc. common stockholders per share - diluted(2) $ 0.09 $ 0.10 $ 0.46 $ 0.18 Shares used in per share calculation - diluted 1,397,839 1,414,295 1,391,930 1,410,348 Stock-based compensation expense was allocated as follows: Cost of revenues $ 3,549 $ 2,663 $ 6,829 $ 6,242 Sales and marketing 56,306 35,651 121,844 85,548 Product development 46,442 51,647 94,524 105,925 General and administrative 16,871 22,565 37,260 41,531 Restructuring expense reversals - (7,600) (12,284) (7,600) Supplemental Financial Data: Revenues excluding TAC $ 1,345,969 $ 1,136,346 $ 2,698,027 $ 2,292,593 Operating income before depreciation, amortization, and stock-based compensation expense (or operating cash flow) $ 427,046 $ 385,444 $ 860,179 $ 794,422 Free cash flow (3) $ 230,999 $ 266,034 $ 877,511 $ 480,029 Non-GAAP net income per share - diluted $ 0.16 $ 0.16 $ 0.34 $ 0.31 (1) The six months ended June 30, 2008 includes Yahoo!'s net non-cash gain of $401 million recorded in the first quarter of 2008 related to Alibaba Group's initial public offering of Alibaba.com, net of tax. (2) The impact of outstanding stock awards of entities in which the Company holds equity interests that are accounted for using the equity method reduced the Company's diluted earnings per share by $0.02 for the six months ended June 30, 2008. (3) The six months ended June 30, 2008 includes a $350 million one-time payment from AT&T Inc. recorded in the first quarter of 2008.
  • 6. Yahoo! Inc. Note to Unaudited Condensed Consolidated Statements of Income This press release and its attachments include the non-GAAP financial measures of revenues excluding traffic acquisition costs or TAC, operating income before depreciation, amortization, and stock-based compensation expense (also referred to as operating cash flow), free cash flow, non-GAAP net income, and non-GAAP net income per diluted share, which are reconciled to GAAP revenue, income from operations, cash flow from operating activities, net income attributable to Yahoo! Inc., and net income attributable to Yahoo! Inc. common stockholders per diluted share, respectively, which we believe are the most comparable GAAP measures. We use these non-GAAP financial measures for internal managerial purposes, when publicly providing our business outlook, and to facilitate period-to-period comparisons. We describe limitations specific to each non-GAAP financial measure below. Management generally compensates for limitations in the use of non-GAAP financial measures by relying on comparable GAAP financial measures and providing investors with a reconciliation of the non-GAAP financial measure to the most directly comparable GAAP financial measure or measures. Further, management uses non-GAAP financial measures only in addition to and in conjunction with results presented in accordance with GAAP. We believe that these non-GAAP financial measures reflect an additional way of viewing aspects of our operations that, when viewed with our GAAP results, provide a more complete understanding of factors and trends affecting our business. These non-GAAP measures should be considered as a supplement to, and not as a substitute for, or superior to, GAAP revenues, income from operations, cash flow from operating activities, net income attributable to Yahoo! Inc., and net income attributable to Yahoo! Inc. common stockholders per diluted share calculated in accordance with GAAP. Revenues excluding TAC is defined as GAAP revenues less TAC. TAC consists of payments made to Affiliate sites and payments made to companies that direct consumer and business traffic to the Yahoo! website. We present revenues excluding TAC: (1) to provide a metric for our investors to analyze and value our Company and (2) to provide investors one of the primary metrics used by the Company for evaluation and decision-making purposes. We provide revenues excluding TAC because we believe it is useful to investors in valuing our Company. One of the ways investors value companies is to apply a multiple to revenues. Since a significant portion of the GAAP revenues associated with our sponsored search offerings is paid to our Affiliate sites, we believe investors find it more meaningful to apply multiples to revenues excluding TAC to assess our value as this avoids “double counting” revenues that are paid to, and being reported by, our Affiliate sites. Further, management uses revenues excluding TAC for evaluating the performance of our business, making operating decisions, budgeting purposes, and as a factor in determining management compensation. A limitation of revenues excluding TAC is that it is a measure which we have defined for internal and investor purposes that may be unique to the Company, and therefore it may not enhance the comparability of our results to other companies in our industry who have similar business arrangements but address the impact of TAC differently. Management compensates for these limitations by also relying on the comparable GAAP financial measures of revenues, cost of revenues, and gross profit, each of which includes the impact of TAC. Operating income before depreciation, amortization, and stock-based compensation expense (also referred to as operating cash flow) is defined as income/(loss) from operations before depreciation, amortization of intangible assets, and stock-based compensation expense. We consider this measure to be an important indicator of the operational strength of the Company. We exclude depreciation and amortization because while tangible and intangible assets support our businesses, we do not believe the related depreciation and amortization costs are directly attributable to the operating performance of our business. This measure is used by some investors when assessing the performance of our Company. In addition, because of the variety of equity awards used by companies, the varying methodologies for determining stock-based compensation expense, and the subjective assumptions involved in those determinations, we believe excluding stock-based compensation expense enhances the ability of management and investors to understand the impact of stock-based compensation expense on our operating income. We do not include depreciation, amortization, and stock-based compensation expense in our internal measures or in the measures used by the Company to formulate our business outlook presented with our quarterly financial information to investors. A limitation associated with the non-GAAP measure of operating income before depreciation, amortization, and stock-based compensation expense is that it does not reflect the periodic costs of certain capitalized tangible and intangible assets used in generating revenues in our businesses. Management evaluates the costs of such tangible and intangible assets through other financial measures such as capital expenditures. A further limitation associated with this measure is that it does not include stock-based compensation expense related to the Company’s workforce. Management compensates for these limitations by also relying on the comparable GAAP financial measure of income from operations, which includes depreciation, amortization, and stock-based compensation expense. Free cash flow is a non-GAAP financial measure defined as cash flow from operating activities (adjusted to include excess tax benefits from stock-based compensation), less net capital expenditures and dividends received. We consider free cash flow to be a liquidity measure which provides useful information to management and investors about the amount of cash generated by the business after the acquisition of property and equipment, which can then be used for strategic opportunities including, among others, investing in the Company's business, making strategic acquisitions, strengthening the balance sheet, and repurchasing stock. A limitation of free cash flow is that it does not represent the total increase or decrease in the cash balance for the period. Management compensates for this limitation by also relying on the net change in cash and cash equivalents as presented in the Company’s unaudited condensed consolidated statements of cash flows prepared in accordance with GAAP which incorporates all cash movements during the period. Non-GAAP net income is defined as net income excluding certain gains, losses, expenses, and their related tax effects that we do not believe are indicative of our ongoing operating results and further adjusted to exclude stock-based compensation expense. In our calculation of non-GAAP net income and non- GAAP net income per diluted share, we have excluded stock-based compensation expense and its related tax effects. Because of the variety of equity awards used by companies, the varying methodologies for determining stock-based compensation expense, and the subjective assumptions involved in those determinations, we believe excluding stock-based compensation expense enhances the ability of management and investors to understand the impact of stock-based compensation expense on net income and net income per diluted share. We also consider non-GAAP net income and non-GAAP net income per diluted share to be profitability measures which facilitate the forecasting of our operating results for future periods and allow for the comparison of our results to historical periods. A limitation of non-GAAP net income and non-GAAP net income per diluted share is that they do not include all items that impact our net income and net income per diluted share for the period. Management compensates for this limitation by also relying on the comparable GAAP financial measures of net income attributable to Yahoo! Inc. and net income attributable to Yahoo! Inc. common stockholders per diluted share, both of which include the gains, losses, expenses and related tax effects that are excluded from non-GAAP net income and non-GAAP net income per diluted share.
  • 7. Yahoo! Inc. Reconciliations to Unaudited Condensed Consolidated Statements of Income (in thousands) Three Months Ended Six Months Ended June 30, June 30, 2008 2009 2008 2009 Revenues for groups of similar services: Marketing services: Owned and Operated sites $ 1,015,688 $ 858,160 $ 1,981,328 $ 1,730,063 Affiliate sites 571,268 519,690 1,178,072 1,030,968 Marketing services 1,586,956 1,377,850 3,159,400 2,761,031 Fees 211,129 195,047 456,287 391,908 Total revenues $ 1,798,085 $ 1,572,897 $ 3,615,687 $ 3,152,939 Revenues by segment: United States $ 1,262,191 $ 1,152,393 $ 2,567,531 $ 2,340,323 International 535,894 420,504 1,048,156 812,616 Total revenues $ 1,798,085 $ 1,572,897 $ 3,615,687 $ 3,152,939 Revenues excluding traffic acquisition costs ("TAC"): GAAP revenue $ 1,798,085 $ 1,572,897 $ 3,615,687 $ 3,152,939 TAC        (452,116) (436,551)         (917,660) (860,346) Revenues excluding TAC $ 1,345,969 $ 1,136,346 $ 2,698,027 $ 2,292,593 Revenues excluding TAC by segment: United States: GAAP revenue $ 1,262,191 $ 1,152,393 $ 2,567,531 $ 2,340,323 TAC (270,875) (290,536) (548,291) (580,679) Revenues excluding TAC $ 991,316 $ 861,857 $ 2,019,240 $ 1,759,644 International: GAAP revenue $ 535,894 $ 420,504 $ 1,048,156 $ 812,616 TAC (181,241) (146,015) (369,369) (279,667) Revenues excluding TAC $ 354,653 $ 274,489 $ 678,787 $ 532,949 Operating income before depreciation, amortization, and stock-based compensation expense (or operating cash flow): Income from operations $ 100,521 $ 75,753 $ 221,138 $ 176,438 Depreciation and amortization 203,357 204,765 390,868 386,338 Stock-based compensation expense 123,168 104,926 248,173 231,646 Operating income before depreciation, amortization, and stock-based compensation expense $ 427,046 $ 385,444 $ 860,179 $ 794,422 Operating income before depreciation, amortization, and stock-based compensation expense (or operating cash flow) by segment: Operating income before depreciation, amortization, and stock-based compensation expense - United States $ 295,537 $ 268,205 $ 608,630 $ 560,937 Operating income before depreciation, amortization, and stock-based compensation expense - International 131,509 117,239 251,549 233,485 Operating income before depreciation, amortization, and stock-based compensation expense $ 427,046 $ 385,444 $ 860,179 $ 794,422 United States: Income/(loss) from operations $ 19,380 $ (8,553) $ 66,475 $ 12,274 Depreciation and amortization 168,457 182,810 321,640 342,661 Stock-based compensation expense 107,700 93,948 220,515 206,002 Operating income before depreciation, amortization, and stock-based compensation expense - United States $ 295,537 $ 268,205 $ 608,630 $ 560,937 International: Income from operations $ 81,141 $ 84,306 $ 154,663 $ 164,164 Depreciation and amortization 34,900 21,955 69,228 43,677 Stock-based compensation expense 15,468 10,978 27,658 25,644 Operating income before depreciation, amortization, and stock-based compensation expense - International $ 131,509 $ 117,239 $ 251,549 $ 233,485 Free cash flow: Cash flow from operating activities (3) $ 425,838 $ 341,794 $ 1,212,143 $ 604,143 Acquisition of property and equipment, net (175,897) (94,674) (315,690) (165,155) Dividends received (18,942) (26,145) (18,942) (26,145) Excess tax benefits from stock-based awards - 45,059 - 67,186 Free cash flow (3) $ 230,999 $ 266,034 $ 877,511 $ 480,029 (3) The six months ended June 30, 2008 includes a $350 million one-time payment from AT&T Inc. recorded in the first quarter of 2008.
  • 8. Yahoo! Inc. Reconciliation of GAAP Net Income and GAAP Net Income Per Diluted Share to Non-GAAP Net Income and Non-GAAP Net Income Per Diluted Share (in thousands, except per share amounts) Three Months Ended June 30, 2008 2009 GAAP Net income attributable to Yahoo! Inc. $ 131,161 $ 141,387 (a) Stock-based compensation expense (4) 123,168 112,526 (b) (5) Incremental costs for advisors related to the strategic alternatives and related matters 22,300 - (c) Restructuring charges, net - 65,002 (d) Gain on sale of Gmarket investment - (66,684) (e) To adjust the provision for income taxes to exclude the tax impact of items (a) through (d) above for the three months ended June 30, 2008 and 2009, respectively (38,385) (25,646) (f) To adjust the provision for income taxes to reflect an adjusted effective tax rate (calculated excluding the full year impact of items (a) through (d) above) of 37% and 36% for the three months ended June 30, 2008 and 2009, respectively (12,989) 2,720 Non-GAAP Net income $ 225,255 $ 229,305 GAAP Net income attributable to Yahoo! Inc. common stockholders per share - diluted $ 0.09 $ 0.10 Non-GAAP Net income per share - diluted $ 0.16 $ 0.16 Shares used in non-GAAP per share calculation - diluted 1,397,839 1,414,295 Six Months Ended June 30, 2008 2009 GAAP Net income attributable to Yahoo! Inc. $ 668,001 $ 258,945 (a) Stock-based compensation expense (4) 260,457 239,246 (b) (5) Incremental costs for advisors related to the strategic alternatives and related matters 36,156 - (c) Restructuring charges, net 16,885 69,803 (d) Gain on sale of Gmarket investment - (66,684) (e) To adjust the provision for income taxes to exclude the tax impact of items (a) through (d) above for the six months ended June 30, 2008 and 2009, respectively (83,420) (54,368) (f) To adjust the provision for income taxes to reflect an adjusted effective tax rate (calculated excluding the full year impact of items (a) through (d) above) of 37% and 33% for the six months ended June 30, 2008 and 2009, respectively (25,666) (2,952) (g) Yahoo!'s non-cash gain related to Alibaba Group's initial public offering of Alibaba.com, net of tax, which is included in earnings in equity interests (401,090) - Non-GAAP Net income $ 471,323 $ 443,990 GAAP Net income attributable to Yahoo! Inc. common stockholders per share - diluted (2) $ 0.46 $ 0.18 Non-GAAP Net income per share - diluted $ 0.34 $ 0.31 Shares used in non-GAAP per share calculation - diluted 1,391,930 1,410,348 (2) The impact of outstanding stock awards of entities in which the Company holds equity interests that are accounted for using the equity method reduced the Company's diluted earnings per share by $0.02 for the six months ended June 30, 2008. (4) The stock-based compensation restructuring expense reversals are included in restructuring charges net, footnote (c), for the three and six months ended June 30, 2008 and 2009. (5) Includes incremental costs for advisors related to Microsoft's proposals to acquire all or a part of the Company, other strategic alternatives, including the Google agreement, the proxy contest, and related litigation defense. These costs were immaterial for the three and six months ended June 30, 2009.
  • 9. Yahoo! Inc. Business Outlook The following business outlook is based on current information and expectations as of July 21, 2009. Yahoo!'s business outlook as of today is expected to be available on the Company's Investor Relations website throughout the current quarter. Yahoo! does not expect, and undertakes no obligation, to update the business outlook prior to the release of the Company's next quarterly earnings announcement, notwithstanding subsequent developments; however, Yahoo! may update the business outlook or any portion thereof at any time at its discretion. Three Months Ending September 30, 2009 (6) Revenues (in millions): $ 1,450 - 1,550 Operating income before depreciation, amortization, and stock-based (7) compensation expense (or operating cash flow) outlook (in millions): Income from operations $ 55 - 65 Depreciation and amortization 160 - 180 Stock-based compensation expense 115 - 125 Operating income before depreciation, amortization, and stock-based compensation expense (or operating cash flow) $ 330 - 370 (6) This business outlook for the three months ending September 30, 2009 excludes any restructuring charges arising from our ongoing cost initiatives. (7) Refer to Note to Unaudited Condensed Consolidated Statements of Income.
  • 10. Yahoo! Inc. Unaudited Condensed Consolidated Statements of Cash Flows (in thousands) Three Months Ended Six Months Ended June 30, June 30, 2008 2009 2008 2009 CASH FLOWS FROM OPERATING ACTIVITIES: Net income $ 132,375 $ 143,040 $ 669,140 $ 261,735 Adjustments to reconcile net income to net cash provided by operating activities: Depreciation 125,913 138,636 243,470 273,502 Amortization of intangible assets 77,444 59,104 147,398 105,811 Stock-based compensation expense, net 123,168 104,926 248,173 231,646 Non-cash restructuring charges - 7,025 - 6,467 Tax benefits from stock-based awards 31,133 19,241 31,133 16,536 Excess tax benefits from stock-based awards - (45,059) - (67,186) Deferred income taxes 7,891 18,915 37,527 24,741 Earnings in equity interests (54,927) (64,156) (509,709) (113,090) Dividends received from equity investee 18,942 26,145 18,942 26,145 (Gain)/loss from sale of investments, assets, and other, net (512) (69,102) 5,365 (72,243) Changes in assets and liabilities, net of effects of acquisitions: Accounts receivable, net (3,544) 26,727 23,636 163,262 Prepaid expenses and other 2,660 2,351 (5,647) 4,618 Accounts payable 4,891 (39,932) (39,452) (69,621) Accrued expenses and other liabilities 8,381 31,102 54,616 (139,378) Deferred revenue (47,977) (17,169) 287,551 (48,802) Net cash provided by operating activities 425,838 341,794 1,212,143 604,143 CASH FLOWS FROM INVESTING ACTIVITIES: Acquisition of property and equipment, net (175,897) (94,674) (315,690) (165,155) Purchases of marketable debt securities (856,710) (932,412) (889,467) (2,173,606) Proceeds from sales of marketable debt securities 69,309 1,141 199,301 56,159 Proceeds from maturities of marketable debt securities 124,427 394,146 370,977 1,439,837 Proceeds from sales of marketable equity securities - 119,987 - 119,987 Acquisitions, net of cash acquired (13,476) - (179,609) - Purchase of intangible assets (42,302) (16,386) (51,160) (21,751) Other investing activities, net 2,714 (86) (7,877) (86) Net cash used in investing activities (891,935) (528,284) (873,525) (744,615) CASH FLOWS FROM FINANCING ACTIVITIES: Proceeds from issuance of common stock, net 190,875 67,120 317,445 71,052 Repurchases of common stock - - (79,236) - Excess tax benefits from stock-based awards - 45,059 - 67,186 Tax withholdings related to net share settlements of restricted stock awards and restricted stock units (4,119) (16,279) (56,612) (26,618) Other financing activities, net (74) - (74) - Net cash provided by financing activities 186,682 95,900 181,523 111,620 Effect of exchange rate changes on cash and cash equivalents (10,420) 56,167 17,299 20,642 Net change in cash and cash equivalents (289,835) (34,423) 537,440 (8,210) Cash and cash equivalents, beginning of period 2,341,205 2,318,509 1,513,930 2,292,296 Cash and cash equivalents, end of period $ 2,051,370 $ 2,284,086 $ 2,051,370 $ 2,284,086
  • 11. Yahoo! Inc. Unaudited Condensed Consolidated Balance Sheets (in thousands) December 31, June 30, 2008 2009 ASSETS Current assets: Cash and cash equivalents $ 2,292,296 $ 2,284,086 Short-term marketable debt securities 1,159,691 1,594,226 Accounts receivable, net 1,060,450 907,276 Prepaid expenses and other current assets 233,061 243,263 Total current assets 4,745,498 5,028,851 Long-term marketable debt securities 69,986 319,137 Property and equipment, net 1,536,181 1,430,377 Goodwill 3,440,889 3,461,604 Intangible assets, net 485,860 396,128 Other long-term assets 233,989 131,730 Investments in equity interests 3,177,445 3,308,402 Total assets $ 13,689,848 $ 14,076,229 LIABILITIES AND EQUITY Current liabilities: Accounts payable $ 151,897 $ 81,803 Accrued expenses and other current liabilities 1,139,894 964,422 Deferred revenue 413,224 416,659 Total current liabilities 1,705,015 1,462,884 Long-term deferred revenue 218,438 167,685 Capital lease and other long-term liabilities 77,062 87,197 Deferred and other long-term tax liabilities, net 420,372 438,014 Total liabilities 2,420,887 2,155,780 Total Yahoo! Inc. stockholders' equity 11,250,942 11,899,641 Noncontrolling interests 18,019 20,808 Total equity 11,268,961 11,920,449 Total liabilities and equity $ 13,689,848 $ 14,076,229